Lecture 07 - From perception to decision I
1/53
There's no tags or description
Looks like no tags are added yet.
Name | Mastery | Learn | Test | Matching | Spaced |
|---|
No study sessions yet.
54 Terms
Recap: What is the ventral pathway for?
‘what’ pathway
object recognition
What is the dorsal pathway responsible for?
‘where’ pathway
motion
What region specifically is responsible for motion?
MT
What can we use to identify brain areas related to motion perception?
PET (positron emission tomography)
monitoring approach
What is PET?
functional mapping technique
uses radioactive substances to identify and measure changes in metabolic processes
tracking blood flow/hemodynamic response
using O15
What is PET more commonly used for?
less used for functional mapping
allows detecting specific metabolites in disease
What monitoring approach can we use for finding areas involved in motion? Which area was found to be active?
use PET
compare responses for moving and static stimuli
V5 or MT has been implicated in motion perception
How can we use a perturbative approach to study motion perception?
looked at lesions linked to MT
= akinetopsia
What is akinetopsia? Why is it hard to study?
inability to perceive motion
views world in stop motion
usually due to bilateral lesions in V5
bilateral lesions in V5 often also target other visual areas and aren’t localized
these impact other visual tasks
What is important when linking cognitive deficits to a given brain area?
behavioural testing for specificity of symptoms
need to run a number of control tasks
What is famous persons test?
TD could tell if a photo was of a famous person, look-alike, or unknown person
What is the overlapping figures test?
TD identified all overlapping figures except one; could then recognize it when outlined with a pen.
What is the Giuseppe Arcimboldo paintings test?
TD identified both the small details (vegetables, fruits, etc.) and the overall face composition.
What is the optic ataxia test?
TD could touch the designated finger of the test leader in the air.
What is the oculomotor apraxia test?
TD could follow the test leader’s finger movement with her eyes.
What test was done for akinetopsia?
They presented moving stimuli (dots, lines, objects) and asked her to report the direction and velocity.
She consistently failed to perceive continuous motion above a certain speed (18 and 13 deg/s). Instead, she described it as a series of static snapshots and she could tell you order of successive positions
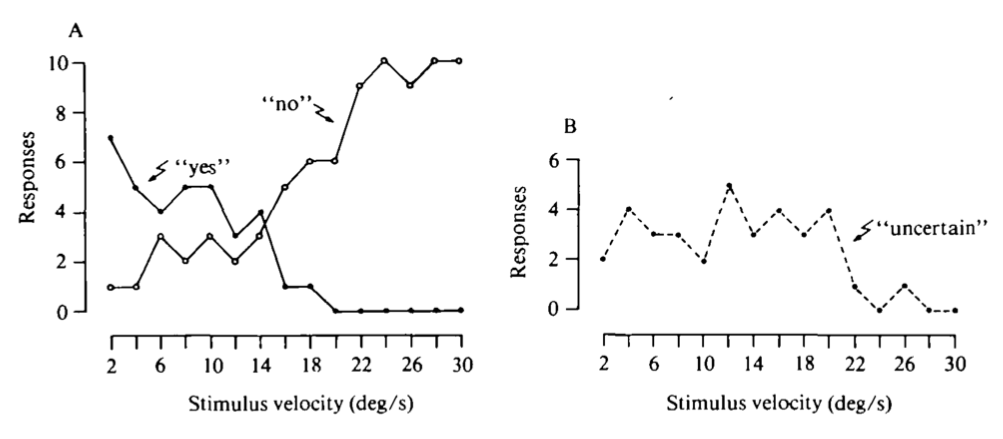
For the akinetopsia testing, what are these graphs depicting?
patient was asked to judge whether she could perceive a moving spot of light at different stimulus velocities
x-axis = stimulus velocity
y-axis = number of responses
yes line = number of times the patient reported seeing motion
no line = number of times the patient reported not seeing motion
What were the results from the test both vertical and horizontal motion?
could perceive motion at low speeds (2–10°/s) but above ~13–18°/s she mostly said “no”
Where in the brain order do neurons respond to static vs. moving random dot pattern? Is this conserved across species?
response in higher visual areas in both species
in V2/V3 and MT/V5
similar architecture in higher visual areas for human and macaque
How did we measure causal relationship in macaque for MT?
lesion in MT using neurotoxic lesion
measure motion sensitivity thresholds as a function of speed and motion strength
How does coherence of dot motion control difficulty?
0% coherence means no global motion and very difficult
50% coherence = partial
100% coherence = easiest task
What impairments in motion sensitivity result from MT lesions in macaques?
MT lesions cause severe, selective deficits in motion perception
monkeys need much higher coherence levels in RDM especially in visual field region corresponding to the lesioned MT
other aspects of vision remain intact
What is important that experimenters do to contrast study? What did experimenters do with macaques and motion test to contrast?
need a control task to make sure that motion is specific to MT
did control task of reporting orientation of static grading
lesion in MT did not affect this
What are the properties of single neurons in area MT?
tuned for motion orientation direction like V1
each neuron responds maximally to motion in one direction and much less/not at all to the opposite direction
How do we create population averages for motion orientation in MT neurons?
record firing rates across many neurons
preferred direction (max firing) is set to 1
record other neurons and average their direction-tuning
vector averaging method
How do we measure whether an MT neuron is narrowly or widely tuned?
neurons that are narrowly tuned have population average curve with a sharper, steeper peak around the preferred direction
neurons that are widely tuned have population curve with broader and flatter, spreading out across directions
What is found when comparing orientation selectivity across nearby neurons? What is this similar to?
nearby neurons are tuned to the same orientation
consistent with V1 orientation maps
How is speed tuning measured in MT neurons?
present moving visual stimuli at different speeds and record each neuron’s firing rate
neuron’s preferred speed is where firing is maximal
produces a non-monotonic, bell shaped curve
Do neurons have different preferred speeds?
yes!
receptive field is tuned to a preferred speed
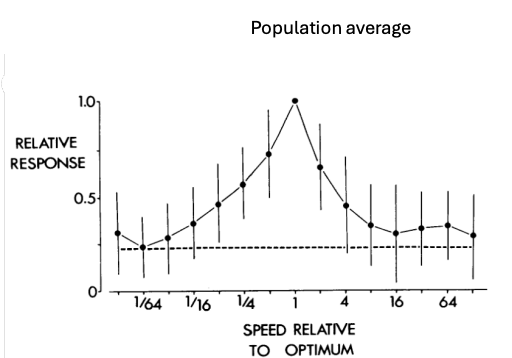
How can we create a speed relative to optimum graph?
for each neuron: divide its firing rate by max firing rate (preferred speed = 1)
plot speed as a ratio to the neuron’s optimum
if neuron prefers 16deg/s then 8deg/s is 0.5x optimum
if a neuron prefers 16deg/s then 32deg/s is 2x optimum
use fraction of speed relative to optimum to average neurons together to get a population picture
Recap: What are the two properties of speed tuning in MT?
non-homogenous distribution of speed tuning across the population
not all neurons are tuned to the same speed
cells closer to each other tend to have more similar speed tuning
Describe the monitoring behavioural study on macaque to test if MT neurons contribute to perception?
monkey has to hold gaze on FP
stimulus appears (RDM)
two target LEDs appear at separate locations
monkey makes a saccade to the target corresponding to the perceived direction of motion
repeat trials with different stimulus correlations
What do we use a psychometric curve to measure? How do we vary the difficulty of the macaques task?
measures behavioural accuracy
vary difficulty of the decision by changing the correlation of the dots
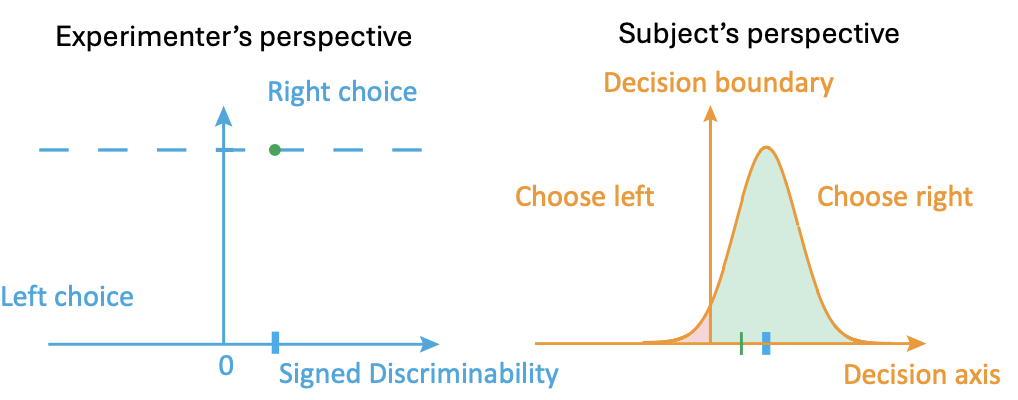
What does this task look like graphically for an experimenter vs. a subject?
The experimenter knows the true stimulus direction (left vs. right).
They set the stimulus strength
a strong stimulus → consistent correct choice.
Subject’s perspective
The subject (monkey) doesn’t see “correlation %,” they just perceive noisy evidence.
Their brain sets a decision boundary along a decision axis
If perceived evidence falls to the left → choose left. If to the right → choose right.
What is noise structure in a study?
variability in neural/psychological processing → sometimes there are errors, even with strong signals.
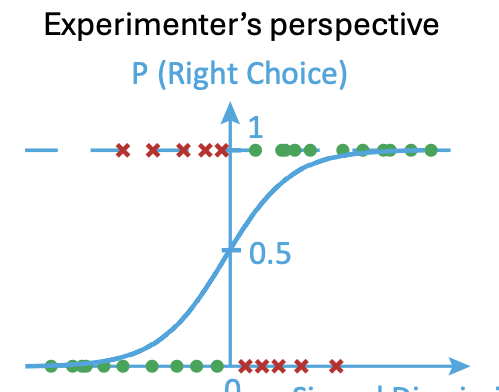
Explain constructing a psychometric curve:
plot probability of choosing correct against stimulus strength
creates sigmoidal psychometric curve
P = right choice
at neutral stimulus (0 direction) monkey is 50/50 left vs. right
as stimulus strength grows, responses get more consistent with 1 or 0
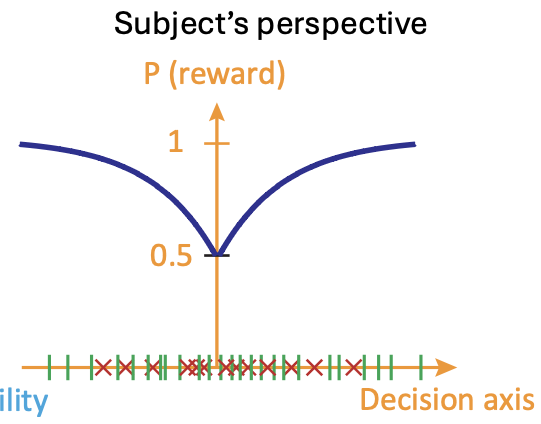
What is the subject’s reward graph?
P = reward
if monkey chooses correctly, reward probability is high (around 1)
if evidence is ambiguous, reward probability drops (around 0.5)
On the graph, what is higher correlation of dots correlated with? What is 0% correlation of dots equal to?
greater correlation of dots = greater proportion of correct answers
0% correlation of dots = 50% accuracy
What are two equivalent ways to plot psychometric curves?
accuracy vs. stimulus strength
proportion of choosing one option vs. signed stimulus strength
Describe Psychometric curve (proportion of choice)
X-axis: Signed evidence (negative = leftward motion, positive = rightward motion).
Y-axis: Probability of choosing ‘right’.
At 0 (ambiguous stimulus), subject is around 50/50.
Strong leftward evidence → probability of right choice goes down toward 0.
Strong rightward evidence → probability of right choice goes up toward 1.
The curve is sigmoidal (S-shaped) and centered on the decision boundary.
Psychometric curve: change in sensitivity
change in slope of curve
steeper slope = smaller noise and better discrimination (less correlation to make accurate decision)
shallower slope = more noise/less sensitivity
Psychometric curve: Change in bias
curve shifts left or right
subject favours one choice
How does neuron’s firing rate compare to behaviour for motion discrimination in each direction?
at 0% coherence, firing looks similar for both directions
as coherence increases, firing distributions separate and its easier to predict which way the stimulus is moving from neuron spikes
What is the neurometric curve?
plots how accurately stimulus direction can be predicted based only on a neuron’s firing rate
What is psychometric vs. neurometric curve? What does comparing them tell us?
psychomtric shows behavioural accuracy
neurometric shows a single neuron’s accuracy
comparing them reveals whether that neuron could explain the subject’s decisions
What was found when study compared the neurometric and psychometric curves?
neuron is as sensitive as monkey
for some neurons, there is basically no difference between behaviour and neural activity
some neurons are more sensitive than behaviour and some as less sensitive than behaviour
What is the average threshold ratio of neuron to behaviour? What does this tell us correlationally?
threshold ratio is centered around 1
threshold of neuron is similar to threshold of behaviour
strong correlation of how accurate cells/neurons are determining stimulus and how accurate monkey is at behavioural task
What is correlation level of tuning of MT and behavioural ability to discriminate motion?
strong!
How can we test for perceptual sensitivity to motion discrimination? Describe task.
Subjects are shown two gratings (moving bars) one after the other.
One is the reference grating (fixed at 8°/s).
The other is the test grating (varied speeds: faster or slower).
Subjects report which grating moved faster.
build psychometric curve
What is TMS?
strong magnetic field over scalp
perturbs activity in region temporarily
non-invasive
poor spatial resolution; good temporal
can only activate superficial areas of brain
What happen when experimenters used TMS on V5/MT for static spatial frequency task?
no effect
these regions (V5/MT) aren’t critical for static spatial judgement
What happen when experimenters used TMS on V1 for motion speed discrimination?
no effect
What happen when experimenters used TMS on V1 for motion speed discrimination?
clear deficit
psychometric curve shifts (higher threshold for detection)
no slope change since sensitivity itself isn’t worse but subjects need more evidence to make same judgement
What did the TMS motion study tell us?
casual link: V5/MT and V3a are specifically needed for motion perception