Chapter 19: The Inheritance of Complex Traits
1/35
There's no tags or description
Looks like no tags are added yet.
Name | Mastery | Learn | Test | Matching | Spaced |
|---|
No study sessions yet.
36 Terms
3 types of traits and their inheritance
Continuous/Quantitative traits —> complex inheritance
Meristic Traits —> complex inheritance
Categorical traits —> simple and complex inheritance
Variance
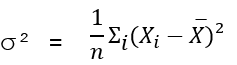
Standard deviation
square root of variance
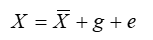
Phenotypes can be decomposed into …
their genetic and environmental contribution.
X is the value of the trait for an individual member of a population
X bar is the population mean for the trait
g is the genetic deviation of the individual
e is the environmental deviation of the individual

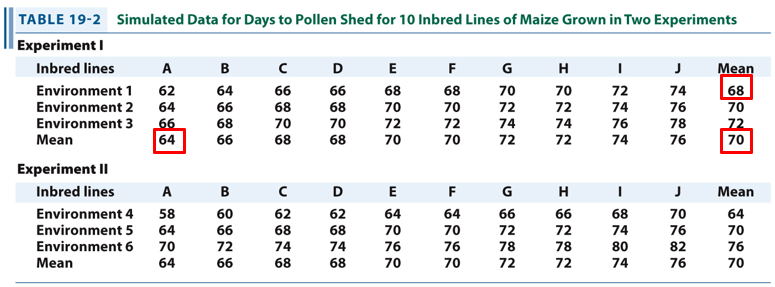
Determine the environmental and genotypic variation of line A grown in environment 1.
Model: X = Xmean + g + e
X = 62
Xmean = 70
The mean for all lines in environment 1 is 68. This value deviates from the population mean by -2 (68 - 70 = -2). Thus, e = -2.
The mean of line A over all 3 environments is 64. This deviates from the population mean by -6 (64 - 70 = -6). Thus, g = -6
Combining the two values, we indeed get:
62 = 70 - 6 - 2
Subtracting population mean from simple genetic model for quantitative traits.
X = Xmean + g + e
X - Xmean = g + e
x = g + e
x is the phenotypic deviation (i.e. deviation of the trait of an individual from the population mean for that trait)
g is the genetic deviation
e is the environmental deviation
Covariance
Measure of association between two traits.
cov = E[ xy ]
no association —> cov = 0
large values of X associated with large values of Y —> cov > 0
large values of X associated with small values of Y —> cov < 0
Relation between trait variance, genotypic variance, environmental variance, and covariance.
We know that:
Vx = Vg + Ve
Vx = E(x²)
x = g + e
Thus:
Vx = E[ (g + e)² ]
Vx = E[ g² + e² + 2ge ]
Vx = E[ g² ] + E[ e² ] + E[ 2ge ]
Vx = E[ g² ] + E[ e² ] + 2E[ ge ]
E[ g² ] = Vg is the genetic variance
E[ e² ] = Ve is the environmental variance
E[ ge ] is the covariance between g and e.
Vx = E[ g² ] + E[ e² ] + 2E[ ge ]
Explain what happens to this equation if different genotypes are placed into different environment at random.
Genotype and environment are independent so the covariance E[ ge ] = 0:
Vx = E[ g² ] + E[ e² ] = Vg + Ve
Trait variance (with important assumption)
Vx = Vg + Ve
Equation tells us that the trait variance Vx is the sum of the genetic variance and the environmental variance.
Important assumption: genotype and environment are not correlated.
Phenotypic variance is the sum of …
the variance due to the different genotypes in the population and the variance due to the different environments within which the organisms are reared.
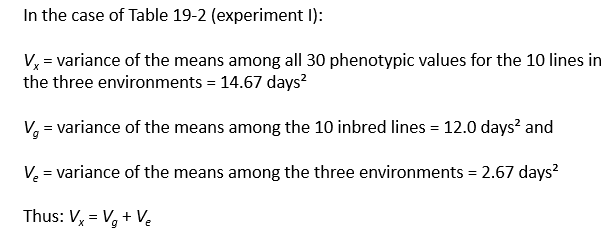
Using the values for experiment 1, check that
Vx = Vg + Ve.
Correlation VS Covariance
Correlation: values between - 1 and 1
Covariance: values between -inf and +inf
What does Nature VS Nurture mean?
Refers to the question of how much of the variation in a population is due to genetic factors and how much is due to environmental factors.
What is broad-sense heritability?
Broad-sense heritability (H²) is the part of the phenotypic variance that is due to genetic differences among individuals in a population.
H² = Vg / Vx = Vg / (Vg + Ve)
H is squared because it is the ration of two variances
H² = 0 —> all the variation in a population is due to environmental sources (i.e. the trait is not heritable).
H² = 1 —> all the variation in a population is due to genetic sources (i.e. the trait is heritable).
Covariance between identical twins who are reared apart.
Cov = Vg because the only shared factor influencing both twins is their genetic makeup.
Equation used in twin-studies for bread-sense heritability.
H2 = COV(X’, X’’) / Vx
This is because for identical twins who are reared apart, COV(X’, X’’) = Vg
X’ is the value of the trait of interest of the first twin, and X’’ that of the second twin.
Key points to keep in mind when analysing twin-study data.
H2 is a property of a particular population and environment. Estimates of H2 can thus differ among populations and environments.
The estimate of H2 will be inflated because the twin babies are normally placed in economically, socially, and emotionally stable households. As a result, Ve is smaller than in the general population.
For twins, prenatal effects could cause a positive correlation between genotype and environment, even if they are reared apart.
Heritability is not useful for interpreting differences between groups. For example; the heritability for height in humans can be very high. However, this does not tell us anything about whether groups with different heights differ because of genetics or the environment.
Explain what narrow-sense heritability is.
Narrow-sense heritability provides a measure of the degree to which the genetic constitution of individuals determines the phenotypes of their offspring.
More specifically, narrow-sense heritability (h²) is the ratio of the additive variance to the phenotypic variance.
Different modes of gene action.
Additive gene action: when the heterozygote’s trait value is midway between those of the two homozygous classes.
Dominant gene action: one allele is dominant over other one.

How do the different modes of gene action influence heritability?
When gene action is additive and there is no environment effect, the phenotype is fully heritable.
When gene action is dominant and there is no environment effect, the phenotype is not fully heritable.
When there is dominance , we cannot strictly predict the offspring’s phenotypes from the parent’s phenotypes.
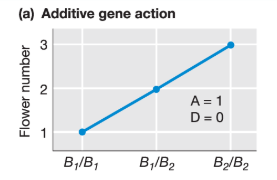
What is the additive effect for this trait?
A = (XB2B2 - XB1B1) / 2 = (3 - 1) / 2 = 1
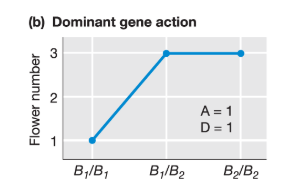
What is the dominance effect for this trait?
D = XB1B2 - (XB2B2 + XB1B1) / 2 = 3 - (3 + 1)/2 = 1
What is the degree of dominance?
Ratio of the additive effect to the dominance effect.

Marine populations have long pelvic spines, while populations living in freshwater near the bottom have reduced pelvic spines. Pitx1 is one of the several genes contributing to pelvic-spine length. Pelvic spine length in an F2 population that segregated for the marine or long allele (l) and freshwater or short (s) allele of Pitx1 is shown in the table.
Calculate the additive and dominance effects at this locus. What is the degree of dominance of this locus?
A = (0.148 - 0.068) / 2 = 0.04
D = 0.132 - (0.068 + 0.148) / 2 = 0.024
D/A = 0.024 / 0.04 = 0.6 —> allele l is partially dominant to allele s.
Improved model with additivity and dominance.
Original model: x = g + e
Improved model: x = a + d + e
a is the additive deviation
d is the dominance deviation
e is the environmental deviation
Additive deviation is also called …
the breeding value, or the part of an individual’s deviation from the population mean that is due to additive effects.
Improved equation for phenotypic variance
Vx = Va + Vd + Ve
The genetic deviation (g) of an individual from the population mean is composed of …
the additive deviation a and the dominance deviation d.
The additive deviation, also known as the breeding value, and it represents …
the component of an individual’s phenotype that is transmitted to its offspring.
Narrow-sense heritability equation
h² = Va / Vx = Va / Va + Vd + Ve
Va can be estimated from the covariance between a parent and its offspring as:
Va = 2COVP,O
h² = 2COVP,O / Vx
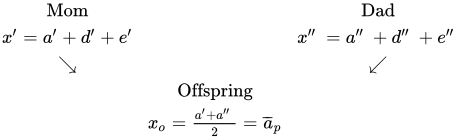
Expected offspring phenotypic deviation
Only factor that parents transmit to their offspring is their additive deviation. We can estimate the offspring’s phenotypic deviation xoff as the mean of the additive deviations of its parents:
xoff = (a’ + a’’) / 2
The additive deviation of the parents can be estimated as â = h²x, so:
xoff = (h²x’ + h²x’’) / 2 = h² (x’ + x’’)/2
The offspring will have its own dominance and environmental deviations. However, these cannot be predicted. Since they are deviations, they will be zero on average over a large number of offspring.
Icelandic sheep are priced for the quality of their fleece. The average adult sheep in a particular population produces 6 lb of fleece per year. A sire that produces 6.5 lb per year is mated with a dam that produces 7.0 lb per year. The narrow-sense heritability of fleece production in this population is 0.4. What is the predicted fleece production for offspring of this mating?
Xmean = 6 lb/year —> population mean
X’ = 6.5 lb/year —> phenotype value of sire
X’’ = 7 lb/year —> phenotype value of dam
Thus, we can calculate the phenotypic deviations of the parents:
x’ = X’ - Xmean = 6.5 - 6 = 0.5 lb/year
x’’ = X’’ - Xmean = 7 - 6 = 1 lb/year
We know that xoff = h² (x’ + x’’)/2:
xoff = 0.4 * (0.5 + 1)/2 = 0.3
The predicted offspring phenotypic deviation is 0.3. Thus, the predicted fleece production of the offspring is:
Xoff = Xmean + xoff = 6 + 0.3 = 6.3 lb/year.
This value is lower than the mean of the parents, but this is expected for a trait with moderate heritability (0.4). Most (60%) of the superior performance of the parents is due to the dominance and environmental factors that are not transmitted to the offspring.
Estimating the narrow sense heritability from the results of an artificial selection experiment.
Explain the differences between broad-sense and narrow sense heritability.
Technique to find QTLs
QTL mapping