2.2.5 energy profiles with and without catalysts and maxwell-boltzman distribution curves
1/15
There's no tags or description
Looks like no tags are added yet.
Name | Mastery | Learn | Test | Matching | Spaced | Call with Kai |
|---|
No analytics yet
Send a link to your students to track their progress
16 Terms
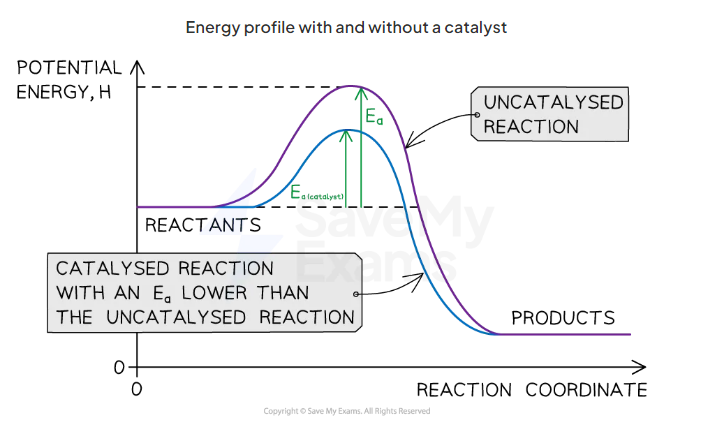
how do catalysts increase rate of reaction
provide reactants with an alternative reaction pathways which is lower in activation energy than the uncatalysed reaction
what happens to the catalyst after the reaction
it remains chemically unaltered
what 3 ways do catalysts reduce environmental impact of industrial processes
reduce energy requirements as reactions can occur at lower temperatures and pressures
reduce waste products as can be reused and only in small quantities so increase atom economy
increase selectivity of processes,
promoting specific reactions and supressing undesired side reactions
draw the reaction profile with and without a catalyst for an exothermic reaction
what does a maxwell boltzmann distribution curve show
distribution of energies at a certain temperature
draw example maxwell boltzman curve
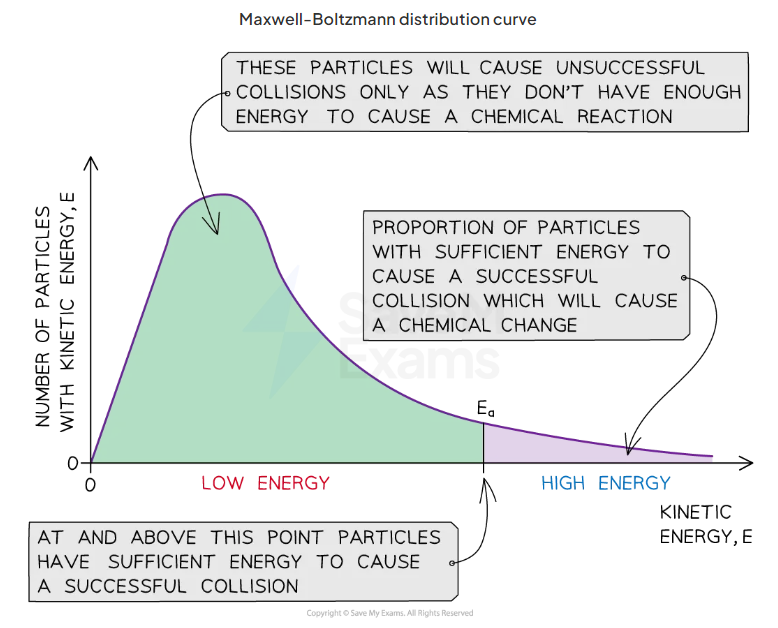
what does the graph show about the amount of particles with the activation energy
only a small proporiton of particles in the sample have enough energy for a successful collision and for a chemical reaction: only small amount past activation energy
where is the most probable energy
at the highest point of the curves peak
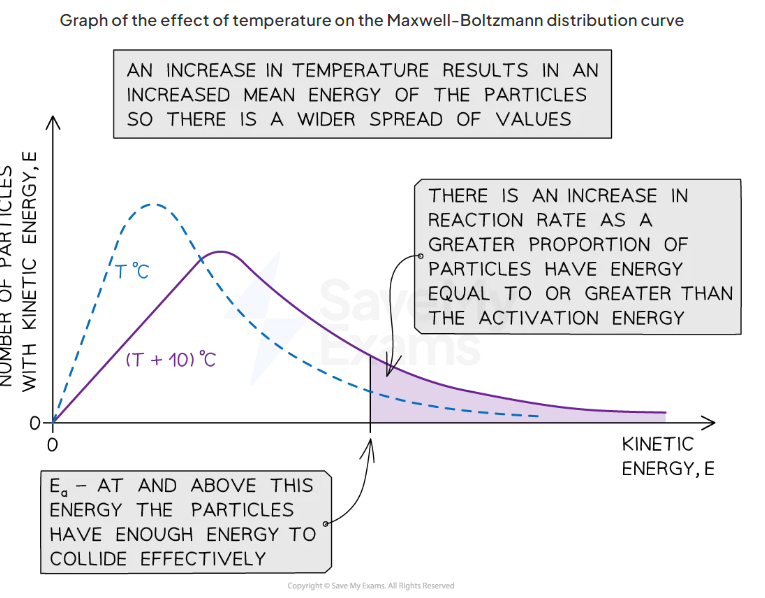
what happens to the curve when temperature increases
curve flattens and peak shifts to the right
why
when temp increases, particles gain more kinetic energy so particles move around faster resulting in more frequent collisions and higher proportion of particles posses activation energy
draw an example of maxwell boltzmann curve with increased temperature
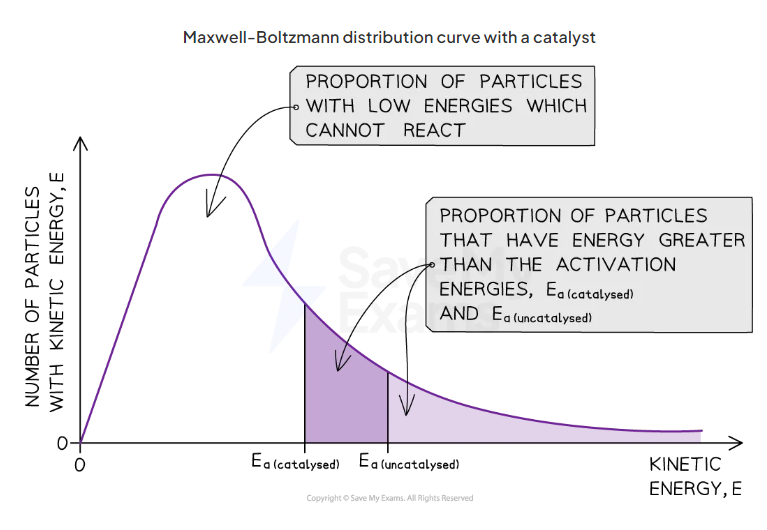
what happens to the curve with a catalyst
curve remains the same but activation energy closer to y axis and so more particle have the minimum energy
why
catalysts provide another reaction pathway with lower activation energy so with lower ea greater proportion have sufficient energy for a successful collison
draw the maxwell boltzman distribution curve with a catalyst
is the peak of a higher temperature more to the right or left and lower or higher
more to the right and lower
what is the area under the graph
the particles with that energy