Class 16 (Unit 7)
1/54
There's no tags or description
Looks like no tags are added yet.
Name | Mastery | Learn | Test | Matching | Spaced | Call with Kai |
|---|
No analytics yet
Send a link to your students to track their progress
55 Terms
Alternative hypothesis
The statement making the claim we are trying to support
Alternative hypothesis denoted
Ha
how do we look at alternative hypothesis in term of μ
Ha : µ > µ0, Ha : µ < µ0, Ha : µ ≠ µ0
What does the hypothesis test assess
the evidence in favour of the alternative hypothesis
Example (Ha: μ < 75) {alternative hypothesis}
the average daily vitamin C intake of Canadian females is less than 75 mg
Example (Ha: μ > 60) {alternative hypothesis}
the average speed of all drivers at the intersection is greater than 60km/h
Null hypothesis
The statement being tested in a hypothesis test is called
Null hypothesis is denoted
Ho
What is our initial assumption
null hypothesis
what does the null hypothesis look like in terms of μ in this unit?
Ho: μ = μ0
What is Ho a statement of?
Statement of “no change”, “no di!erence” or “no e!ect”
What does the hypothesis test assess?
assesses the strength of the evidence against the null hypothesis
Example (Ho: μ = 75) {null hypothesis}
the average daily vitamin C intake of Canadian females is equal to 75 mg
Example (Ho: μ = 60) {null hypothesis}
the average speed of all drivers at the intersection is equal to 60km/h
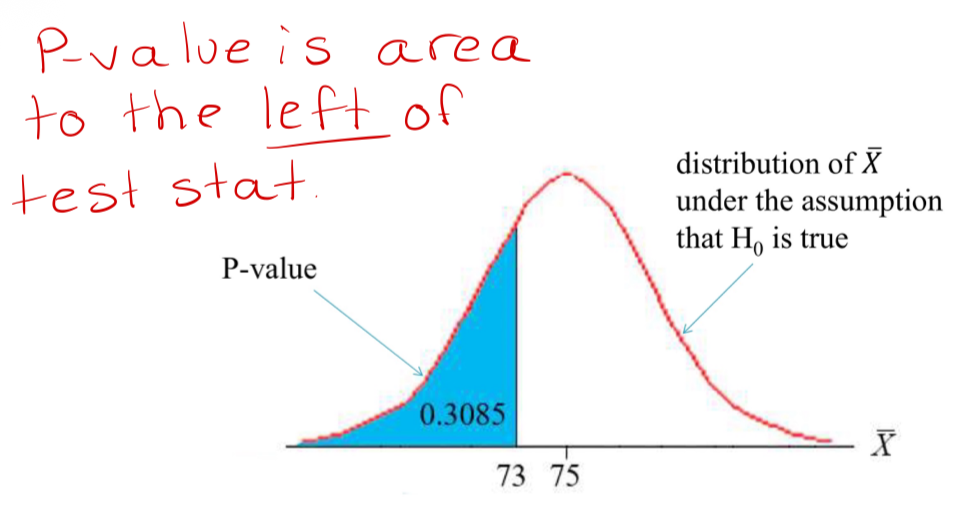
P-value of the test
If we assume that the null hypothesis is true, then the probability of observing a sample mean ¯ x at least as high/low/extreme as the one observed
High (p-value)
if our alternative hypothesis is of the form Ha : µ > µ0
Low (p-value)
If our alternative hypothesis is of the form Ha : µ < µ0
Extreme (p-value)
if our alternative hypothesis is of the form Ha : µ ≠ µ0
A low p-value means
we have strong evidence against the null hypothesis/in favour of the alternative hypothesis
Was the vitamin C example low enough to reject it?
P-value was 0.3085. Was not low enough to reject our original assumption that µ = 75 (i.e. reject H0) and to conclude that µ < 75 (i.e. conclude in favour of Ha) .
Was the speeding vehicle example low enough to reject it?
P-value was 0.0023. Was low enough to reject our initial assumption that µ = 60 (i.e. reject H0) and conclude that µ > 60 (i.e. conclude in favour of Ha).
How low does our P-value need to be to reject the null hypothesis in favour of the alternative hypothesis?
It depends! Before we perform a hypothesis test, we choose the level of significance of our test, denoted α.
if the p-value is less than or equal to α (reject the null hypothesis)
then we will reject H0 in favour of Ha
(reject the null hypothesis)
P-value is greater than α (reject the null hypothesis)
then we fail to reject H0
What is α then
α is the maximum P-value for which the null hypothesis will be rejected
Low α
we require strong evidence to reject Ho
When would you select the level of significance in real life?
before conducting the test
What if something is “high stakes”
then you require strong evidence: choose a low value of α
High stakes example
deciding if a medication is safe
What if something is “low stakes”
then you don’t need evidence to be that strong: choose a higher value of ε
What are the most common values of α (alpha)
0.01, 0.05, and 0.10
what value of α would we almost never use higher than
higher than 0.10
P-value method (hypothesis test steps)
State the level of significance, α
Statement of hypotheses, H0 and Ha
Statement of the decision rule
Calculation of the test statistic
Calculate the P-value
Conclusion
Decision rule (rejection rule)
is a precise statement of what must happen in order for us to reject the null hypothesis
What is the decision rule always?
Reject H0 if the P-value ≤ α
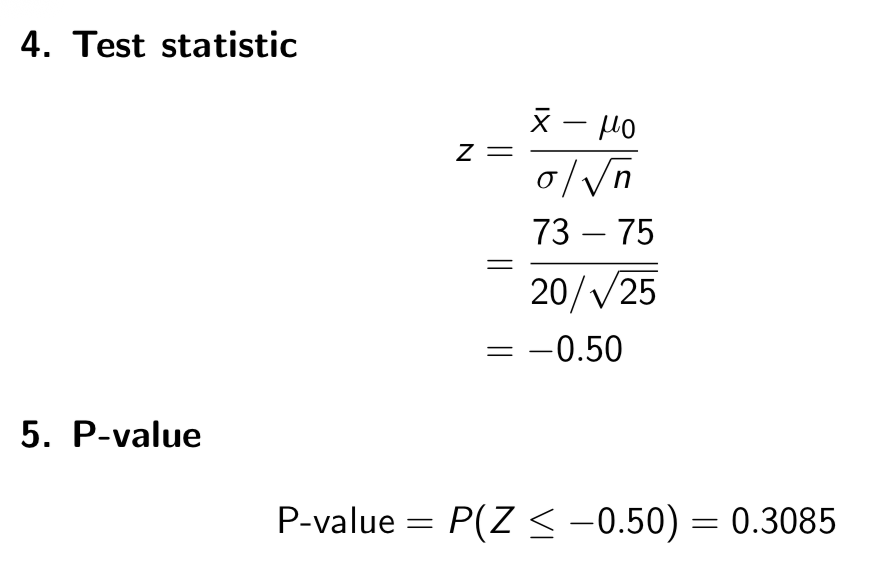
Test statistic
provides a measure of the compatability between the null hypothesis and our data
What our test statistic will always be
Z
Example: Perform a hypothesis test with a 5% level of significance for the car intersection example.
State the level of significance, α
α = 0.05
Statement of hypotheses, H0 and Ha
H0 : µ = 60 vs Ha : µ > 60
Statement of the decision rule
Reject H0 if the P-value < = 0.05
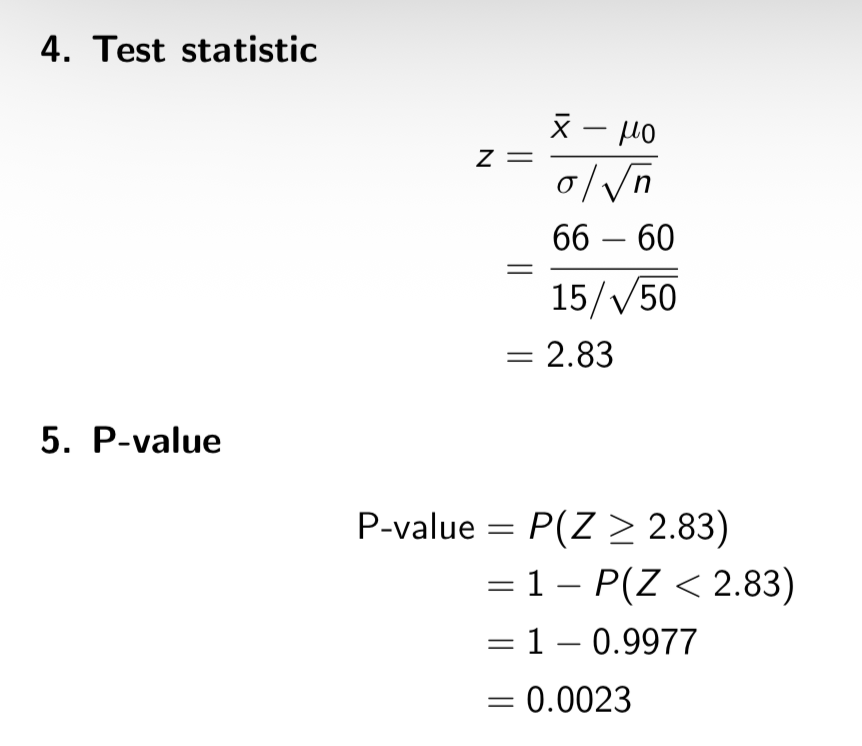
Calculation of the test statistic
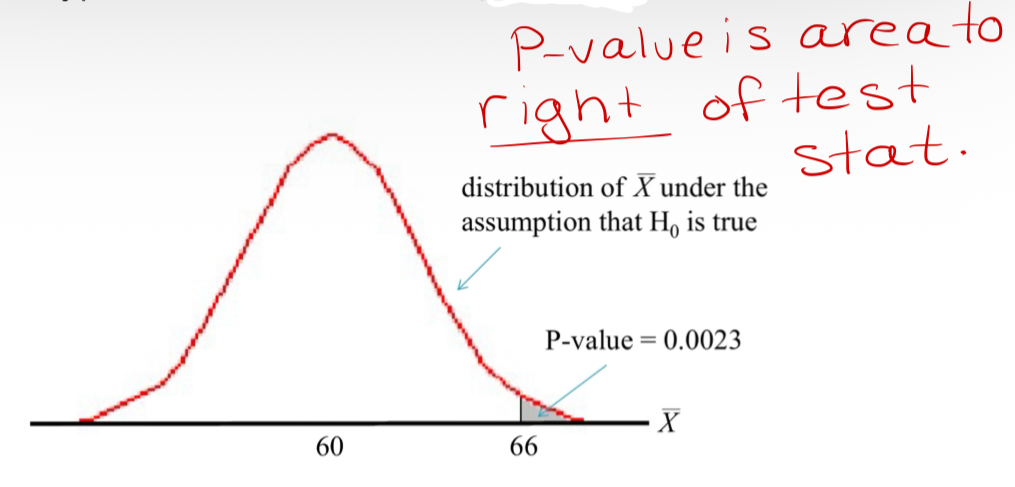
Calculate the P-value
P-value interpretation:
“If the true mean speed of vehicles atthis intersection was 60, the probability of observing a sample mean at least as high as 66 would be 0.0023.”
Conclusion
Since the P-value = 0.0023 < α = 0.05, we reject the null hypothesis in favour of the alternative. At a 5% level of significance, we have su”cient statistical evidence to conclude that the true mean speed of motorists at the intersection is greater than 60 km/hr.
Right-sided test
since our alternative hypothesis is of the form Ha : µ > µ0
What makes something statistically significant
Results that lead to the rejection of a null hypothesis
What is statistical significance?
is an effect so large that it would rarely occur by chance alone
What are statistical hypothesis tests also called?
Tests of significance
Example: Perform a hypothesis test for the vitamin C example. Use α = 0.01
State the level of significance, α
Let α = 0.01
Statement of hypotheses, H0 and Ha
H0 : µ = 75 vs Ha : µ < 75
Statement of the decision rule
Reject H0 if P-value ≤ α = 0.01
Calculation of the test statistic
Calculate the P-value
interpretation
“If the true average daily Vitamin C intake for Canadian females was 75mg, the probability of observing a sample mean at least as low as 73 mg would be 0.3085”
Conclusion
Since the P-value = 0.3085> ε = 0.01, we fail to reject the null hypothesis. At the 1% level of significance, we have insuffcient statistical evidence that the true mean Vitamin C intake for Canadian females is less than 75 mg.
What do you notice from looking at these examples?
We never conclude that H0 is true. All we can say is that we do not have enough evidence to reject the null hypothesis.
NEVER SAY “ACCEPT H0”!!!!
Left-sided test
We call the previous example a left-sided test, as the alternative hypothesis is of the form Ha : µ < µ0
Is there any significant difference between left and right sided hypothesis tests?
It is the alternative hypothesis, and how we calculate the P-value.
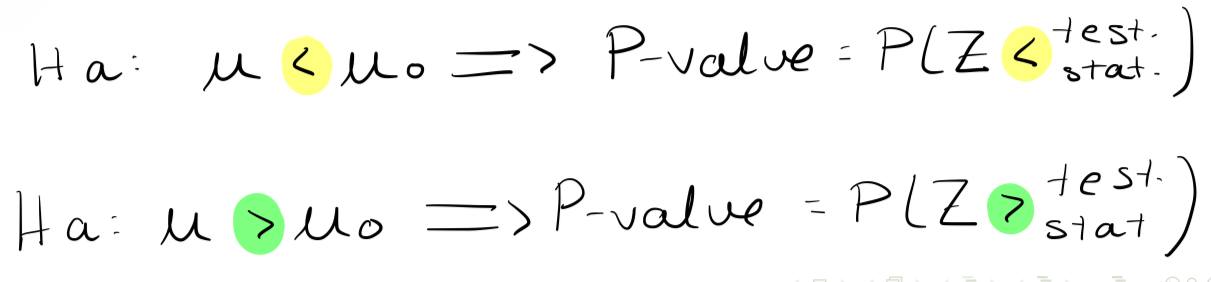
What is a simple rule for remembering the difference between calculating the P-value for the left- and right-sided tests?
The direction of the inequality in the P-value is the same as the direction of the inequality in the alternative hypothesis
Conclusion template (P-value method)
Since the P-value = P-value < / > α, we reject/fail to reject H0. At the α level of significance, we have sufficient/insufficient evidence that Ha is true
Fill in Bold items in context of the questions
What is the last type of hypothesis we’ll look at?
two sided test
two-sided tests are
hypothesis tests that consider deviations on both sides of the null hypothesis.
What form does the alternative hypothesis of a two sided test look like?
Ha: µ ≠ µ0
P-value (two-sided test)
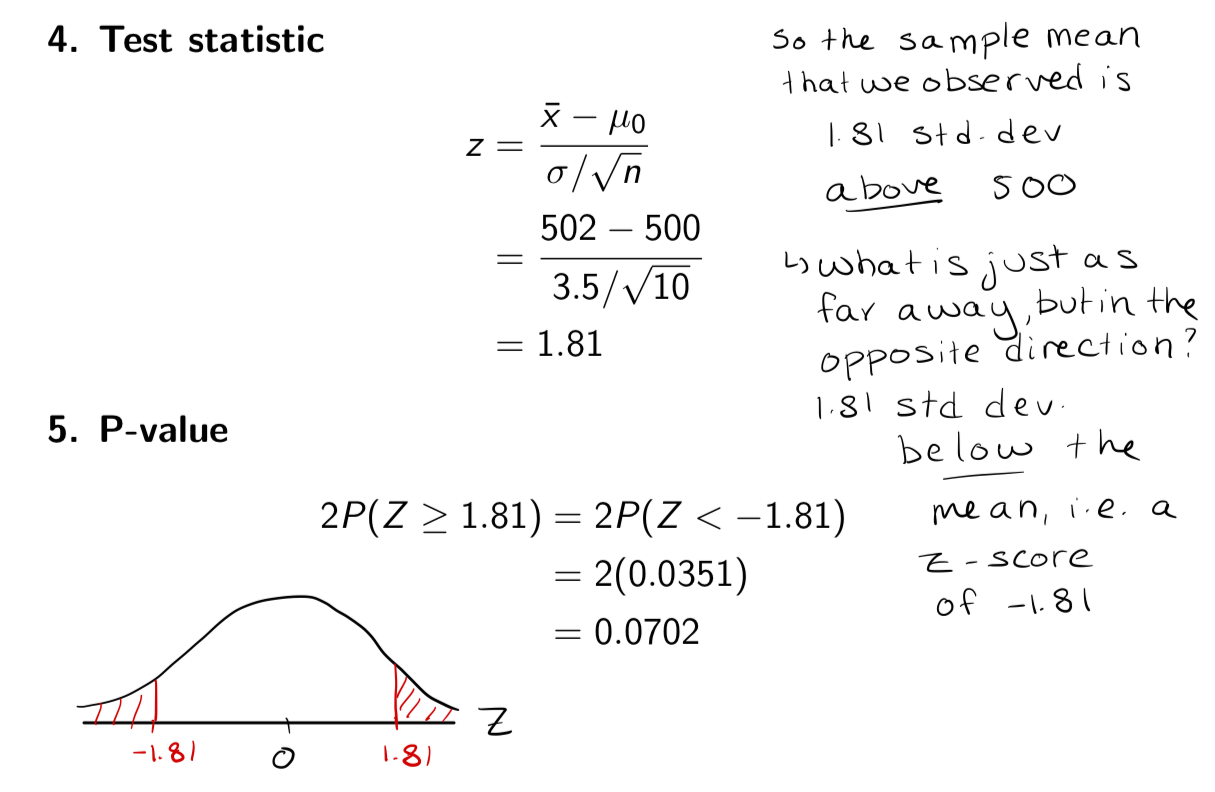
P-value is the probability of observing a value of the sample mean at least as extreme (in either direction), (given that the null hypothesis is true)
What does “at least as extreme” mean?
at least as far away from our hypothesized population mean, µ0
Two sided hypothesis test example
Example: The Mackenzie Valley Bottling Company distributes root beer in bottles labeled 500 ml. They routinely inspect samples of 10 bottles prior to making a large shipment, to detect if the true mean volume in the shipment di!ers from 500 ml. If the bottles are underfilled, the company could be sued for false advertising. If the bottles are overfilled, the company is spending more money than they need to.
Suppose it is known that fill volumes for the bottles of root beer follow a normal distribution with a standard deviation of 3.5 ml. One random sample of 10 bottles results in a sample average volume of 502 ml.
Does this provide convincing evidence that the true mean fill volume for the shipment di!ers from the advertised amount of 500 ml? Perform a hypothesis test with a 5% level of significance,
State the level of significance, α
Let α = 0.05
Statement of hypotheses, H0 and Ha
H0 : µ = 500 vs Ha : µ ≠ 500
H0 : The true mean volume of root beer in all bottles in the shipment is 500 ml
Ha: The true mean volume of root beer in all bottles in the shipment di!ers from 500 ml
Statement of the decision rule
Reject H0 if P-value ≤ α = 0.05
Calculation of the test statistic
Calculate the P-value
P-value interpretation
“If the true mean fill volume was 500 ml, the probability of observing a sample mean at least as extreme as 502 ml would be 0.0702”
Conclusion
Since the P -value = 0.0702 > ε = 0.05, we fail to reject H0. At the 5% level of significance, we have insu”cient evidence that the true mean volume of all bottles in the shipment di!ers from 500 ml.