Unit 7 (Chapter 8): Confidence Intervals
1/15
There's no tags or description
Looks like no tags are added yet.
Name | Mastery | Learn | Test | Matching | Spaced | Call with Kai |
|---|
No analytics yet
Send a link to your students to track their progress
16 Terms
Confidence interval
An interval of vales that attempts to capture the true value of a population characteristic. A confidence interval estimates the value of the unknown population parameter.
When we say “we have a 95% confidence interval'“, we mean “if we sampled a population 100 times, then we would expect about 95 out of 100 sample confidence intervals to capture the true population parameter.”
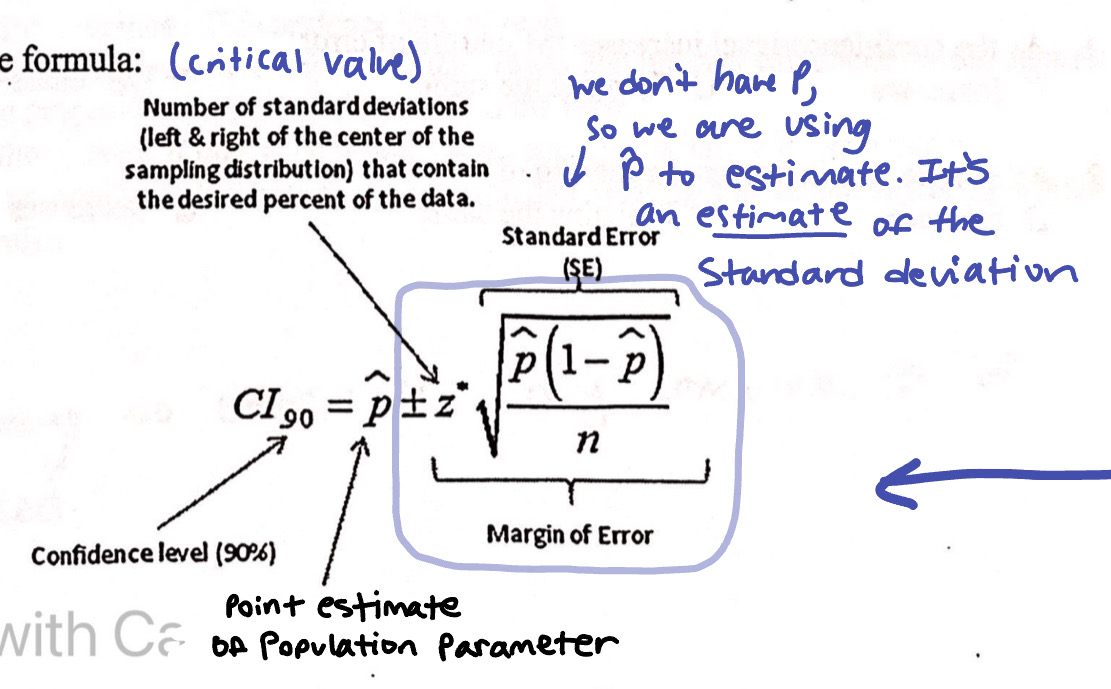
Confidence interval formula (proportions)
How to find z* (proportions)
90% CI → InvNorm(0.90) + select “CENTER”
What is the standard error

The standard error is an estimate of the standard deviation of the sampling distribution. We use p^ instead of p since we do not know p.
Conditions for Confidence Interval of proportions
Unbiased sample
Verify a random sample was taken
Verify that the sample’s ____ (context) is representative of all ___ (context)
Independence (population ≥10n.)
Normality
n𝑝̂ ≥ 10
n(1-𝑝̂) ≥ 10
Interpret the confidence interval
I am C% confident that the true population proportion/mean of (context) falls between ___ and ___.
Interpret the confidence level
If this same process were repeated many times the interval calculated would capture the true proportion/mean about C% of the time.
Population mean confidence interval formulas
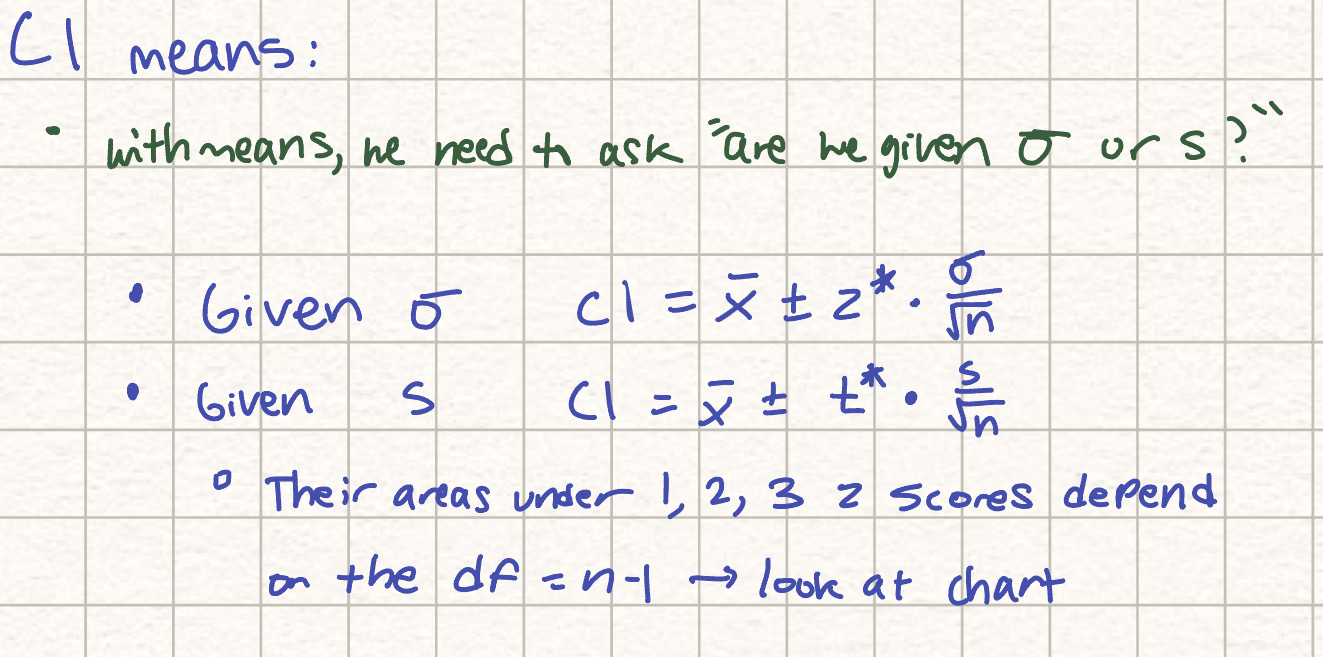
Conditions for confidence intervals (means with known σ)
Unbiased
Independent (population >= 10n)
Normality
stated in problem
central limit theorem (>= 40)
normal probability plot is linear
In every question, make sure to identify the parameter and population
ok
Conditions for Calculating a confidence interval with an unknown population standard deviation
Unbiased
Independence
population >= 10n
Normality
n <= 15; normal probability plot cannot have any outliers/skewness
15 < n < 40; normal probability plot can have a little skewness
n > 40; approximately normal
how to find t*
Look at the intersection of confidence interval % and degrees of freedom (n-1) on the blue sheet.
always round DOWN on the df if it’s not present on the sheet
The estimated weight of chips is 28g. Does the confidence interval (29g, 30g) providence evidence that the mean weight of the bags differ from 28?
Yes. Since 28g falls BELOW the calculated confidence interval, there is evidence the mean differs from 28.
What do you do if you aren’t given a sample proportion to insert into a confidence interval
use 0.5
When to use z* vs t*
Use z* when:
Proportions
Means where you have the population standard deviation
Use t* when:
Means where you AREN’T given the population standard deviation - use Sx
Also for this do degrees of freedom