WATER DEMAND & ESTIMATION(PPT #3)
1/33
There's no tags or description
Looks like no tags are added yet.
Name | Mastery | Learn | Test | Matching | Spaced | Call with Kai |
|---|
No analytics yet
Send a link to your students to track their progress
34 Terms
WHAT ARE FACTORS THAT INFLUENCE WATER DEMAND?
1. Service levels to be implemented
2. Size of the community
3. Standard of living of the populace
4. Quantity and quality of water available in the area
5. Water tariffs that need to be shouldered by the consumers
6. Climatological conditions
7. Habits and manners of water usage by the people
WHAT ARE THE SERVICE LEVEL DEFINITIONS?
Level I – Point Source
Level II – Communal Faucet System or Stand Posts
Level III – Waterworks System or Individual House Connections
-Provides a protected well or developed spring with an outlet-Without distribution system
-Normally serves an average of ____ households within a radius of _____ meters
Level I – Point Source
15
250
-Composed of a source, a reservoir, a piped distribution network, and communal faucets
-One faucet serves____ households within a radius of ___ meters
Level II – Communal Faucet System or Stand Posts
4-6
25
-Includes a source, a reservoir, a piped distribution network, and individual household taps
Level III – Waterworks System or Individual House Connections
For small water utilities, large outlays are not available and cannot be matched by the rural population’s capacity to pay. For these reasons, the design period or horizon in our reference manual is set at _____?
5 or 10 years
WHAT ARE THE 2 DESIGN PERIOD?
Five-year Design Period
Ten-year Design Period
WHAT ARE THE ADVANTAGES AND DISADVATAGES OF 5 YEAR DESIGN PERIOD?
Advantages:
Low initial capital cost
Lower amortization on loans due to the lower investment cost
Disadvantages:
Need for new capital outlays after five (5) years to upgrade system capacity
Facilities are more viable to plan for a one stage 10-year period than to plan in two stages of 5-year period each
WHAT ARE THE ADVANTAGES AND DISADVATAGES OF 10 YEAR DESIGN PERIOD?
Advantages:
The water system facilities are capable of meeting the demand over a longer period.
No major investment cost is expected during the 10-year design period.
Disadvantage:
The higher initial capital cost will require initial tariffs to be set higher.
is the targeted number of people that the project will serve
Design Population
What are the steps in Determining Design Population?
1. Projecting annual municipal and barangay growth rates
2. Projecting municipal and barangay populations
3. Projecting the population served
What are the Determining Growth Rate and Projecting Population Methods?
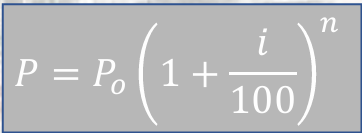
Arithmetic Increase Method
Geometric Increase Method
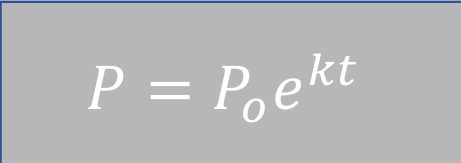
Exponential Increase Method
This method is based upon the assumption that the population increases at a constant rate.
What is its formula?
Arithmetic Increase Method

it is when the instantaneous rate of change of population is constant.
What is its formula?
Geometric Increase Method
This method is based upon the assumption that the instantaneous rate of change of a population with respect to time is proportional to the population itself.
What is its formula?
Exponential Increase Method
Projecting the Population Served
1. Preparation of Base Maps
2. Ocular inspection
3. Delineation of the proposed service area
4. Determination and assessment of the level of acceptance by the residents of the planned water system
5. Assessment of the availability and abundance/scarcity of alternative water sources
______ ______ for domestic water demand is expressed in per capita consumption per day (usually liters per capita per day or lpcd
Unit Consumption
Recommended unit consumption assumptions:
Level II Public Faucets: 50-60 lpcd (each faucet serves 4-6 households)
Level III House Connections: 80-100 lpcd
Institutional Connections: 1.0 m3/day
Commercial Connections: 0.8 m3 /day
is the sum of the domestic, institutional and commercial consumptions expressed in m3/d
Total Consumption
2 Types of Total Consumption
Domestic Consumption
Institutional and Commercial Consumption
The year-by-year total domestic consumption is projected by applying the projected unit consumption to the projected population to be served for each year
Domestic Consumption
In anticipation of the trend towards upgrading to Level III in the future, the Level II system planner should assume that within 5 years, ___% of the households served would opt for individual house connections
90
is the amount of water that is produced but not billed as a result of leaks, pilferages, free water, utility usages, etc.
This should be considered in the estimation of the capacity of the water supply system.
An assumption of ____% NRW can be used for a new system. This can be increased up to a total of ____% at the end of 10 years
Non-revenue water
15
20
is a summation of all the consumptions given in the preceding sections and will determine the capacity needed from the source/s
Water Demand
The average daily water demand, also known as the ___________, is calculated (in m3/day or lps) from the estimated water consumptions and the allowance for the NRW (expressed as a percentage).
Average Day Demand (ADD)
What is the demand factor of the following?
1. Average Day Demand(ADD)
2. Minimum Day Demand
3. Maximum Day Demand
4. Peak Hour Demand
1.0
0.3ADD
1.3 ADD
2.5ADD (>1000 Connections)
3.0ADD (<1000 Connections)
The average of the daily water requirement spread in a yea
Average Day Demand
To serve as basis for the annual estimates and projections on production, revenues, non revenue water, power costs, and other O&M costs
Average Day Demand
The minimum amount of water required in a single day over a year
Minimum Day Demand
To check on possible occurrence of excessive static pressures that the system might not be able to withstand. (No point in the transmission and distribution system should be subjected to pressure more than 70 m.
Minimum Day Demand
The maximum amount of water required in a single day over a year
Maximum Day Demand
The total capacity of all existing and future water sources should be capable of supplying at least this demand at any year during the design period
Maximum Day Demand
The highest hourly demand in a day
Peak Hour Demand
The pipeline network should be designed to operate with at least 3 meters during peak hour conditions. If there is no reservoir, the power ratings of pumping stations should be sufficient for the operation of the facilities during peak hour demands
Peak Hour Demand