Managerial Economics: Theory of Production and Surplus
1/90
There's no tags or description
Looks like no tags are added yet.
Name | Mastery | Learn | Test | Matching | Spaced |
|---|
No study sessions yet.
91 Terms
Production Function
Relationship between inputs and outputs over time.
Total Product (TP)
Total output of goods or services produced.
Marginal Product (MP)
Additional output from one more unit of input.
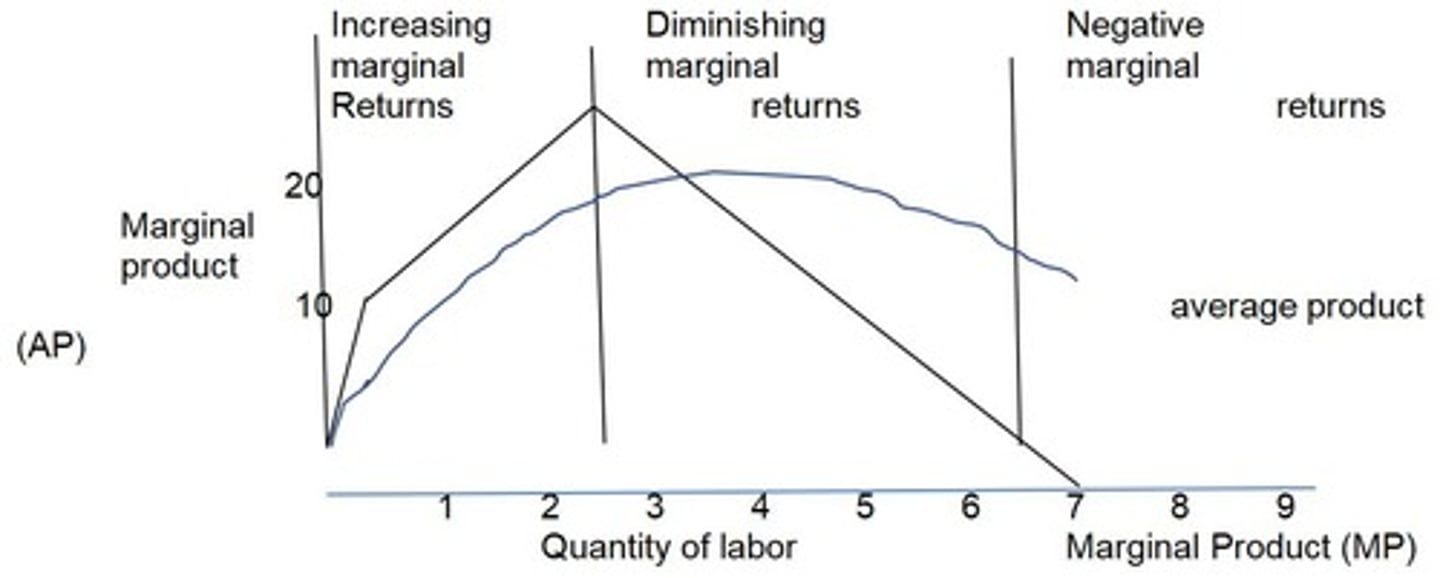
Average Product (AP)
Output per unit of labor employed.
Law of Diminishing Returns
Decreasing additional output with increased input.
Stage of Increasing Returns
Output increases more than proportional to input.
Stage of Decreasing Returns
Additional input yields less additional output.
Stage of Negative Returns
Total product declines after peak output.
Isoquant
Graph showing input combinations for same output.
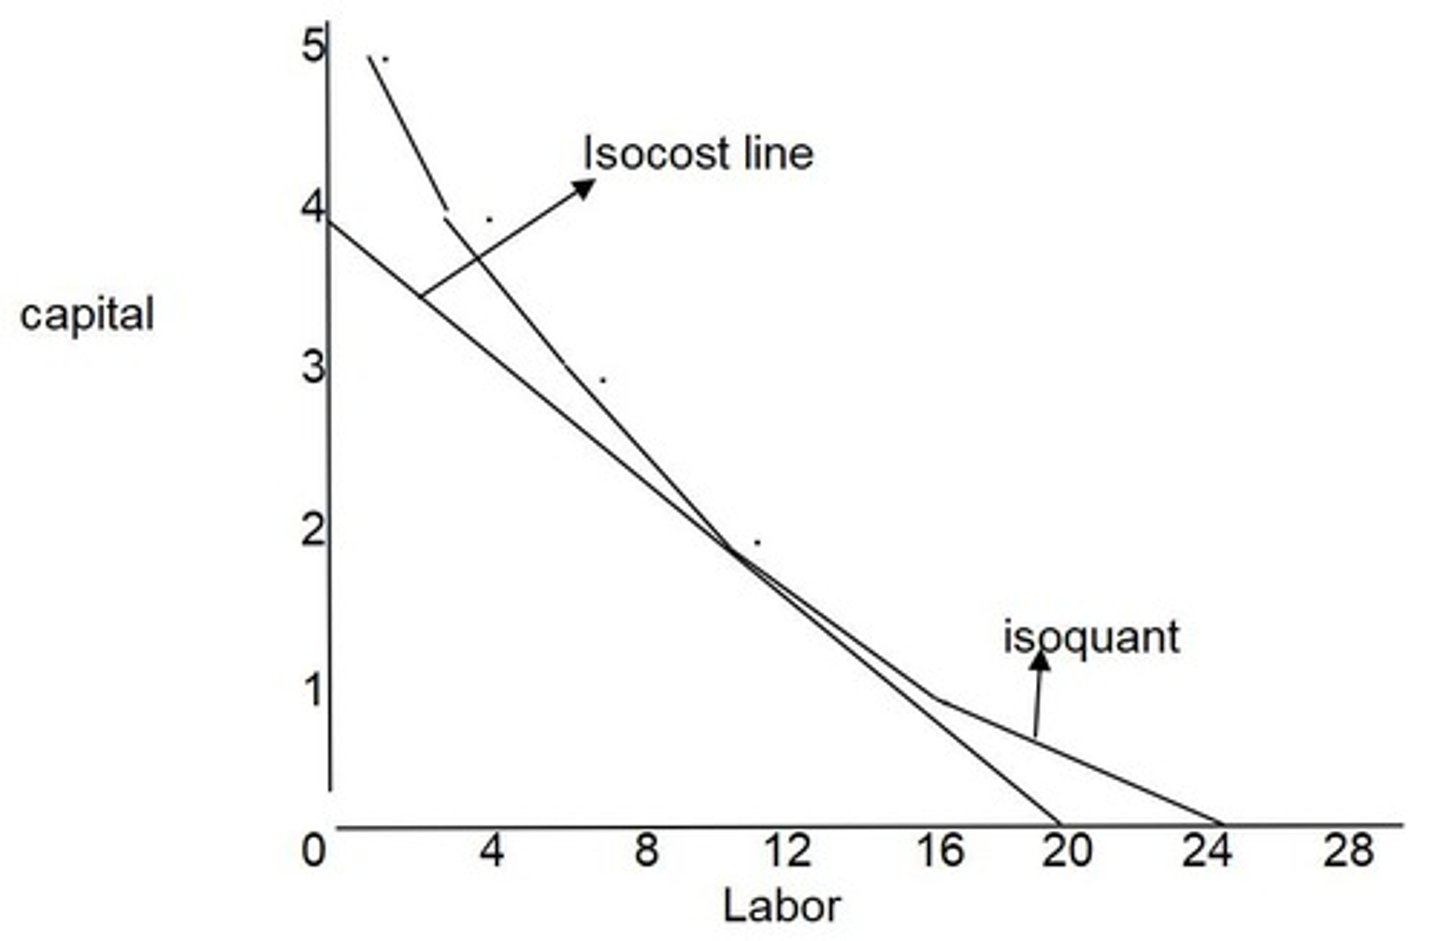
Isocost Line
Graph of input combinations for a given cost.
Breakeven Quantity
Quantity with zero profit or loss.
Input Substitution
Replacing one input with another in production.
Convex Isoquant
Increasing second factor needed for first factor decrease.
Labor Cost
Expense incurred for employing labor in production.
Capital Cost
Expense incurred for using capital in production.
Production Process
Method of transforming inputs into outputs.
Variable Input
Input that can change in quantity during production.
Fixed Input
Input that remains constant regardless of output.
Graphical Representation
Visual depiction of economic relationships and data.
Optimal Combination of Inputs
Best mix of inputs for desired output level.
Cost Minimization
Achieving desired output at the lowest cost.
Production Stages
Different phases of output response to input changes.
Input Costs
Expenses associated with acquiring production resources.
Isoquant
Graphical representation of input combinations yielding output.
Indifference Curve
Shows consumer preferences between two goods.
Buyer-Seller Relationship
Interaction where buyer values product and seller values cost.
Investment Decision
Evaluating current costs against future gains.
Discounting
Calculating present value of future cash flows.
Present Value Formula
PV = FV/(1+i) for cash flow valuation.
Future Value Formula
FV = PV x (1+i) for future cash estimation.
Interest Rate (i)
Percentage used in discounting and compounding calculations.
Transaction Surplus
Gains from exchange between buyer and seller.
Buyer Surplus
Difference between buyer's value and agreed price.
Seller Surplus
Difference between agreed price and seller's value.
Total Surplus
Sum of buyer surplus and seller surplus.
Law of Demand
Higher prices lead to lower quantity demanded.
Demand Curve
Graph showing quantity demanded at various prices.
Demand Schedule
Table correlating price and quantity demanded.
Breakeven Analysis
Determining profitability through breakeven quantity.
Breakeven Quantity Formula
Q = F/(P-MC) for cost analysis.
Diminishing Marginal Utility
Satisfaction decreases with each additional unit consumed.
Compounding
Calculating future value based on present investments.
Rule of 72
Estimate years to double money at given interest.
Net Present Value (NPV)
Investment profitability measure comparing future cash flow.
Wealth Creation
Result of voluntary transactions between parties.
Trade-off
Balancing current costs against future benefits.
Marginal Analysis
Evaluating benefits and costs of additional output.
Marginal Revenue (MR)
Additional income from selling one more unit.
Marginal Cost (MC)
Cost of producing one additional unit.
Consumer Surplus
Difference between total value and expenses.
Optimum Price
Price maximizing profit for producers.
Price Elasticity of Demand
Responsiveness of quantity demanded to price changes.
Elasticity Coefficient
Ratio of percentage change in quantity to price.
Total Value
Sum of all marginal values for units consumed.
Marginal Utility
Additional satisfaction from consuming one more unit.
Consumer Behavior
Decision-making process based on marginal value.
Profit Calculation
Profit equals revenue minus total costs.
Revenue
Total income generated from sales.
Price Reduction Impact
Lower prices increase units sold but reduce revenue.
Sliced Kutsinta Example
Illustrates consumer choices based on marginal values.
Zero Surplus
Total value equals expenses; no consumer benefit.
Price Increase Effect
Higher prices decrease units sold but increase profit.
Demand Curve
Graph showing relationship between price and quantity demanded.
Utility Maximization
Consumers aim to maximize satisfaction per dollar spent.
Profit Maximization
Producers aim to maximize profit through pricing.
Quantity Demanded
Number of units consumers are willing to buy.
Consumer Decision-Making
Based on comparing marginal value and price.
Price Change Analysis
Evaluating effects of price changes on demand.
Marginal Cost
Additional cost of producing one more unit.
Marginal Revenue
Additional revenue from selling one more unit.
Profit Maximization
Occurs when MR equals MC.
Price Elasticity of Demand
Sensitivity of demand to price changes.
Elastic Demand
Coefficient greater than 1; demand highly responsive.
Inelastic Demand
Coefficient less than 1; demand less responsive.
Unitary Demand
Coefficient equals 1; proportional response to price.
Cross Elasticity of Demand
Sensitivity of demand for one product to another's price.
Complementary Goods
Negative cross elasticity indicates goods are complementary.
Substitutes
Positive cross elasticity indicates goods are substitutes.
Income Elasticity of Demand
Responsiveness of demand to changes in income.
Normal Goods
Positive income elasticity; demand increases with income.
Inferior Goods
Negative income elasticity; demand decreases with income.
Price Elasticity of Supply
Sensitivity of supply to price changes.
Elastic Supply
Coefficient greater than 1; supply highly responsive.
Inelastic Supply
Coefficient less than 1; supply less responsive.
Unitary Supply
Coefficient equals 1; proportional response to price.
Market Period
Immediate time after price change; no supply adjustment.
Short Run Supply
Time too short to change plant capacity.
Long Run Supply
Time sufficient for firms to adjust capacity.
Price Elasticity of Supply Coefficient
es = % change in quantity supplied / % change in price.
Cross Elasticity Formula
Exy = (Qx1 - Qx2) / (Qx1 + Qx2) / (Py1 - Py2) / (Py1 + Py2).
Ed Formula
ed = (change in quantity demanded) / (original quantity + new quantity) / 2.