Aggregate Supply & Demand
1/34
Earn XP
Description and Tags
Name | Mastery | Learn | Test | Matching | Spaced | Call with Kai |
|---|
No analytics yet
Send a link to your students to track their progress
35 Terms
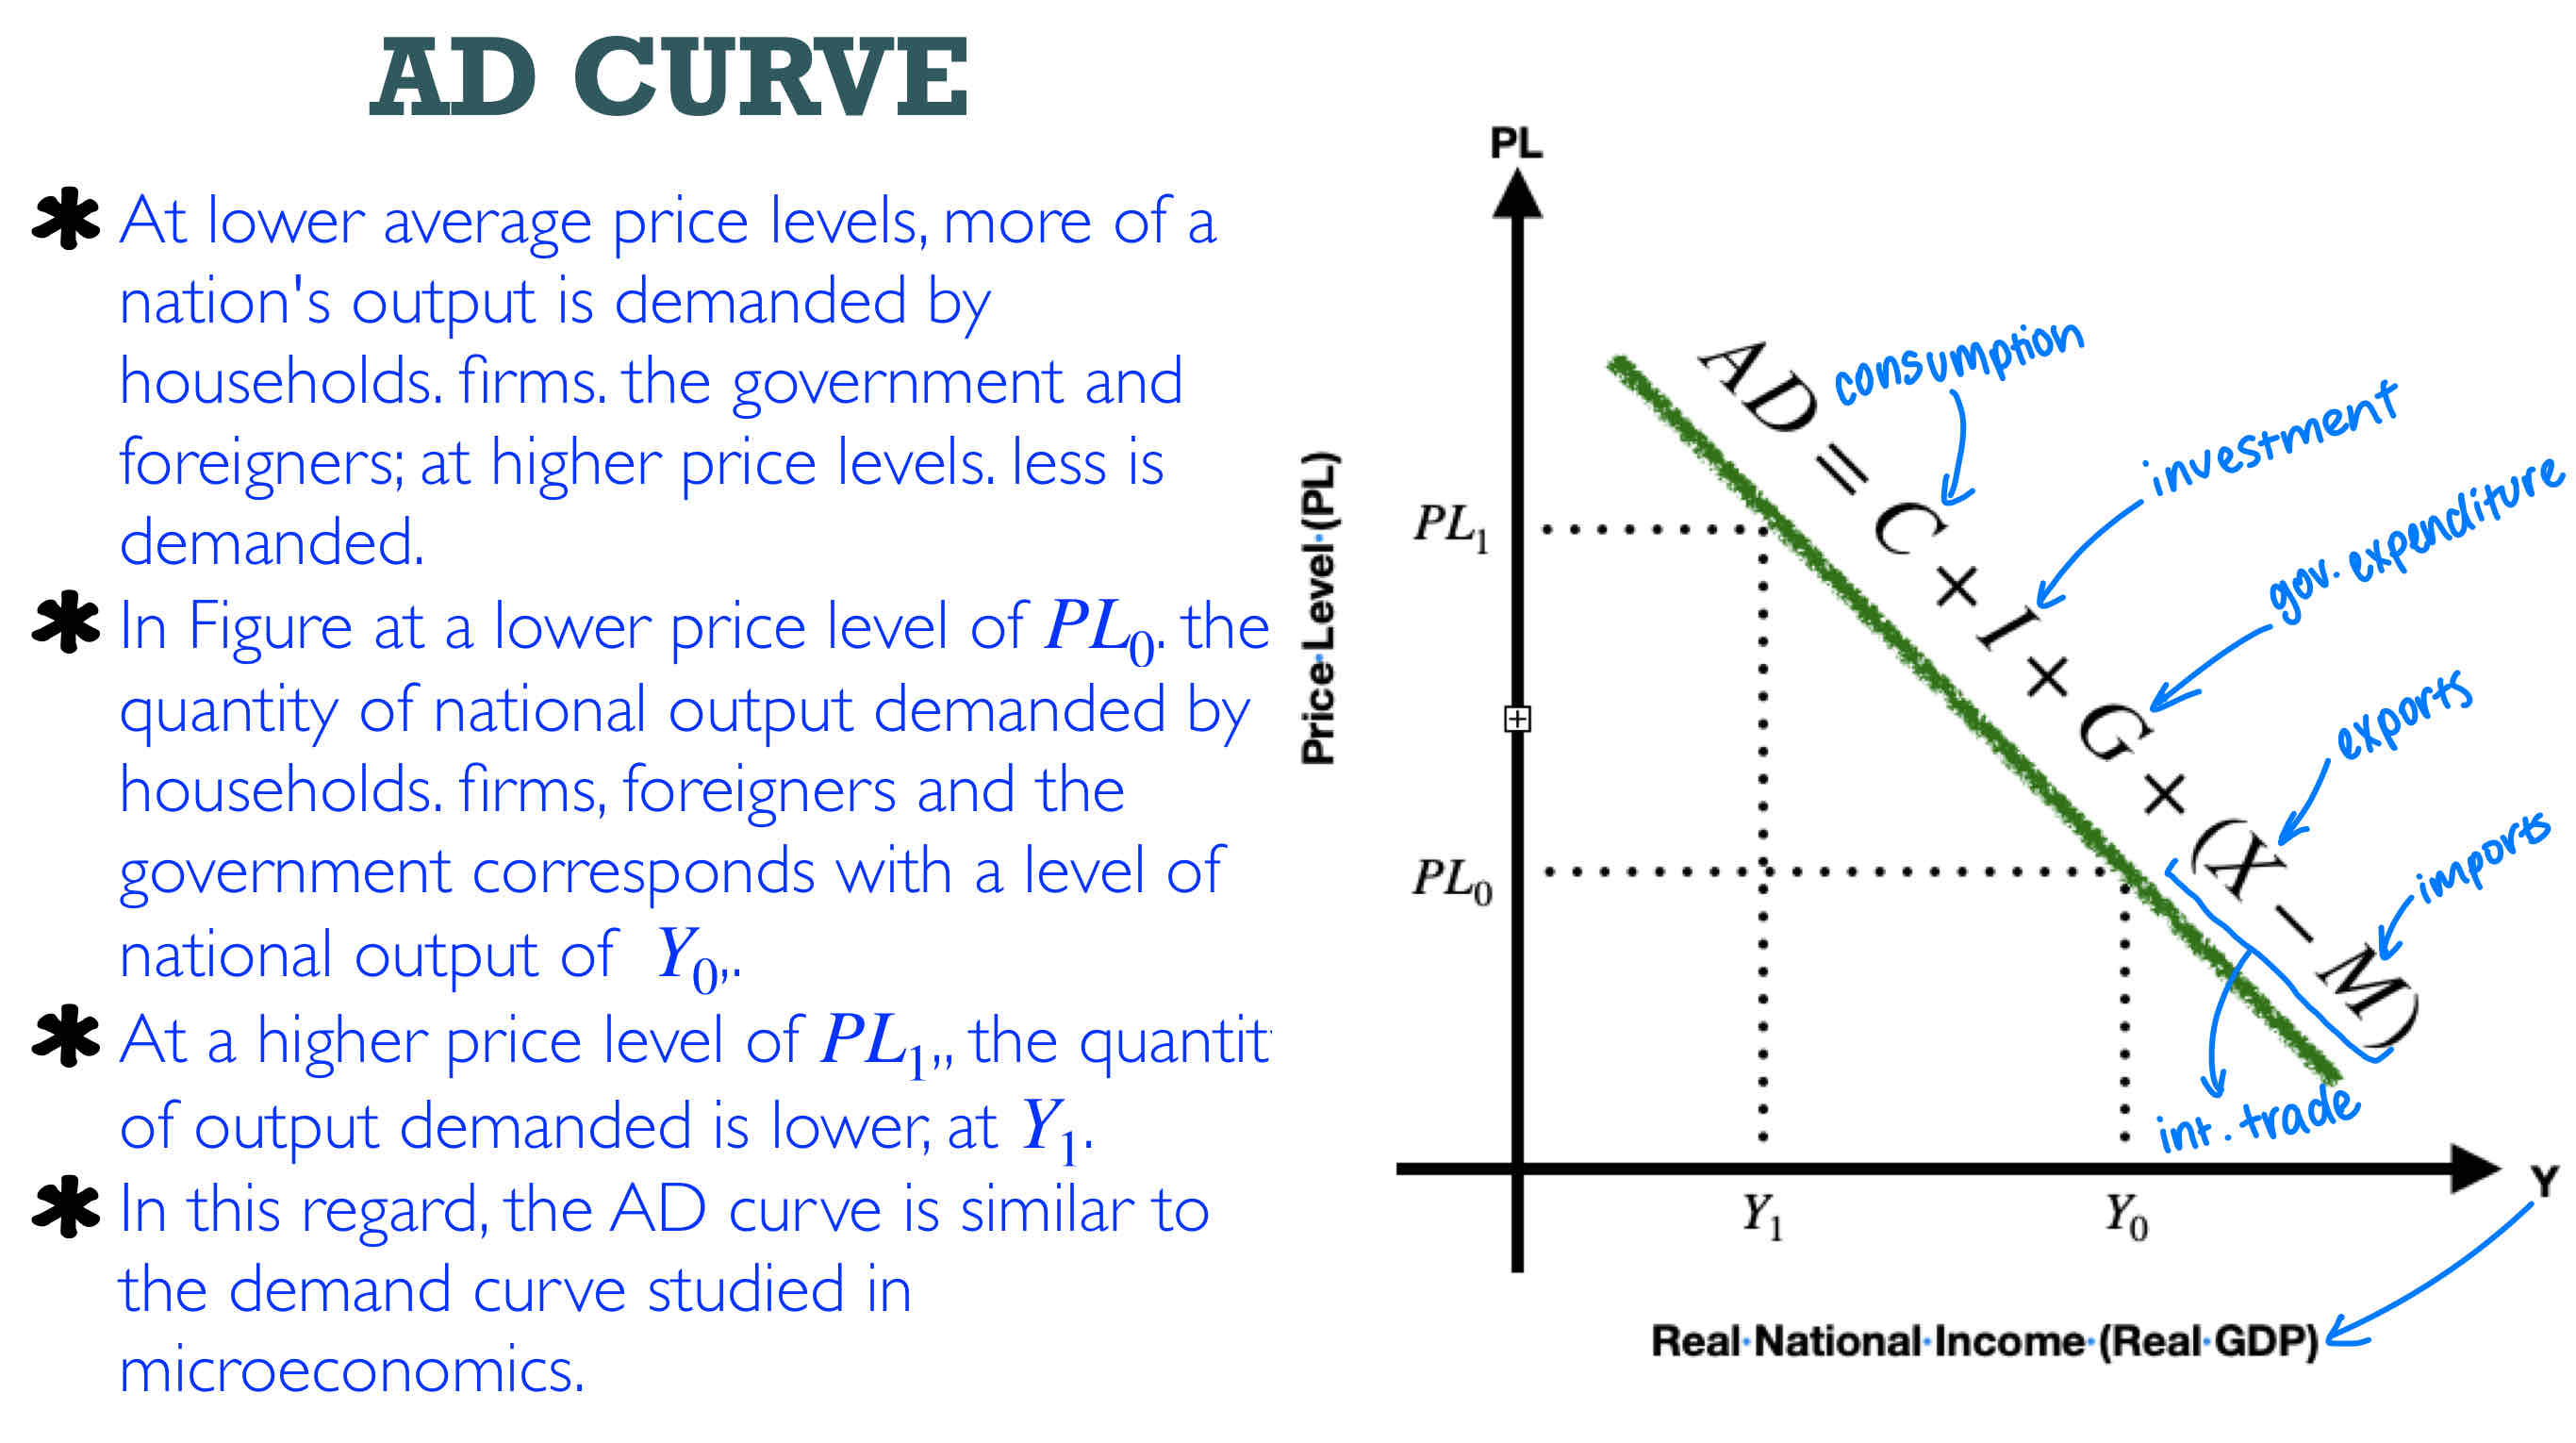
Define aggregate demand
“Aggregate demand is the total amount of real output (real GDP) that consumers, firms, the government and foreigners want to buy at each possible price level, over a particular time period.
The aggregate demand (AD) curve shows the relationship between the total amount of real output demanded by the four components and the economy’s price level over a particular time period.”
Explain the AD curve
Explain the wealth effect
Changes in the price level affect the real value of people’s wealth.
If the price level increases, the real value of wealth falls. People feel worse off and cut back on their spending on goods and services.
As the price level increases, less output is demanded, leading to an upward movement along the AD curve.
If there is a fall in the price level, the real value of wealth increases, people feel better off and increase their spending, thus more output is demanded, causing a downward movement along the AD curve.
Explain the interest rate effect
Changes in the price level affect rates of interest, which in turn affect aggregate demand.
An increase in the demand for money, which in turn leads to an increase in rates of interest.
A fall in the price level leads to a rise in quantity of output demanded, or a downward movement along the AD curve.
Explain the international trade effect
If the domestic price level increases while price levels in other countries remain the same, exports become more expensive to foreign buyers who will now demand a smaller quantity of these.
At the same time, goods produced in other countries become relatively cheaper, so domestic buyers increase their purchases (imports) from foreign countries.
Therefore, a rising price level produces a fall in exports and a rise in imports so that net exports, X − M, fall.
Falling net exports represent a fall in quantity of output demanded or an upward movement along the AD curve.
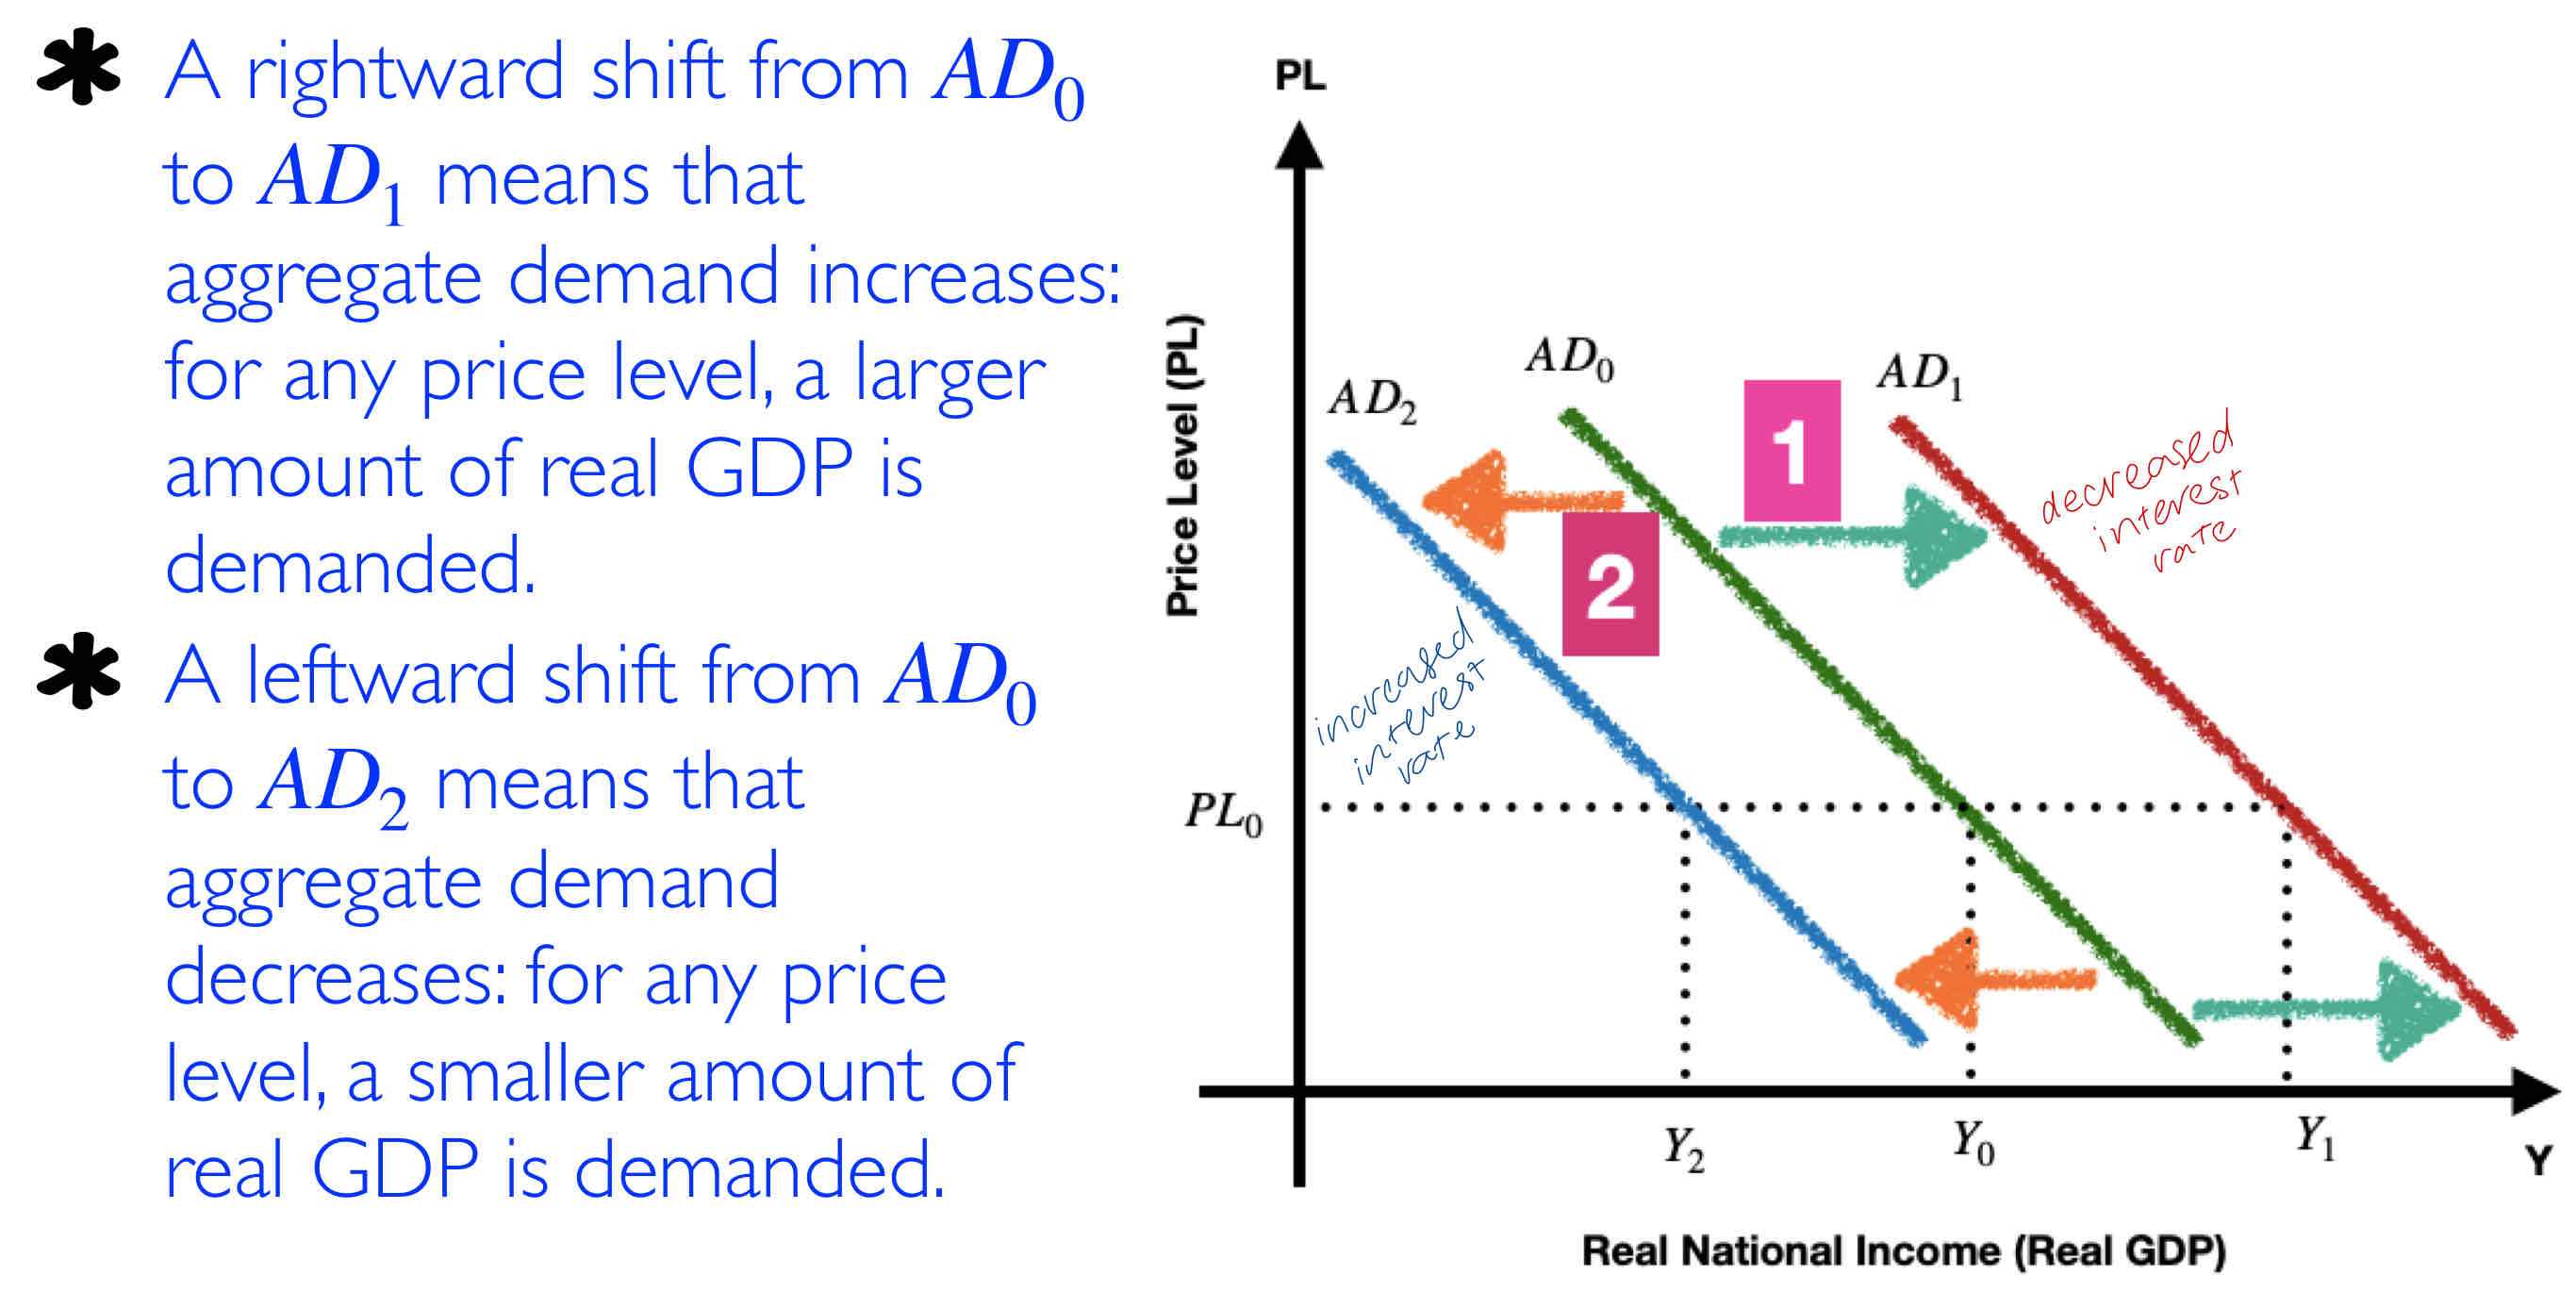
Describe the shifts of AD
Explain changes in consumer confidence as it relates to consumption
Consumer confidence is a measure of how optimistic consumers are about their future income and the future of the economy.
If consumers expect their incomes to increase, or if they are optimistic about the future of the economy, they are likely to spend more on buying goods and services, and the AD curve shifts to the right.
Low consumer confidence indicates expectations of falling incomes and worsening economic conditions, due to fears of cuts in wages or unemployment, causing decreases in spending, appearing as a leftward shift of the AD curve.
Governments around the world regularly measure consumer confidence (through surveys based on questionnaires of consumers) to try to predict the level of consumer spending..
Explain changes in consumption based on personal income tax
If the government increases personal income taxes, then consumer disposable income, which is the income left over after personal income taxes have been paid, falls; therefore, spending drops, and the AD curve shifts to the left.
If personal income taxes are lowered, the result is higher disposable income and a rightward shift in the AD curve.
Changes in taxes are the result of a type of government policy called 'fiscal policy'.
How does business confidence effect investment
Business confidence affects future sales and economic activity.
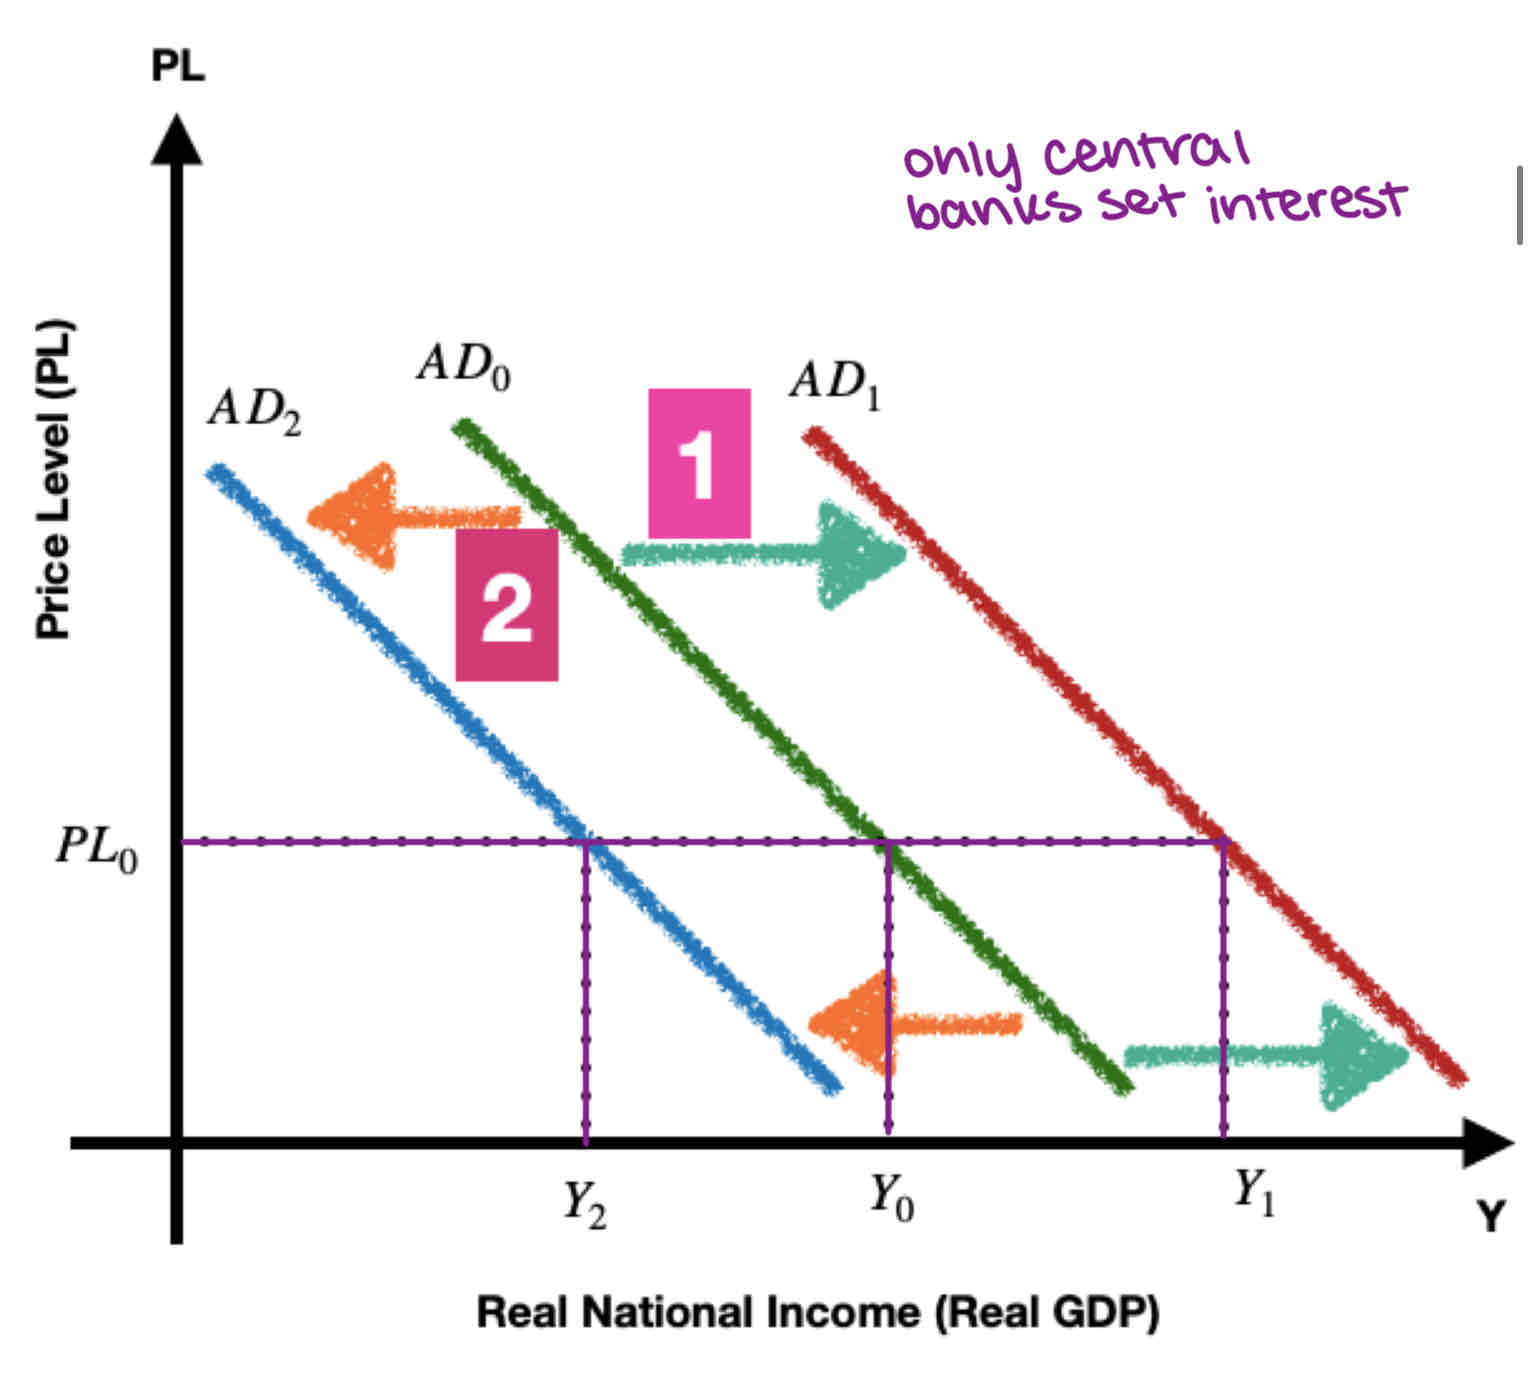
Optimistic firms spend more on investment, resulting in a rightward shift of the AD curve.
Pessimistic firms spend less, resulting in a leftward shift of the AD curve.
How do interest rates effect investment?
Changes in interest rates affect borrowing costs and investment spending.
Increases in interest rates raise borrowing costs and reduce investment spending, shifting the AD curve to the left.
Decreases in interest rates lower borrowing costs and increase investment spending, shifting the AD curve to the right.
Interest rates are influenced by monetary policy.
How do improvements in tech change investment? (Internet of things)
Technological improvements stimulate investment spending.
Investment spending leads to an increase in aggregate demand.
Improvements in technology cause a rightward shift in the AD curve.

Changes in business taxes as a factor for investment
Government taxes on business profits are part of fiscal policy.
Increased taxes on profits reduce after-tax profits and decrease investment spending, shifting the AD curve to the left.
Decreased taxes on profits increase after-tax profits and increase investment spending, shifting the AD curve to the right.
Tax policy can be used as a tool to influence aggregate demand in the economy.
How does institutional change impact investment
Legal and institutional changes can impact investment spending. In developing and transition economies, laws and institutions may not favour small businesses, limiting their access to credit. Without secure property rights, investment may be discouraged. Improving access to credit and securing property rights can increase investment spending and shift the AD curve to the right.
Legal and institutional changes are important in creating a favourable business environment for investment.
The impact of government expenditure on AD
Governments have various expenditures, including: providing merit and public goods, spending on subsidies and pensions, paying wages and salaries to employees. Changes in political priorities may lead to increases or decreases in government spending. An increase in government spending results in a rightward shift of the AD curve. A decrease in government spending leads to a leftward shift of the AD curve.
Define exchange rate
“Exchange rate is the price of one country's currency in terms of another country's currency.”
How does trade impact exchange rates?
An increase in the price of country A's currency makes it more expensive relative to country B's currency.
Country B now finds country A's output more expensive and imports less from country A. Therefore, country A's exports fall and its AD curve shifts to the left. Country A finds country B's output cheaper and increases its imports from country B.
The increase in the price of country A's currency has two effects: a fall in its exports and an increase in imports.
Net exports (X-M) fall, and the AD curve shifts to the left. If the price of country A's currency decreases, exports increase and imports decrease. Net exports (X-M) increase, and the AD curve shifts to the right.
What is trade protection?
"Trade protection' refers to restrictions to free international trade often imposed by governments.
define aggregate supply and explain the curve
Aggregate supply is the total quantity of goods and services produced in an economy (real GDP) over a particular time period at different price levels.
The short-run aggregate supply curve (SRAS) shows the relationship between the price level and the quantity of real output (real GDP) produced by firms when resource prices (especially wages) do not change.
Define price level
“Price level is the index of current prices across the entire spectrum of goods and services produced in an economy using a basket of goods.
In economics, price levels are a key indicator and are closely watched by economists.
They play an important role in the purchasing power of consumers as well as the sale of goods and services. It also plays an important part in the supply-demand chain.”
changes in price level is inflation/deflation
Define short run and long run
The short run in macroeconomics is the period of time when prices of resources, especially to wages, are roughly constant or inflexible (they do not change much in response to supply and demand).
The long run in macroeconomics is the period of time when the prices of all resources, including wages, are flexible and change along with changes in the price level.
Describe the relationship between wages and aggregate supply
Wages are of special interest because they account for the largest part of firms' costs of production, and therefore strongly affect the quantity of output supplied by firms.
Wages do not change very much over relatively short periods of time. The price of labour (wages) is often rigid (unchanging), because:
labour contracts fix wage rates for certain periods of time, perhaps a year or two or more
minimum wage legislation fixes the lowest legally permissible wage
workers and labour unions resist wage cuts
wage cuts have negative effects on worker morale, causing firms to avoid them.
The distinction between the short run and the long run in macroeconomics does not affect aggregate demand, but is very important for aggregate supply.
Explain changes in SRAS
A rightward shift from SRAS, to SRAS, means that short-run aggregate supply increases: for any particular price level, firms produce a larger quantity of real GDP.
A leftward shift from SRAS, to SRAS, means that aggregate supply decreases: for any particular price level, firms produce a smaller quantity of real GDP.
Wages shifting SRAS
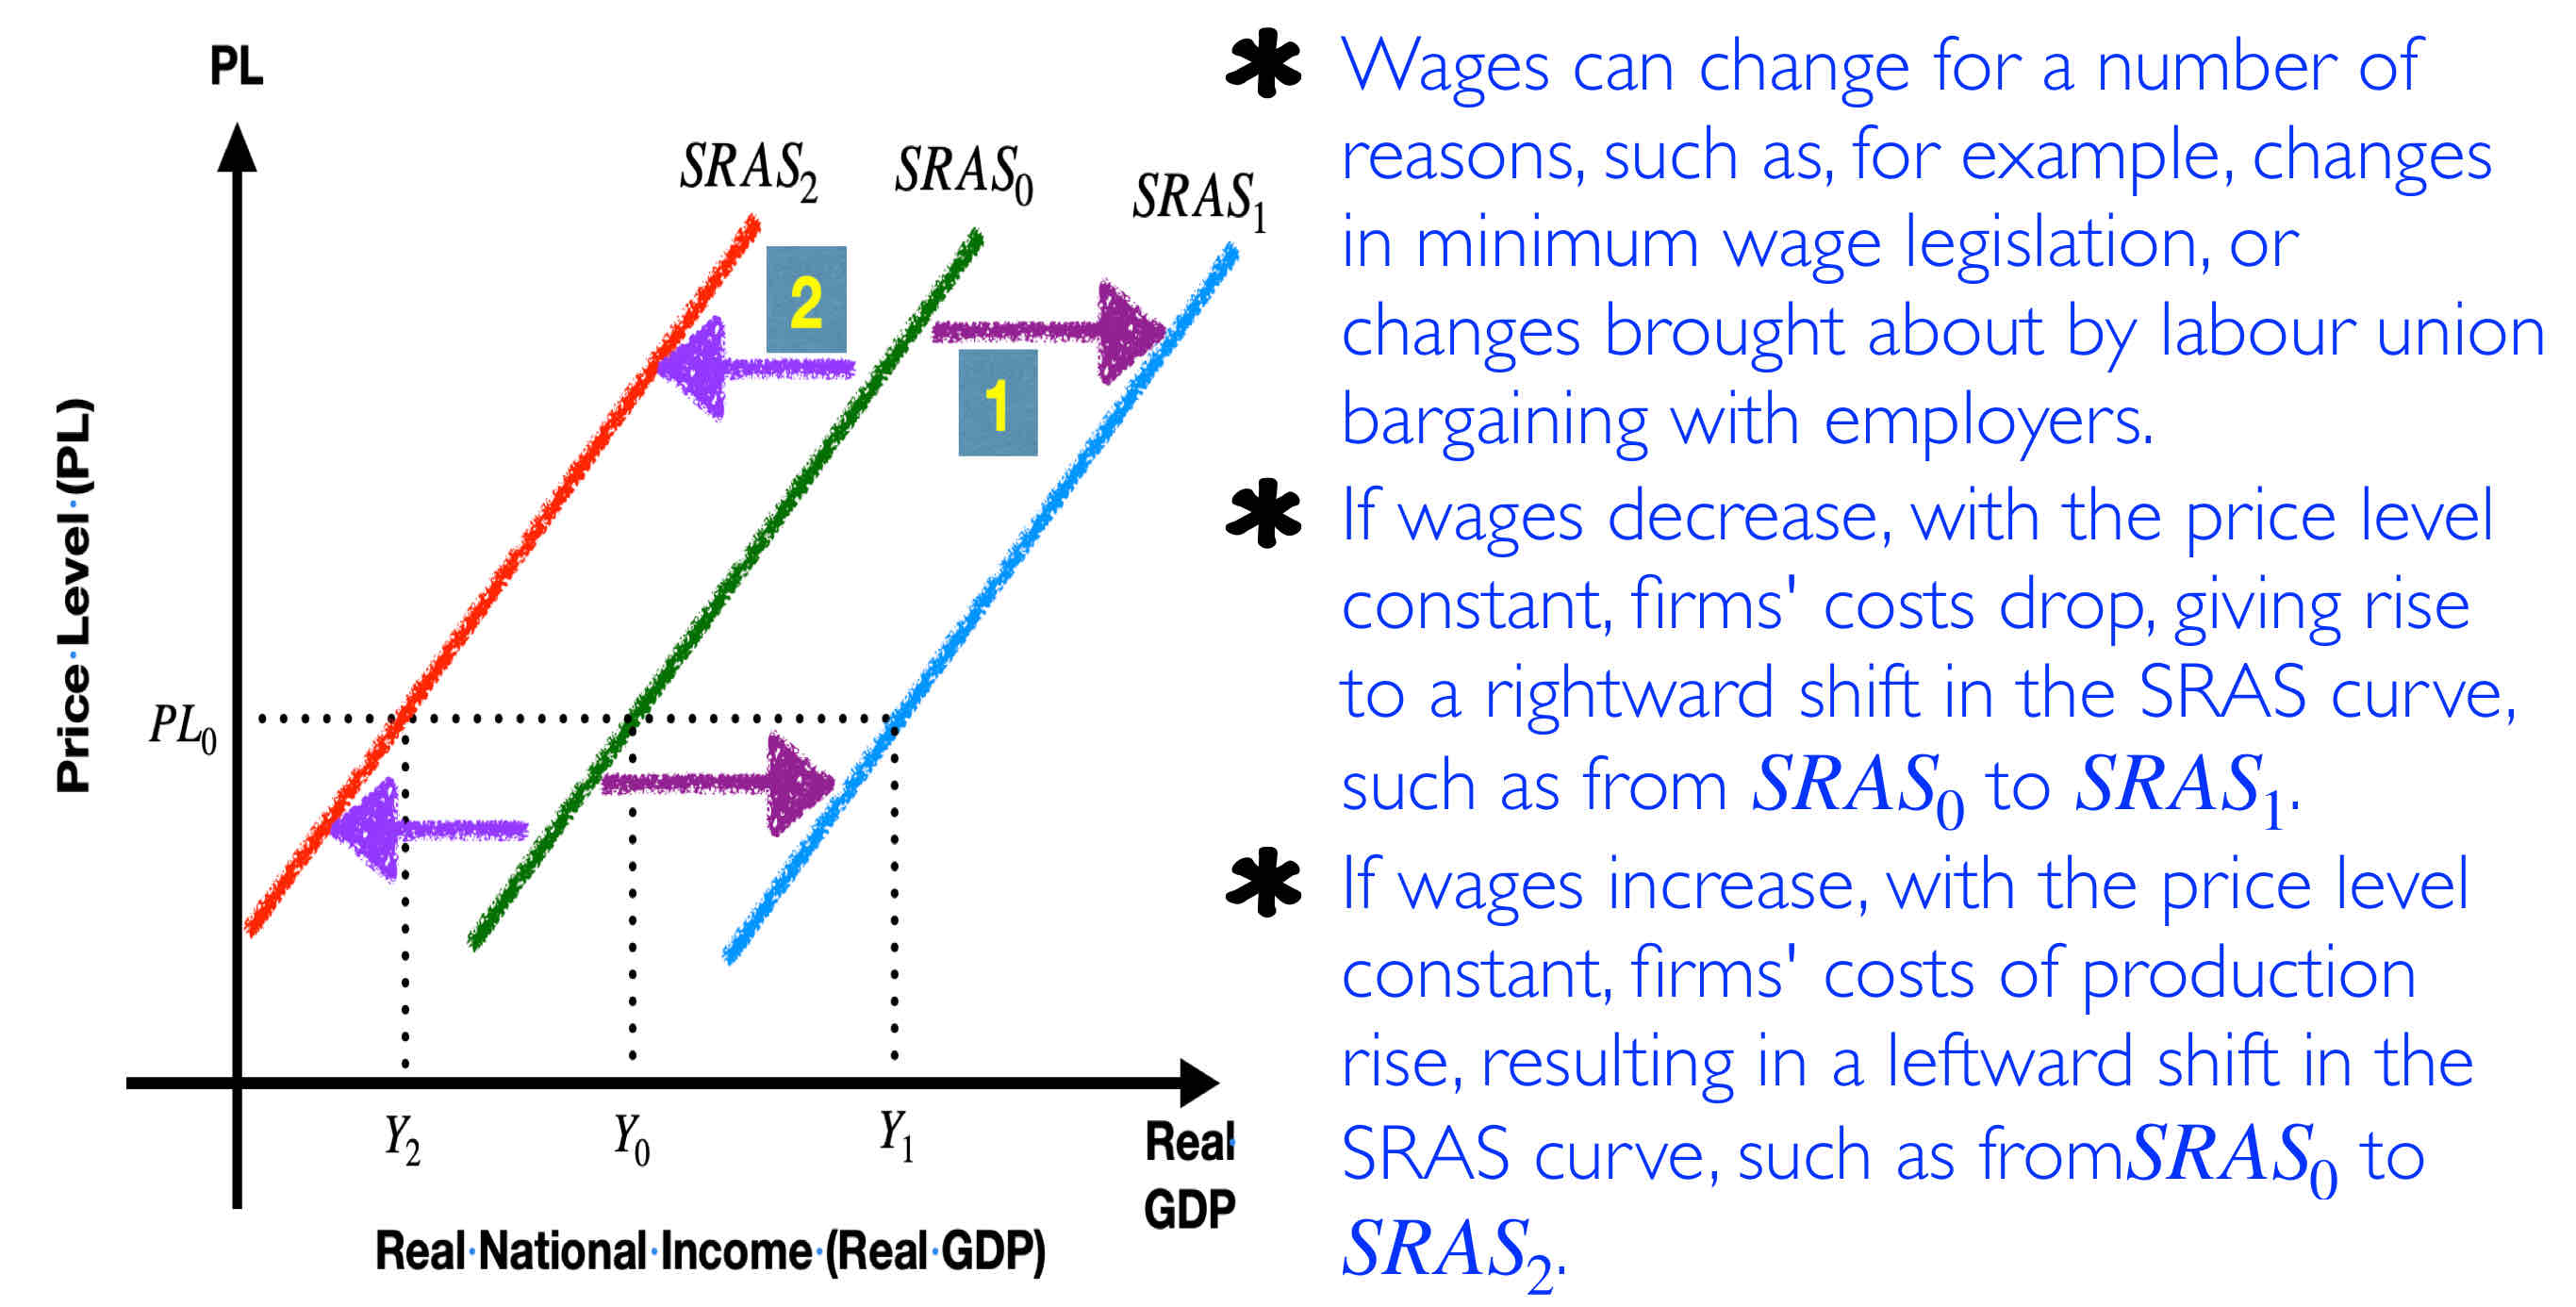
SRAS - changes in resource prices
Changes in the price of non-labour resources, such as:
the price of oil, equipment
capital goods
land inputs, and so on
affect the SRAS curve in the same way as changes in wages.
An increase in the price of a resource shifts the SRAS curve to the left; a decrease shifts it to the right.
Subsidies affect on SRAS
Case study: china and EU trade subsidies
Subsidies have the opposite effect to taxes, as they involve money transferred from the government to firms.
If they increase, the SRAS curve shifts to the right; if they decrease, the SRAS curve shifts to the left.
Define supply shocks
A supply shock is an unexpected event that suddenly changes the supply of a product or commodity, resulting in an unforeseen change in price. Supply shocks can be negative, resulting in a decreased supply, or positive, yielding an increased supply.
Assuming aggregate demand is unchanged, a negative (or adverse) supply shock causes a product's price to spike upward, while a positive supply shock decreases the price.
Case study: west Africa + war = no cocoa beans
Define full employment
In the AS/AD model, refers the nation's full employment level of output, which is the level of output of goods and services achieved when a nation is producing at or near its potential by employing all available land, labour and capital.
A nation achieving is producing either on or near its production possibilities curve, enjoys a low rate of unemployment and a stable price level and is an economy that can be considered strong and healthy.
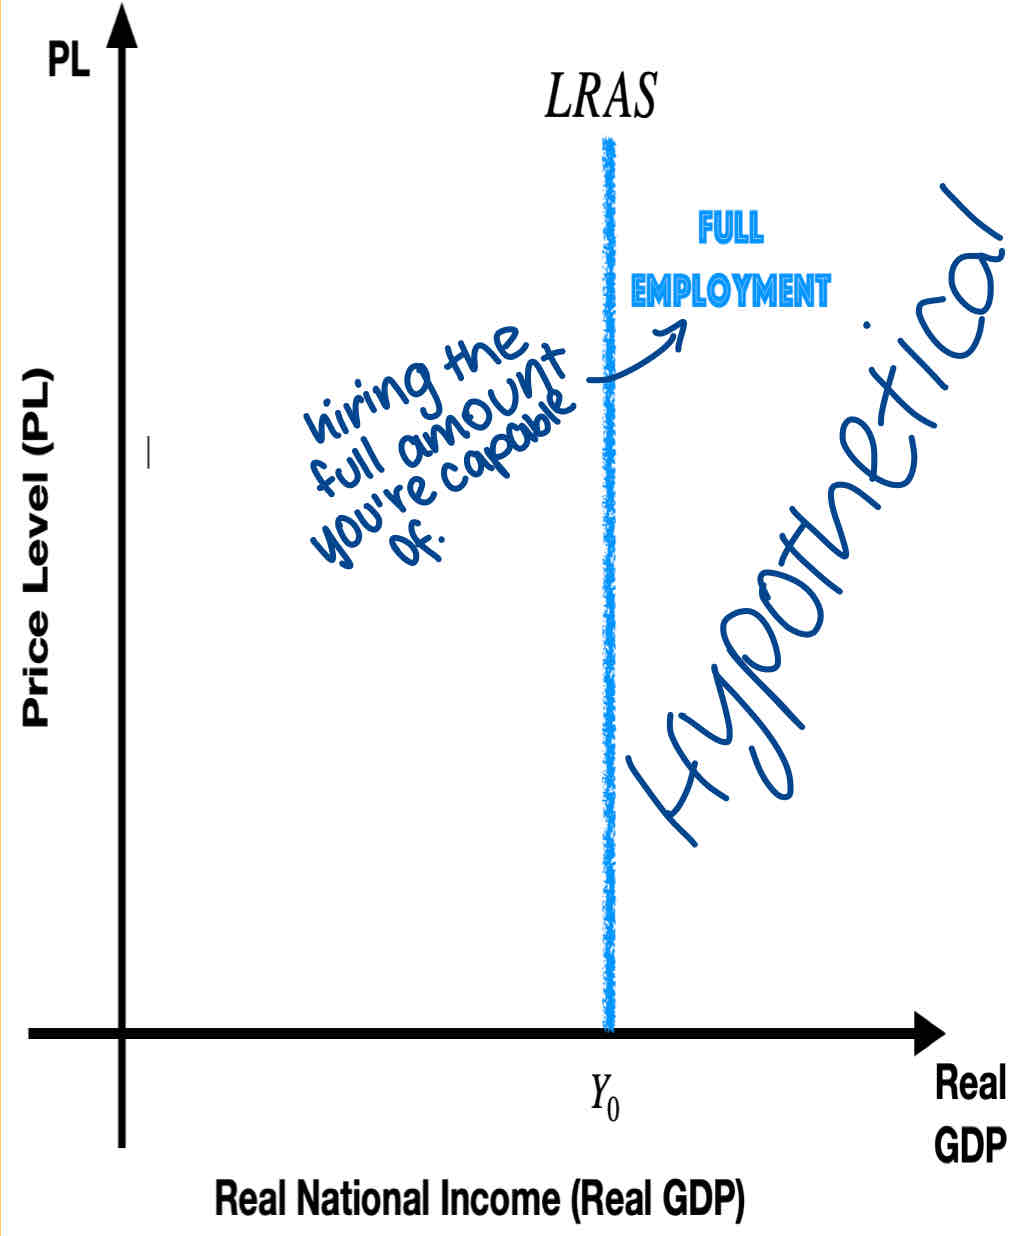
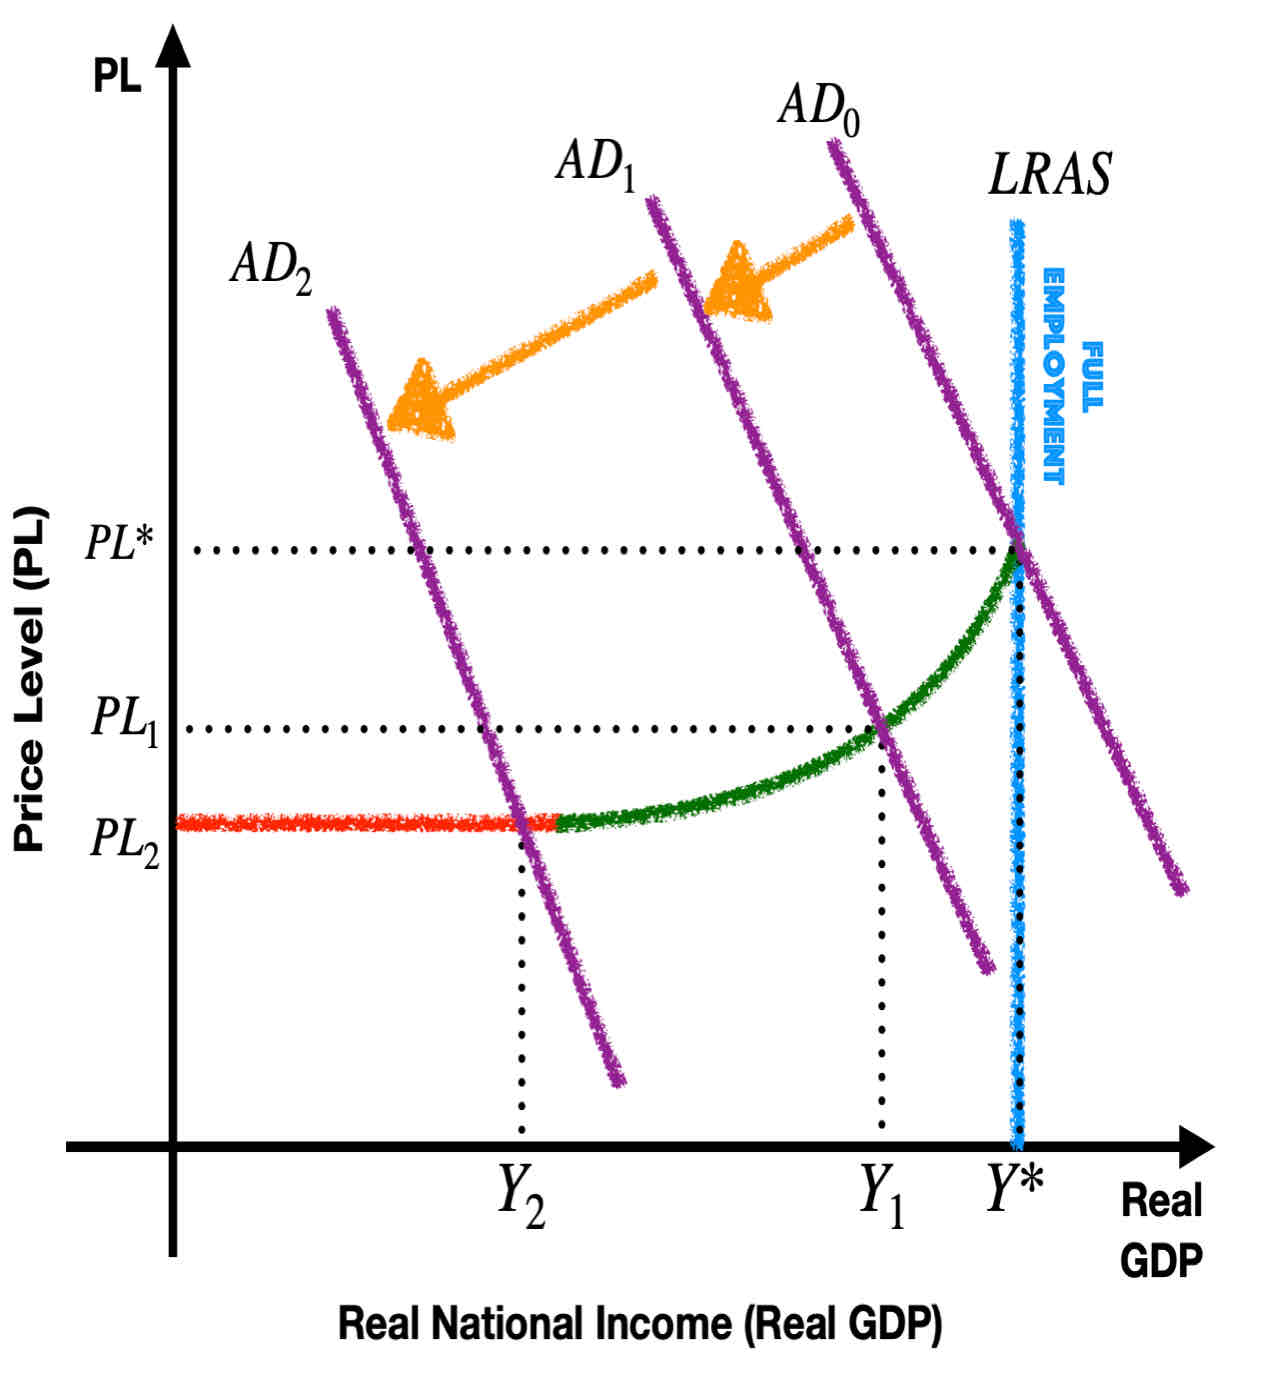
The LRAS Keynesian model curve
AS is relatively elastic when the nation is producing at a relatively low level of output.
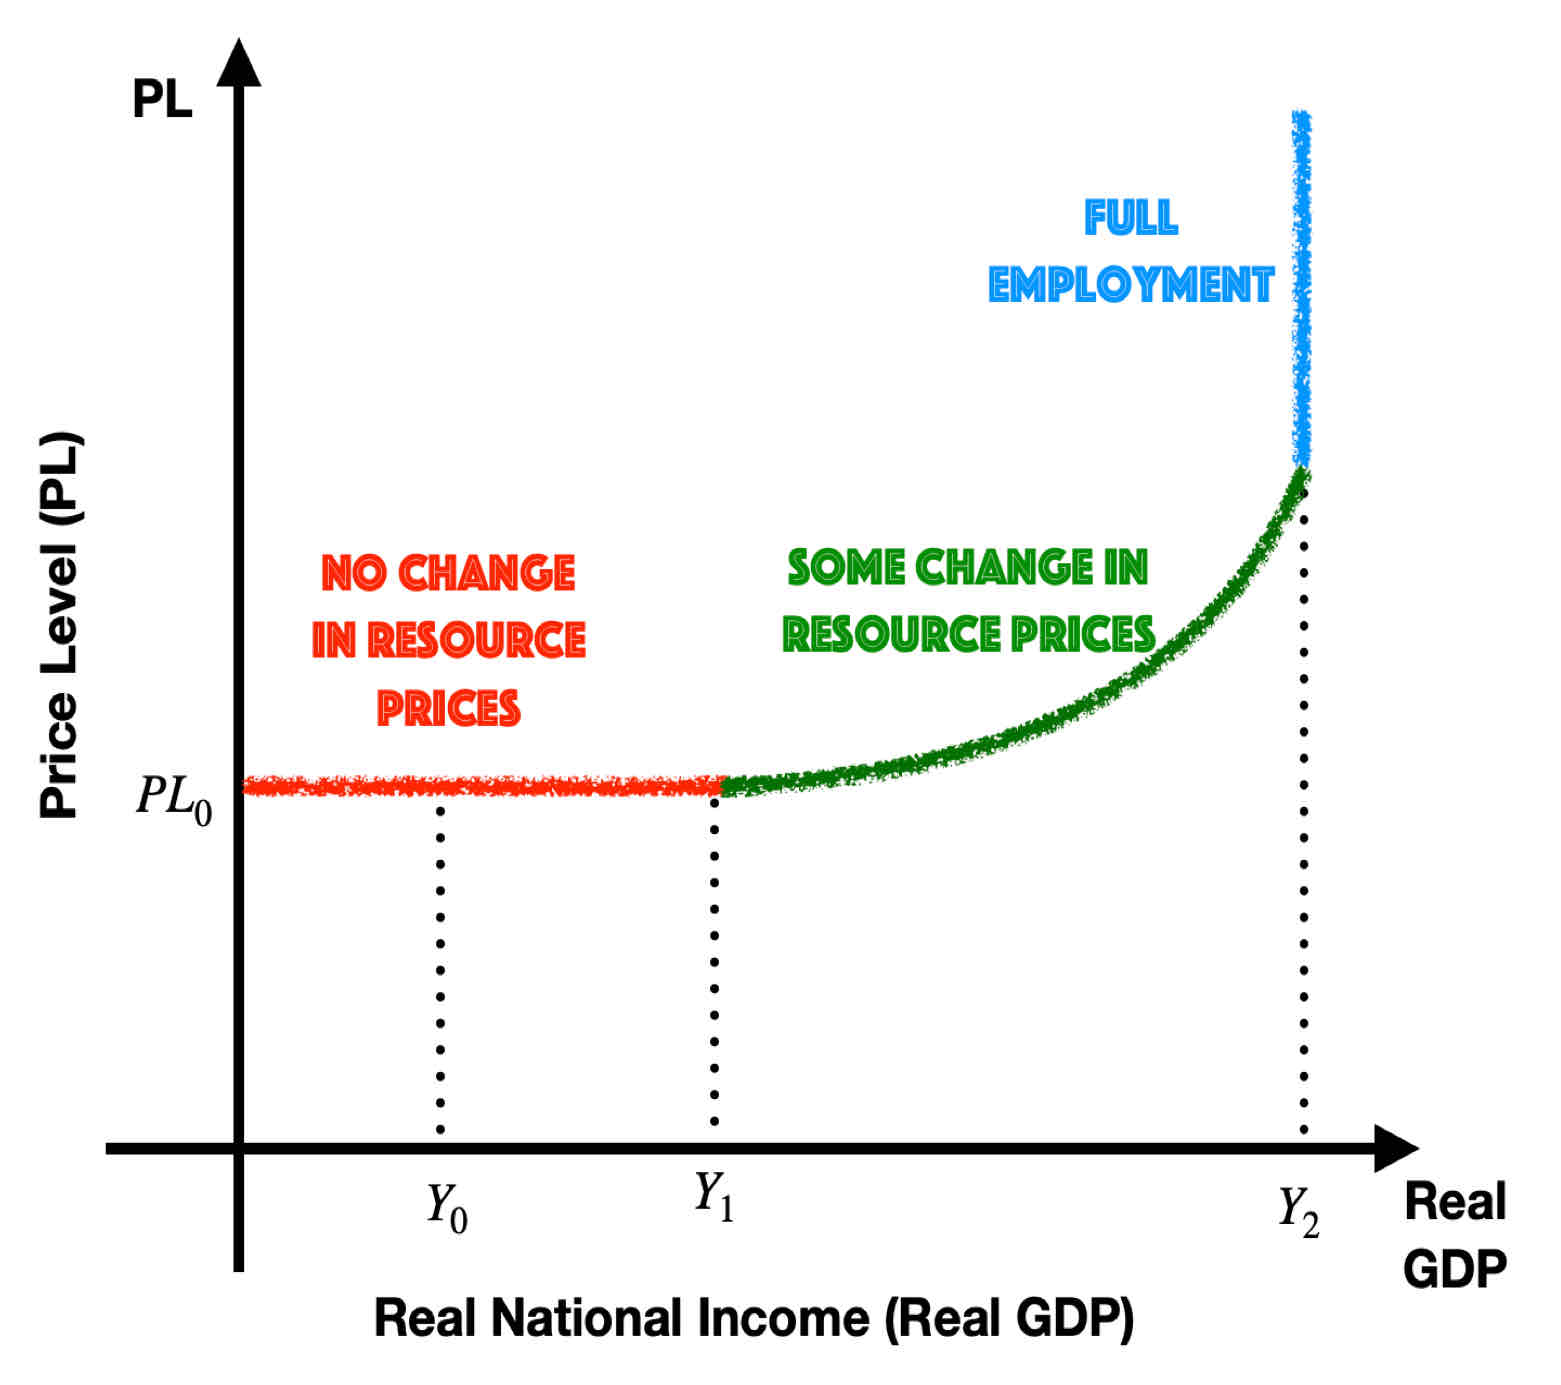
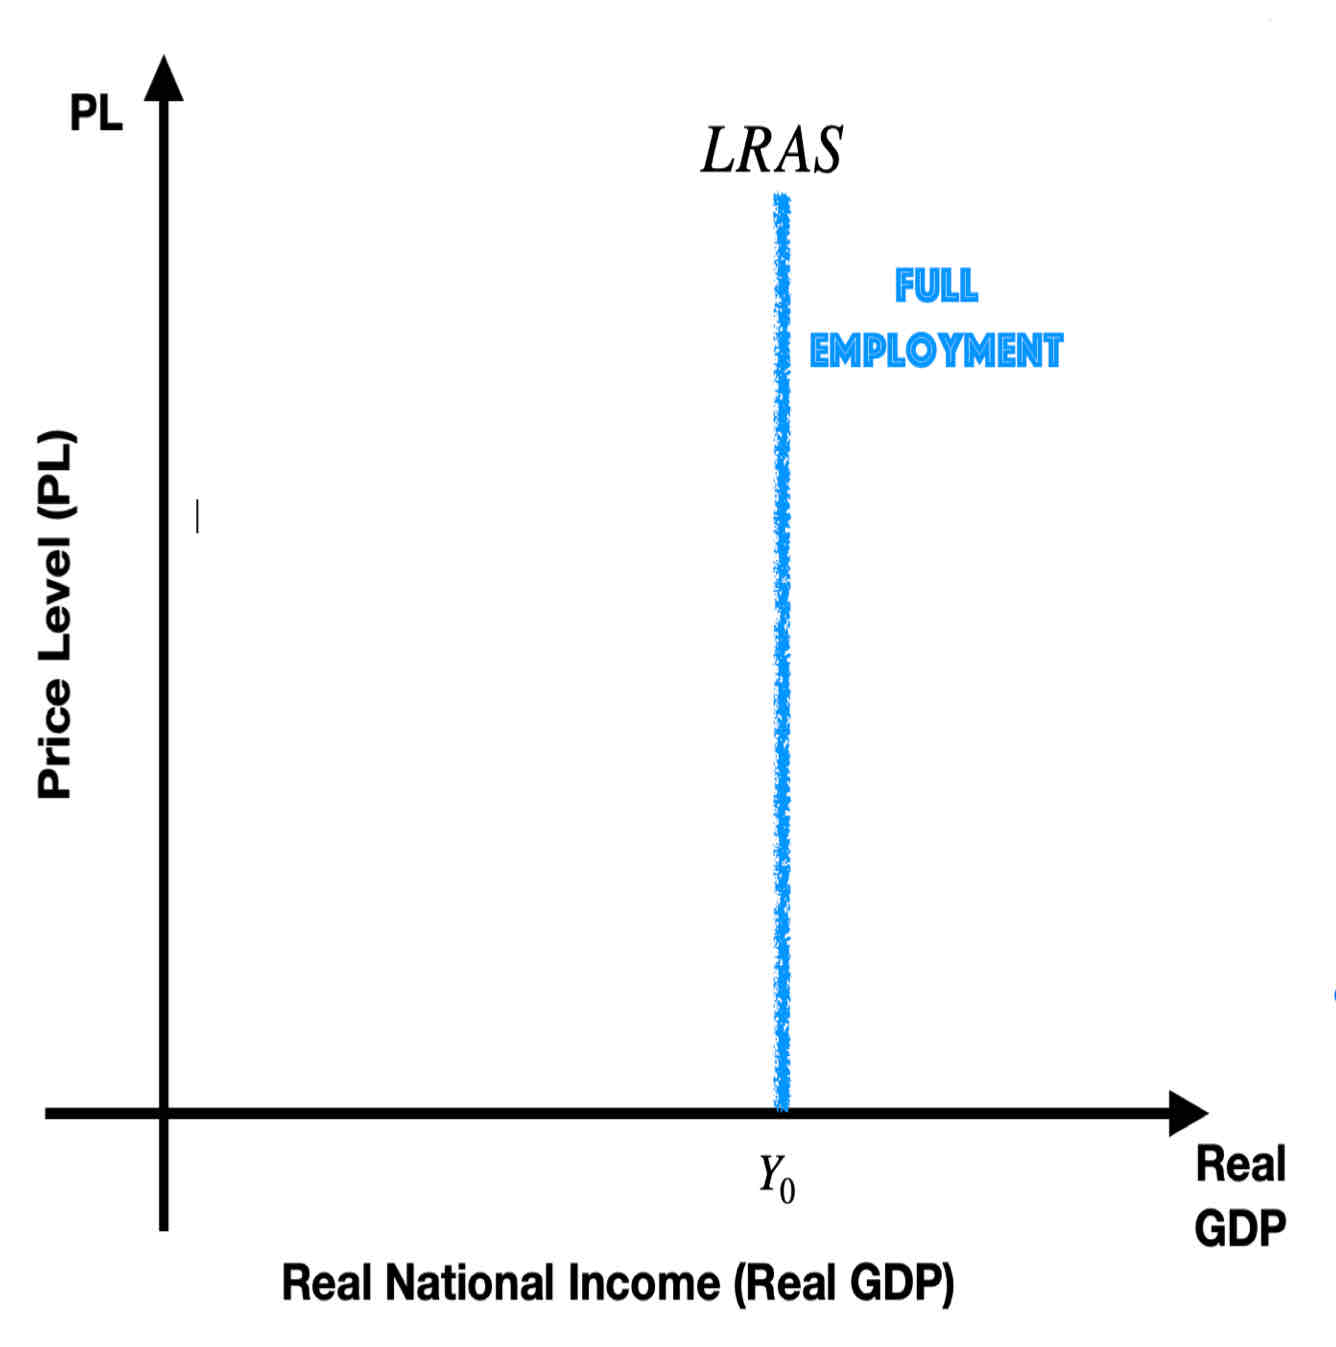
Neo classical model of LRAS
Aggregate supply is perfectly inelastic at the nation's full employment level of output.
Define the eQUILIBRIUM LEVEL OF OUTPUT IN AD-AS MODEL
In the AD-AS model, the equilibrium level of output (or real GDP) occurs where aggregate demand intersects aggregate supply. In the short run, equilibrium is given by the point of intersection of the AD and SRAS curves, and determines the price level, the level of real GDP and the level of employment.
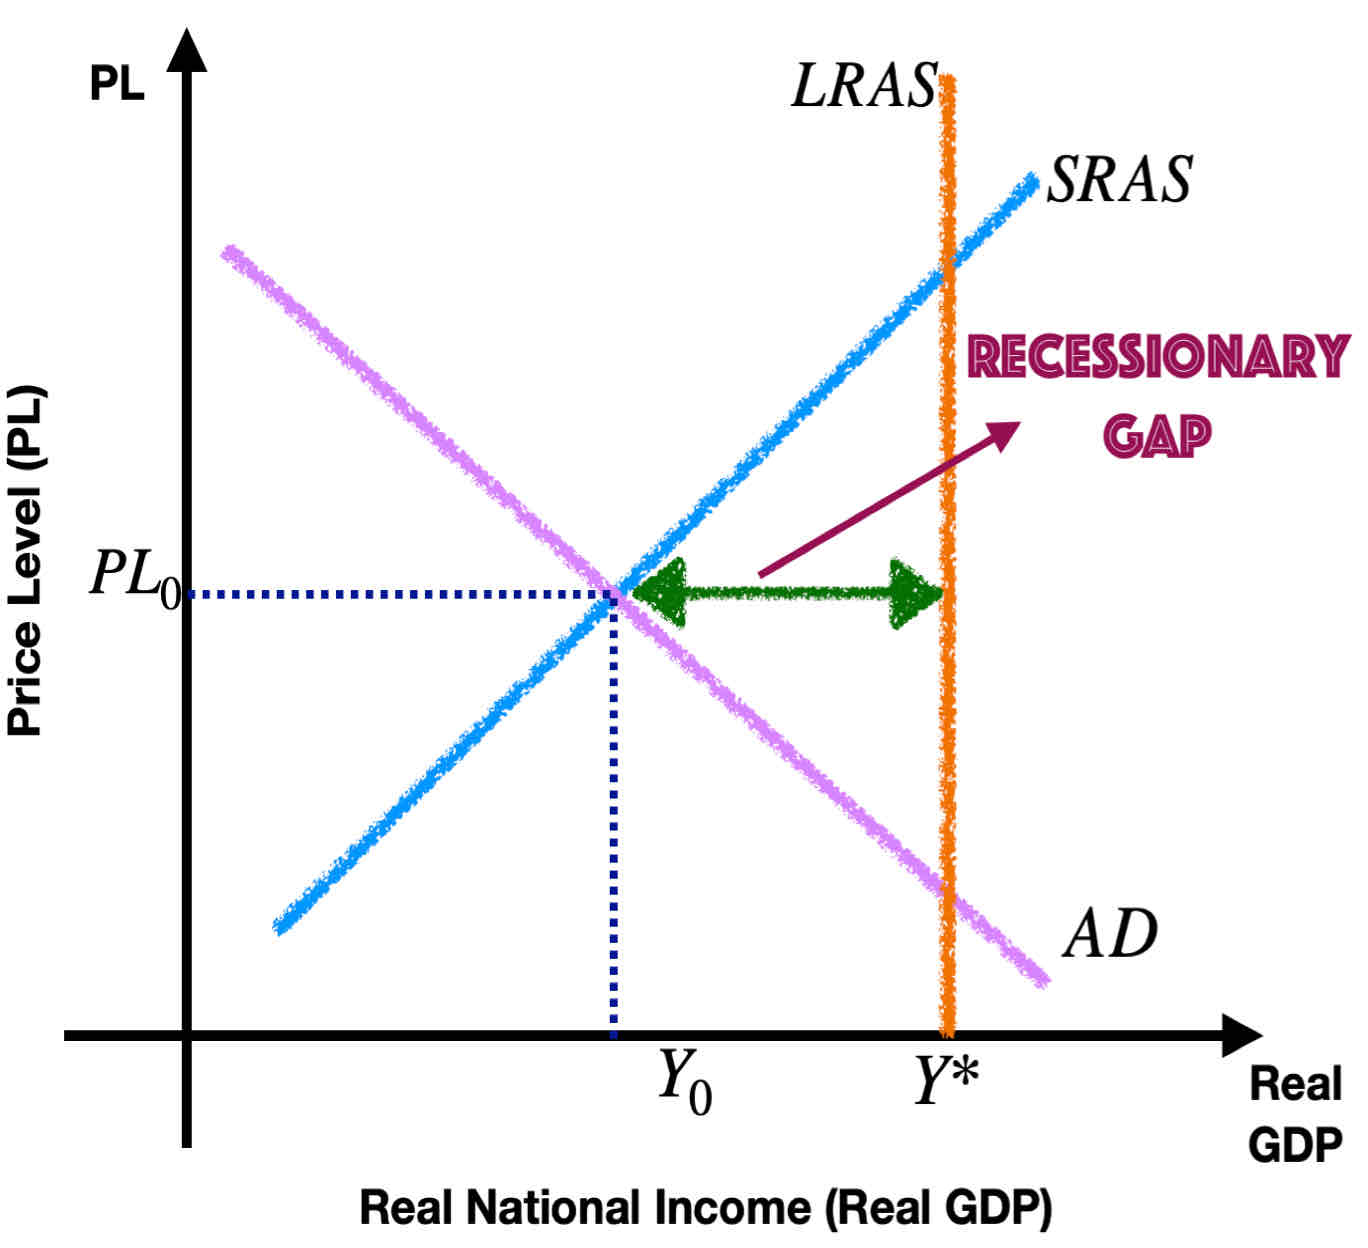
Explain the recessionary/deflationary gap
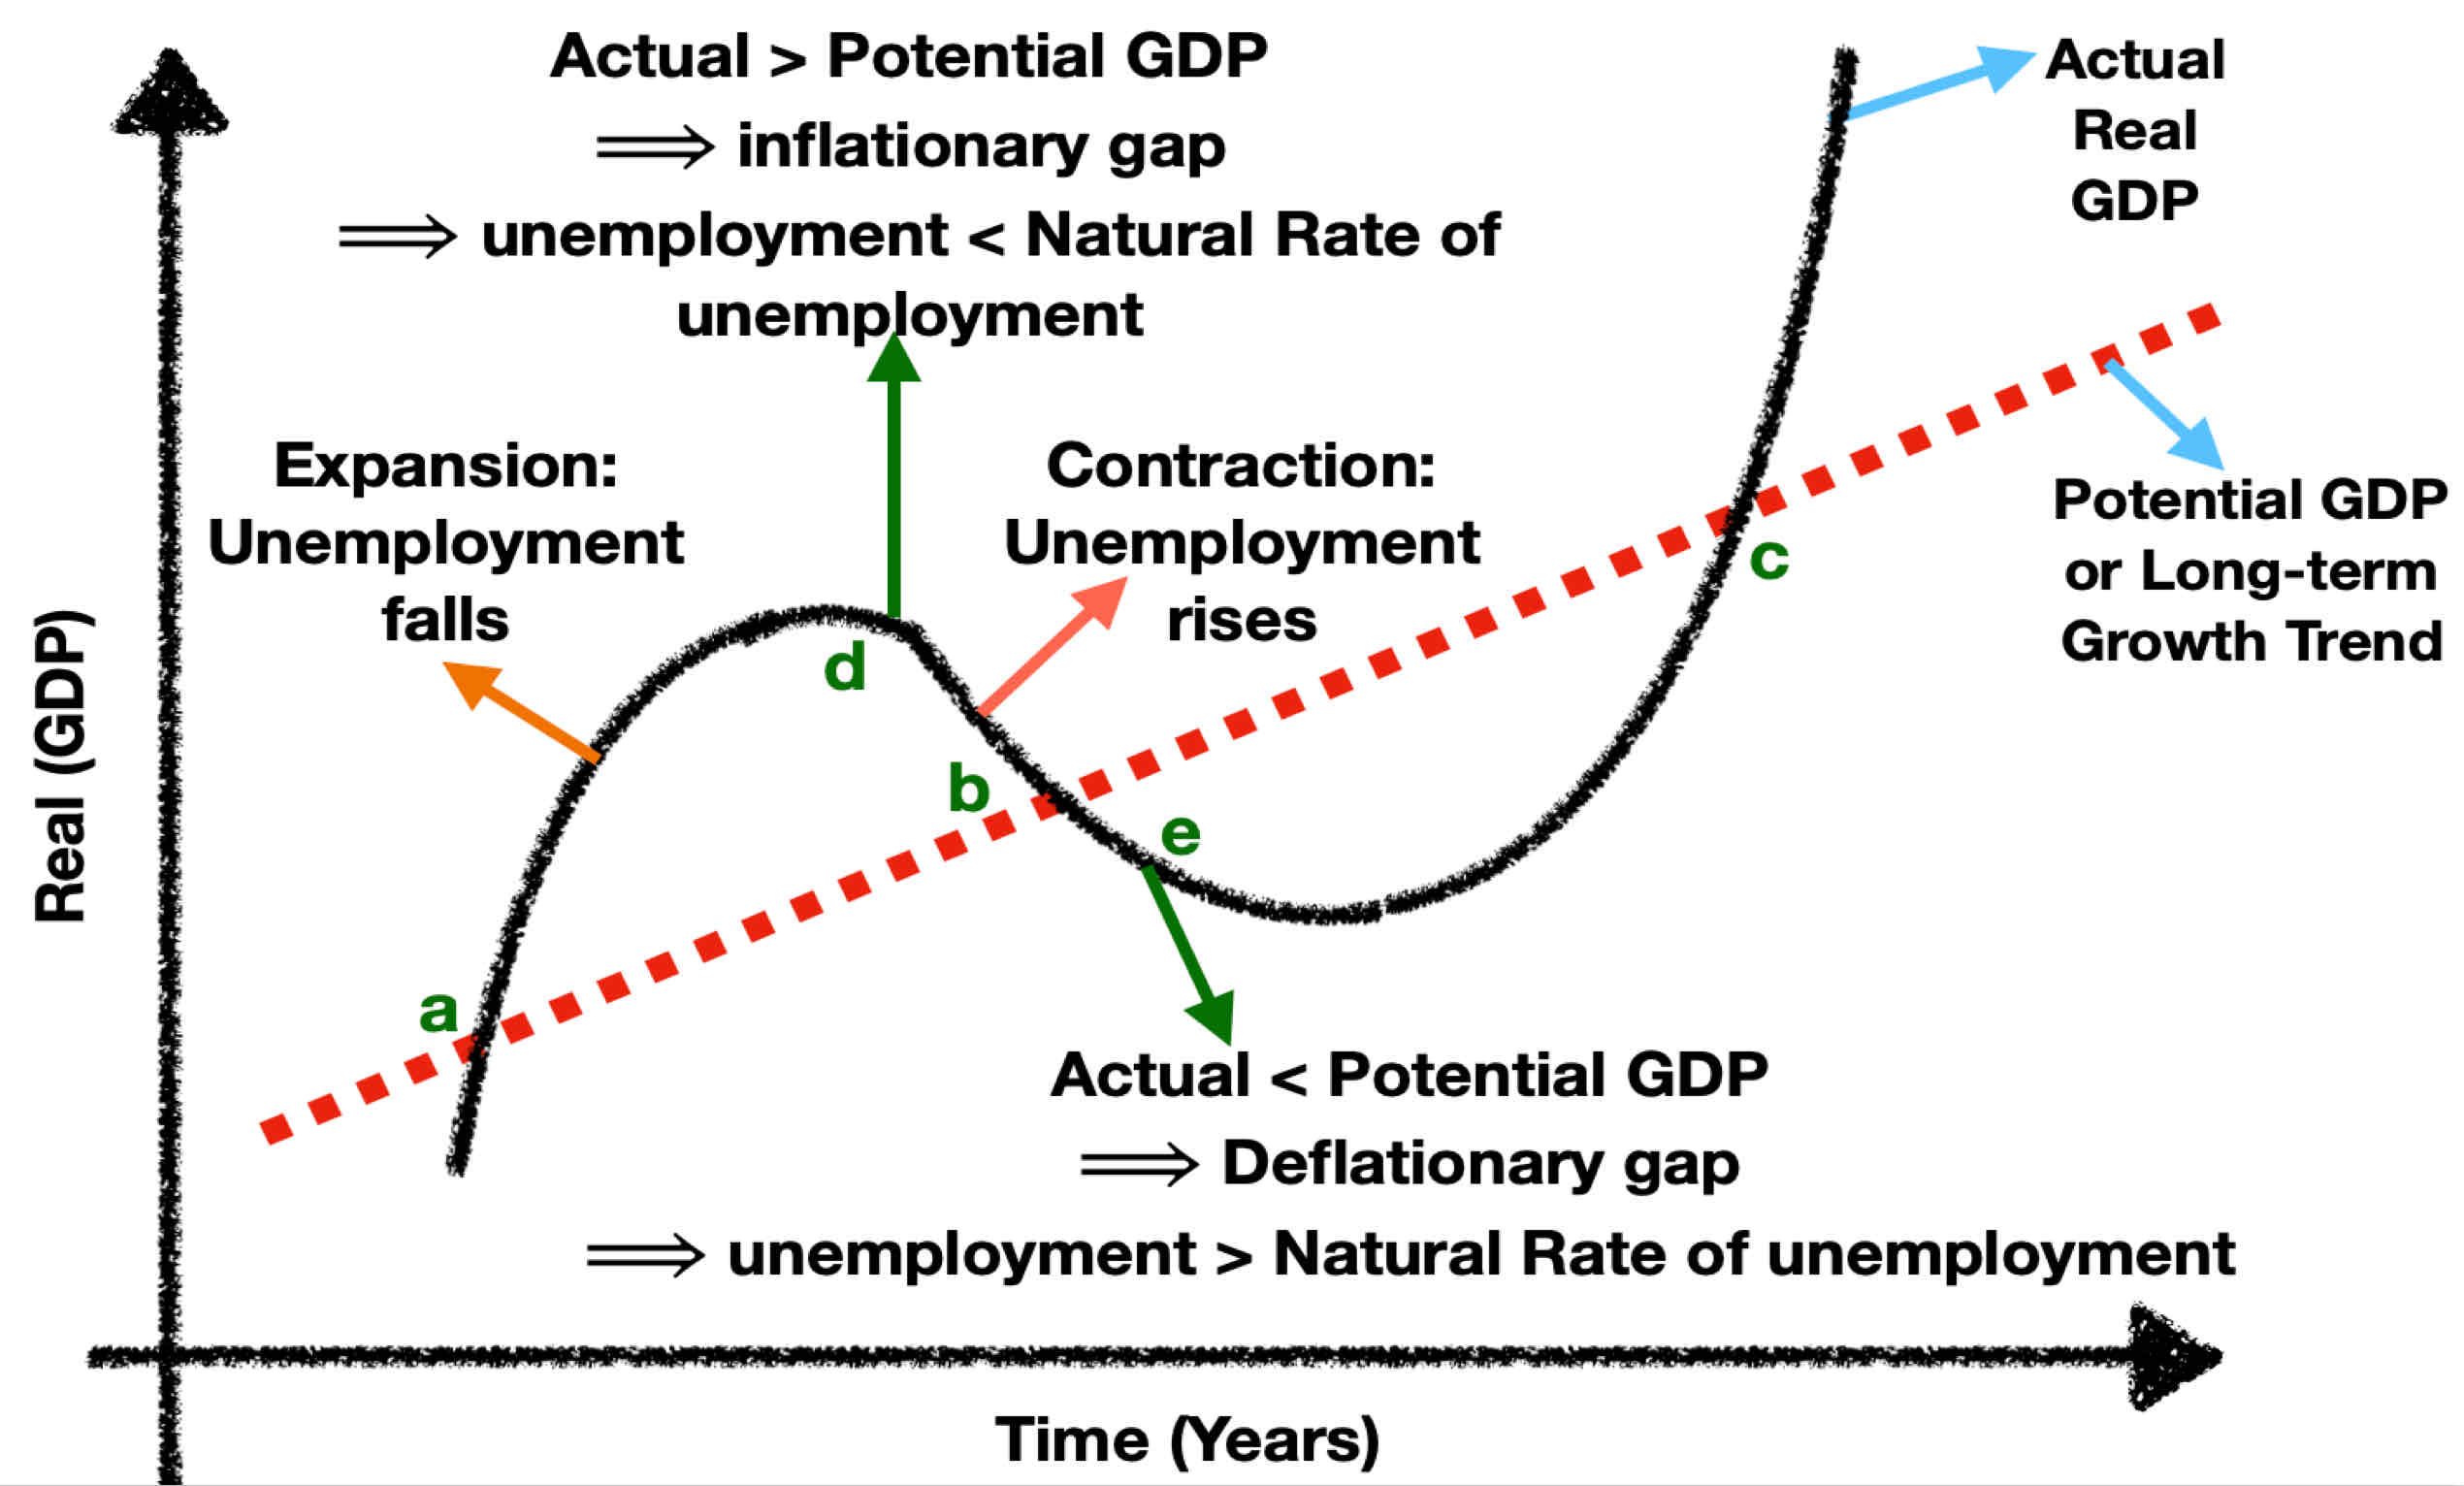
A recessionary/deflationary gap is a situation where real GDP is less than potential GDP and unemployment is greater than the natural rate of unemployment due to insufficient aggregate demand.
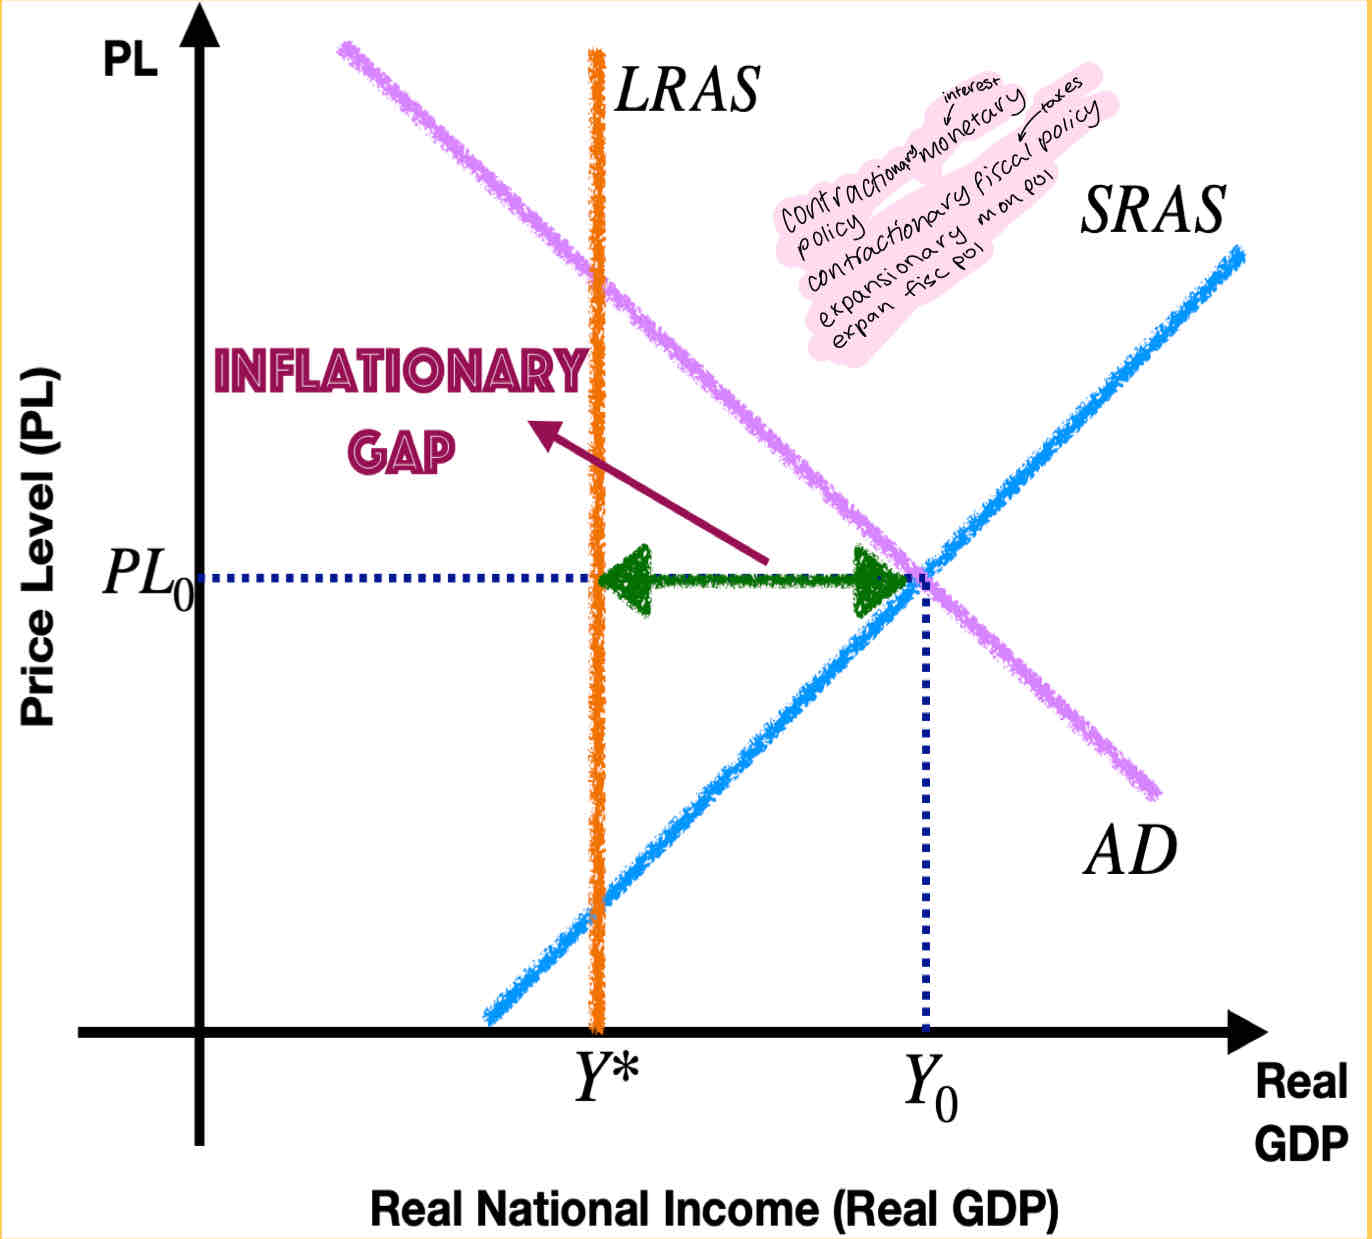
Define the expansionary/inflationary gap
An inflationary gap is a situation where real GDP is greater than potential GDP and unemployment is smaller than the natural rate of unemployment due to excess aggregate demand.
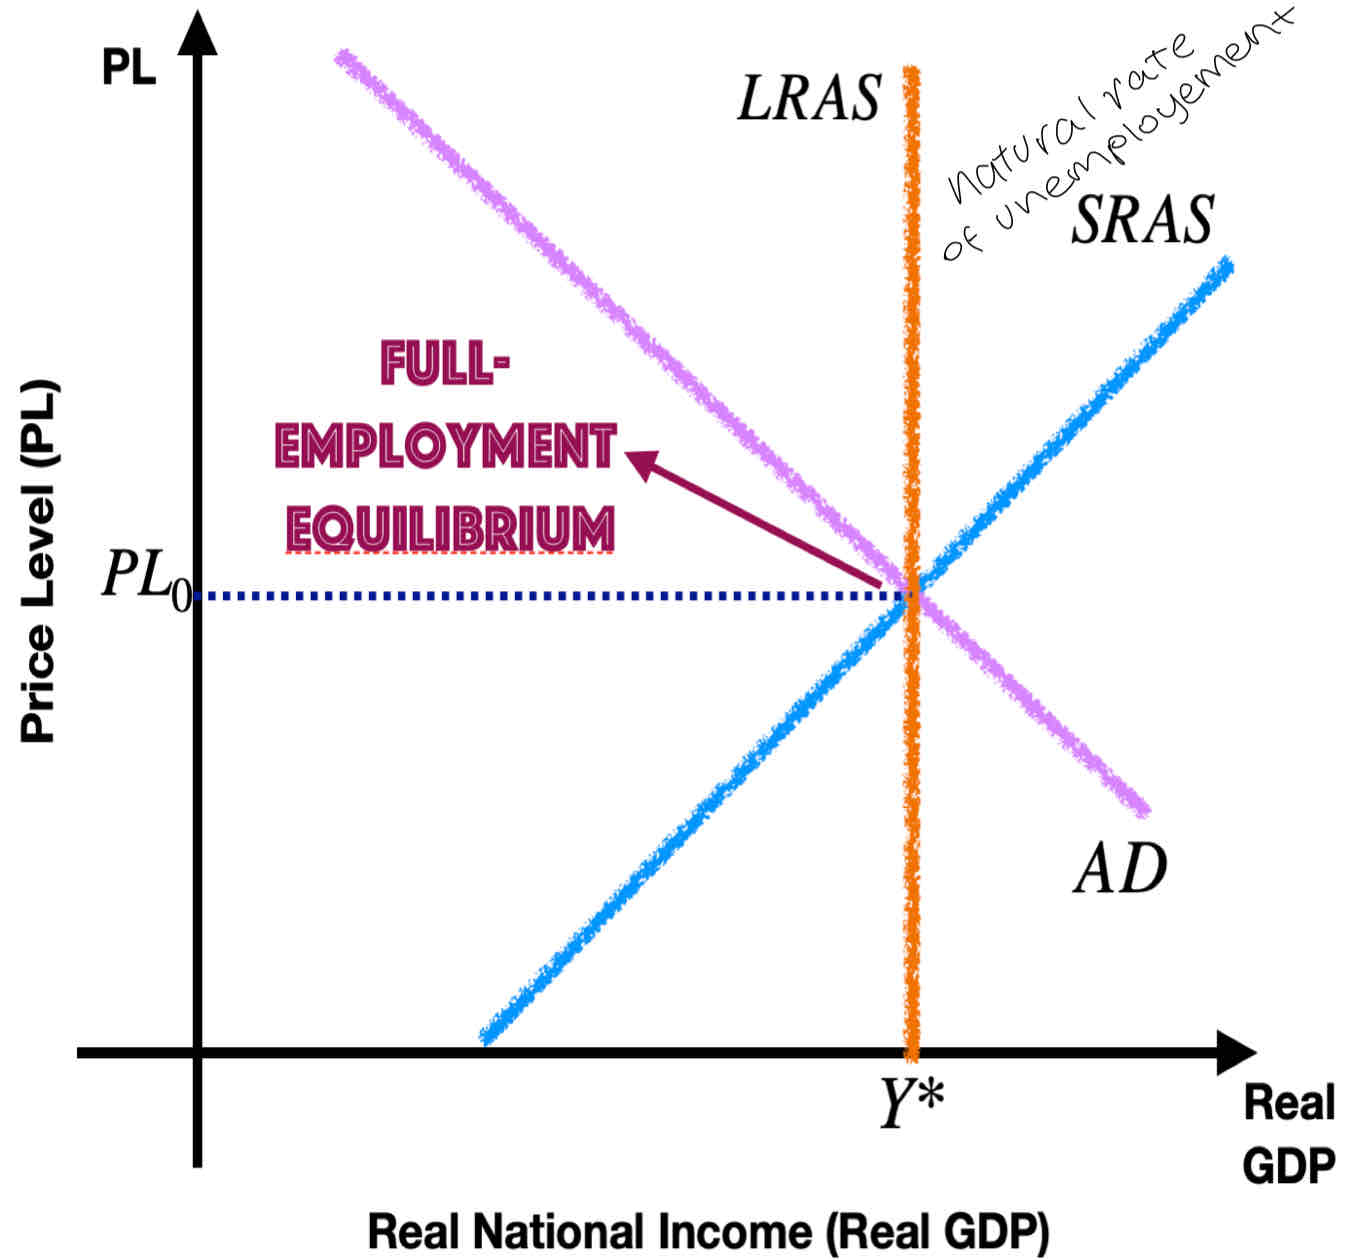
What’s full employment equilibrium
When the economy is at its full employment equilibrium level of GDP, the AD curve intersects the SRAS curve at the level of potential GDP, and there is no deflationary or inflationary gap. This is the economy's full employment level of output.
Explain the business cycle
Keynesian vs neo classical model of LRAS
Achieving full employment implies that a nation is producing at or close to its production possibilities curve (PPC).
Full employment does not mean zero unemployment; it refers to a situation where unemployment is low and stable, with unemployed individuals typically transitioning between jobs or facing skill mismatches in the labor market.
