3.1.11 BIODIVERSITY WITHIN A COMMUNITY
1/114
There's no tags or description
Looks like no tags are added yet.
Name | Mastery | Learn | Test | Matching | Spaced | Call with Kai |
|---|
No analytics yet
Send a link to your students to track their progress
115 Terms
What are the different levels of biodiveristy?
- Local biodiversity → the variety of species living in a small habitat e.g. pond / meadow
- Global biodiversity → the variety of species living on Earth
Define Genetic diversity.
the number of different alleles of a gene in a species or population
Define Natural selection.
Individuals of a population that are best suited (best alleles + phenotype) to their environment survive + reproduce more. The beneficial alleles are most likely to pass on to the next generation
Define Evolution.
change in allele frequency over time
How does evolution / natural selection take place?
- Variation of alleles exist in population
- Result of mutation
- Selection for individuals with beneficial allele
- Differential reproductive success (more likely to survive + reproduce)
- Changes allele frequency
- Over a long period of time
Fill in the gaps.
The greater the number of ________ alleles in all members of a species, the greater the __________ _________, the more likely that species will be able to adapt to an _________________ ___________ due to the ______ range of alleles therefore a wide range of characteristics, therefore there is a greater probability that some individual will possess a ________ that suits it to the new environmental conditions.
Genetic diversity is reduced when a species has _______ ___________ alleles.
- different
- genetic diversity
- environmental change
- wide
- characteristic
- fewer different
What is selective / artificial breeding?
Identifying individuals with desired characteristics and selectively breeding them to parent the next generation. Offspring that do not exhibit the desired characters are killed or at least prevented from breeding. In this way, alleles for unwanted characteristics are bred out of the population.
What is the disadvantage of artificial / selective breeding?
The variety of alleles in the population is deliberately restricted to a small number of desired alleles. Over many generations, this leads to a population in which all individuals possess the desired qualities, but which have a reduced genetic diversity.
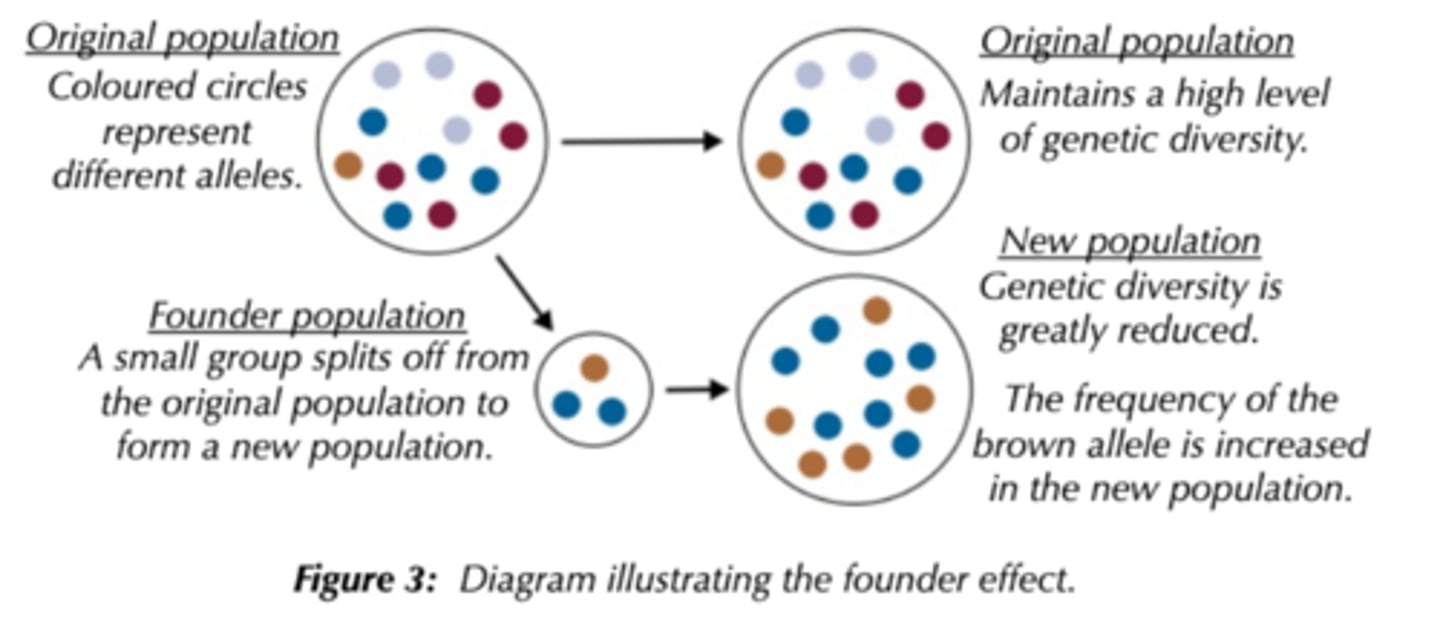
Describe the founder effect.
When a few individuals from a population colonise a new region. Carry only a small fraction of alleles of the population as a whole. Have Less genetic diversity than the population from which they came. As these species have fewer alleles, they are less able to adapt to changing conditions.
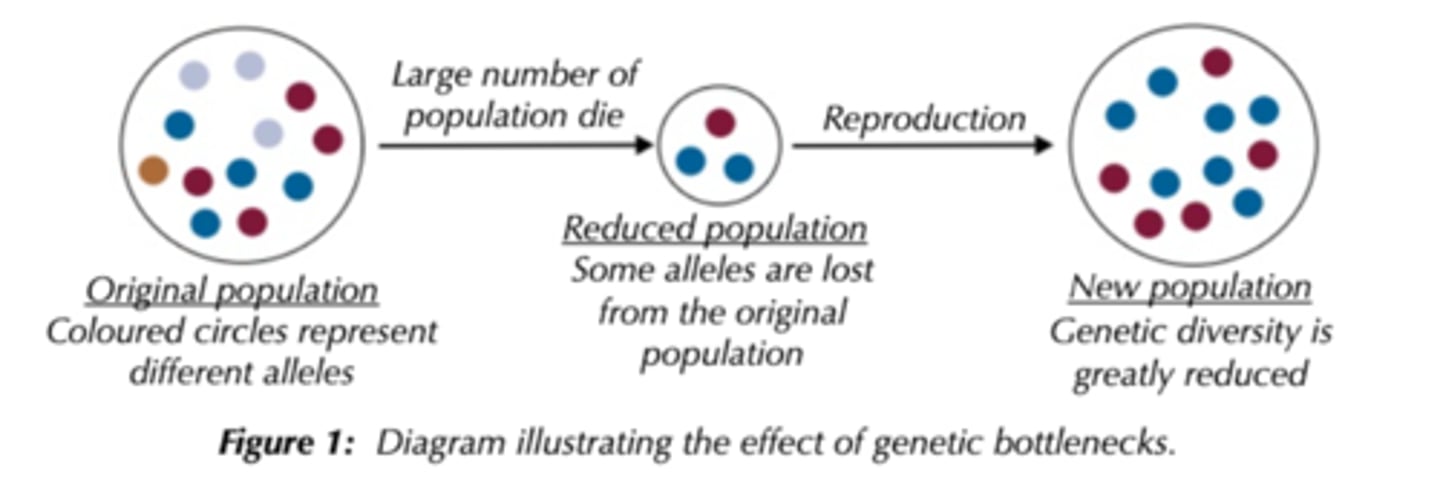
Describe genetic bottlenecks.
Population suffers dramatic drop in number eg due to natural disasters, few survivors have much smaller alleles than the original population. Genetic diversity is less and remains restricted. This makes it less likely that the population can adapt to any change in its environment.
How do you compare genetic diversity within, or between species?
The frequency of different alleles
- Indicates genetic diversity because is based on the fact that different alleles determine different characteristics
- So the higher the variety of a characteristic, the higher the variety of alleles of the gene and hence the higher the genetic diversity
- Comparing DNA base sequence & mRNA sequence
- The frequency of specific base sequences or alleles in populations,
- Amino acid sequence of the proteins encoded by DNAand mRNA (1o structure), observe characteristics → put into groups
How and why has gene technology caused a change in the methods of investigating genetic diversity?
Early estimates of genetic diversity made by looking at frequency of measurable / observable characteristics in a population
Limitations:
- Many observable characteristic coded for by more than one gene (polygenic) → vary continuously → difficult to distinguish one from another
- Characteristics could be modified by the environment so differences may be as a result of different environmental conditions rather than different alleles
Gene technologies have made it possible to directly obtain DNA sequences. These technologies can be used to give more accurate estimates of genetic diversity within a population / species because:
- Different alleles of the same gene have slightly different base sequences
- Comparing DNA base sequences of same gene in different organisms in a population → find out how many alleles of the gene in a population
- Different alleles transcribed into slightly different mRNA base sequences and may produced polypeptides with slightly different amino acid sequences which can also be compared
Describe the principles of natural selection in the evolution of populations
1. Variation of alleles exists in populations due to random DNA mutations; E.g. some bacteria contain gene for antibiotic resistance due to a mutation
2. Selection pressure / change in environment; E.g. antibiotic introduced
3. Those with advantageous allele have increased chance of survival and reproduction - differential survival / reproductive success; E.g. bacteria with gene for resistance survive and reproduce whilst those without it die
4. Those surviving / reproducing pass advantageous allele to offspring
5. Frequency of advantageous allele and (named) characteristic increases in the population
6. Over many generations / long period of time
(evolution: change in allele frequency over time)
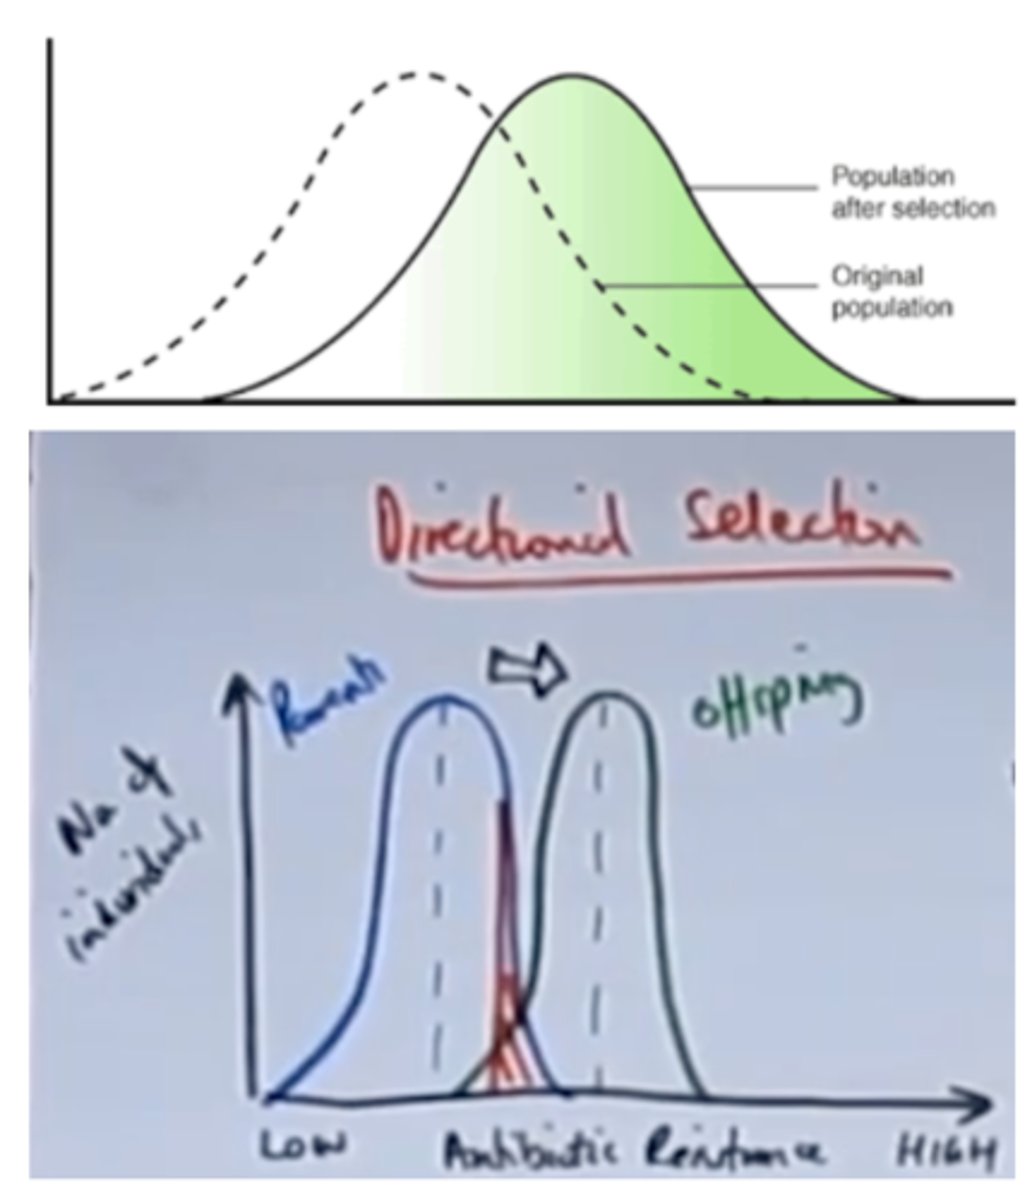
Describe directional selection:
- Change in environmental conditions
- Selection pressure acts one side of the mean
- One extreme phenotype (with extreme type of characteristic) more likely to survive and reproduce
- Eg: Bacteria with gene for antibiotic resistance
- Mean phenotype changes
- Antibiotic resistance allele will increase in offspring
The mean amount of antibiotic resistance changes (increases)
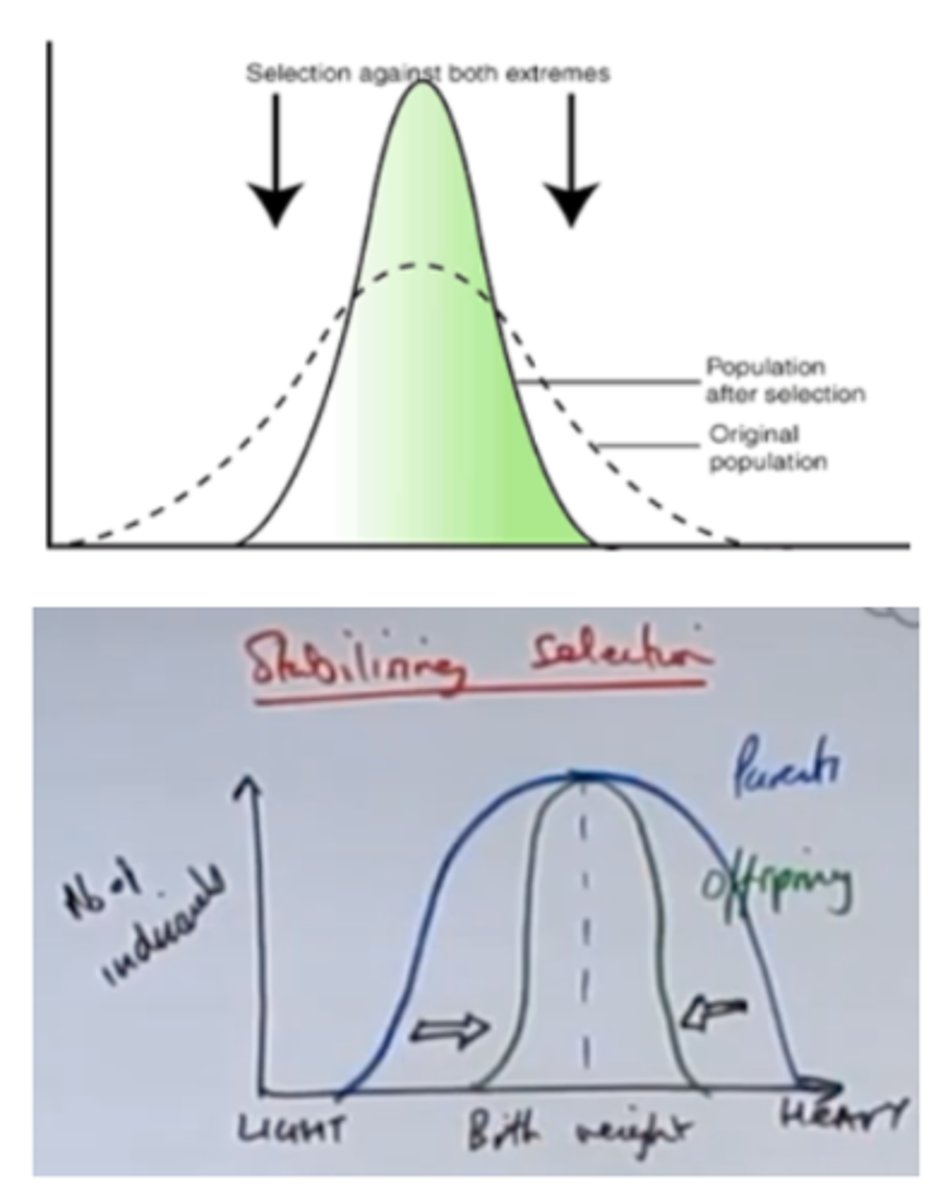
Describe stabilising selection.
- keeps allele frequencies relatively constant over generations;
- Stable / unchanging environment
- Selection pressure acts either side of the mean
- Both extremes of phenotypes (with extreme characteristics) less likely to survive and reproduce
- Very small or very large babies
- Very heavy babies more likely to die (complications)
- Very light babies more likely to die (cold as high surface area to volume ratio)
- Most likely to survive in the middle range
- Mean phenotype remains the same
Describe how natural selection results in better adapted species.
Adaptations can be: anatomical, physiological, behavioural
Anatomical: Structural features of organisms body / observed structures E.g. whales thick layer of bubbler keeps warm in cold sea
Physiological: Processes inside the body E.g. brown bears hibernate in the winter, lower metabolism to conserve energy so they don't need to look for food when its scarce
Behavioural: Ways an organism acts E.g. possum plays dead if they’re being threatened by a predator, to escape attack
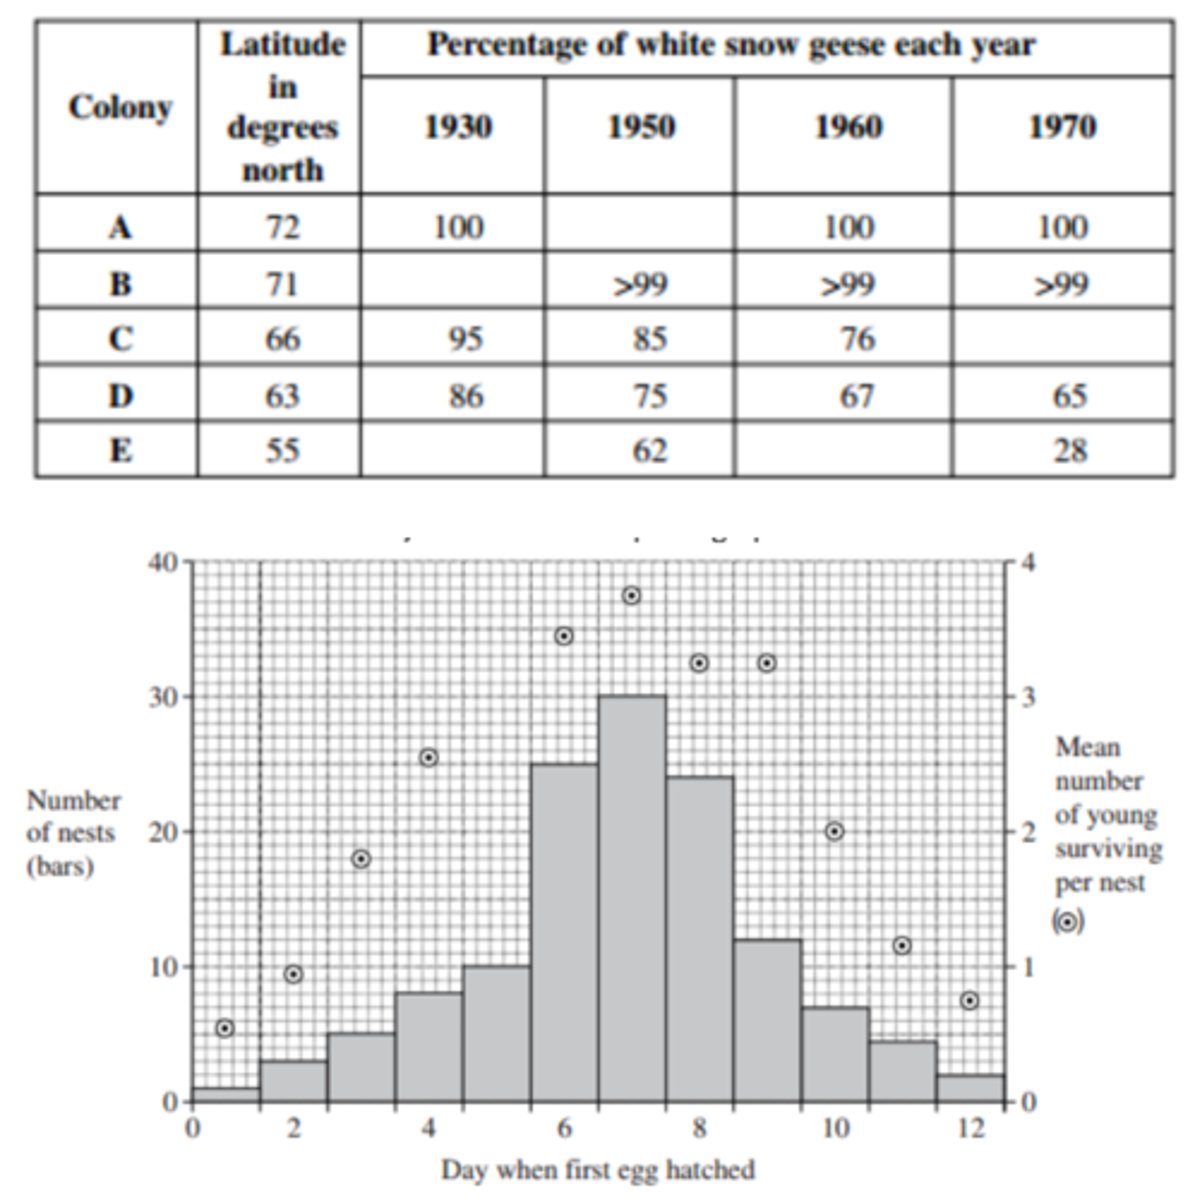
Q: Snow geese fly north to the Arctic in the spring and form breeding colonies. Different colonies from at different latitudes. The greater the latitude, the further north is the colony. The further north a breeding colony forms, the colder the temperature and the greater the risk of snow.
1. There is a positive correlation between the size of snow geese and how far north they breed. A large size results in snow geese being adapted for breeding in colder conditions. Explain how. (2 MARKS)
Snow geese are either white or blue in colour. The table shows the percentage of white snow geese in colonies at different latitudes at different times over a 40-year period. The blank cells in the table are years for which no figures are available.
2. Describe how the percentage of white snow geese varies with distance north. (1 MARK)
3. The further north, the greater the risk of snow. Use this information to explain how natural selection might have accounted for the effect of latitude on the percentage of white snow geese. (3 MARKS)
4. The percentage of white snow geese in these colonies changed over the period shown in the table. Use your knowledge of climate change to suggest an explanation. (2 MARKS)
Snow geese breed in large colonies. Scientists studied the nests in one colony. For each nest, they recorded the day on which the first egg hatched. They also recorded the number of young that survived from the nest. They used the data to plot a graph.
5. What types of natural selection is shown in the graph? Describe the dividend for your answer. (2 MARK)
1. - Small surface area to volume ratio / more fat
- Lose less heat (to the environment) / for insulation
- When they are sitting on eggs
2. The further north / higher the latitude, the higher the percentage of white snow geese
3. - Snow lying longer / melts slower further north / at greater latitudes
- White geese better camouflaged (further north)
- Predation linked to survival / reproductive success
4. - Snow melts earlier / snow melts further north / less snow
- White geese decreasing as less well camouflaged / at disadvantage / blue geese increasing as better camouflaged / at an advantage
5. Stabilising; Few geese survive at the extremes / most survive from the middle of the range
Q: A person is infected with a species of bacteria. Some of these bacteria are resistant to penicillin. A doctor gives the person a course of penicillin.
What would happen to the proportion of the species of bacteria that are resistant to penicillin? Explain your answer. (2 MARKS)
- Penicillin kills non-resistant bacteria . resistant bacteria survive / are not destroyed
- Resistant bacteria reproduce and increase in proportion
Q: Scientists studied the frequencies of two alleles of a gene in one population of sea otters. The dominant allele, T, codes for an enzyme. The other allele, t, is recessive and does not produce a functional enzyme. Several years later, they found that the frequency of the recessive allele had decreased.
What type of natural selection appears to have occurred in this population of sea otters? Explain how this type of selection led to a decrease in the frequency of the recessive allele. (2 MARKS)
- Directional
- The recessive allele coffers disadvantage / the dominant allele confers advantage / more likely to survive / reproduce
Q: Explain how the use of pesticides can result in resistant strains of insect pests. (6 MARKS)
- Variation / variety in pest population
- Due to mutation
- Allele for resistance
- Reference to selection
- Pests with resistance (survive and0 breed / differential reproductive success
- Increase in frequency of allele
Q: The allele for normal haemoglobin in red blood cells is HbA. in some parts of Africa where malaria occurs there is a high frequency in the population of the allele HbC. individuals possessing the HbC allele have a lower chance of developing severe malaria. Severe malaria causes a large number of deaths in Africa.
Explain the high frequency of the HbC allele increase where malaria occurs. (3 MARKS)
- Individuals with the HbC allele reproduce
- Pass on HbC allele which increases in frequency
- HbA individuals less likely to survive / reproduce / frequency of hbA (allele) decreases
Q: In the past, domestic chickens were given antibiotics as a growth promoter. The use of antibiotics as growth promoters in animal production was banned in the European Union in 2006. Suggest a concern that led to this ban. (1 MARK)
Antibiotic resistant pathogens / bacteria OR antibiotics kill useful bacteria OR idea of antibiotic passing into human food
Q: Species of Streptomyces bacteria are naturally found in soil, along with many other types of bacteria. They produce a wide range of clinically useful antibiotics including tetracycline-based antibiotics.
1. Use your knowledge of evolution by natural selection to explain how tetracycline- producing Streptomyces species may have become common in the population. (4 marks)
2. Species of Streptomyces also possess tet-resistance genes that protect them from the effects of tetracycline. For example, the tetA genes are responsible for pumping tetracycline out of cells, thereby protecting cells from its harmful effects. State whether tet-resistance is an example of directional or stabilising selection. Give a reason for your answer. (1 mark)
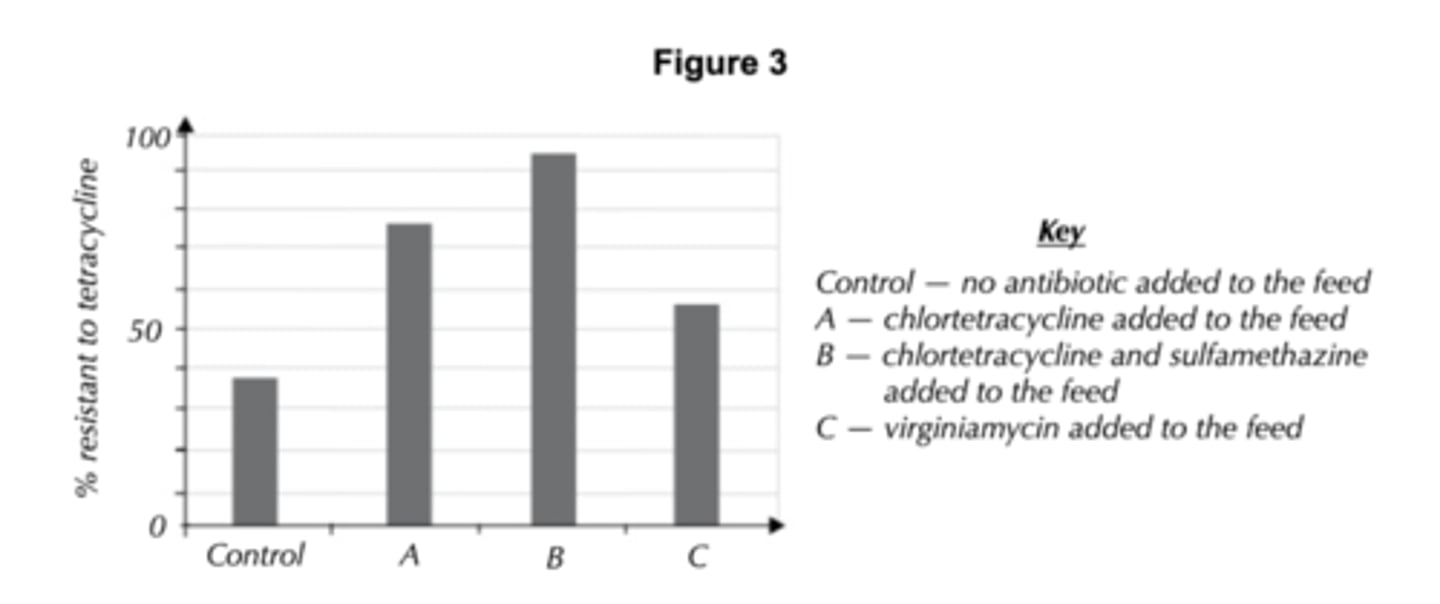
Tet-resistance is now found in a number of other species of bacteria. Scientists investigated the link between the use of antibiotics in cattle feed and the tetracycline resistance of E. coli samples isolated from the cattle. The samples were grown on agar plates and then tested for resistance to tetracycline.
The results are shown in Figure 3.
3. Suggest two factors the scientists should have considered when selecting cattle for the experiment. (2 marks)
4. Explain why the bacteria in the control sample were taken from cattle that had no antibiotics added to their feed. (1 mark)
5. What conclusions can be drawn from the results of the study? (3 marks)
1. - As a result of mutations, some individuals in a population have alleles for producing tetracycline-based antibiotics (1 mark).
- This means they can kill other bacteria in the area, reducing competition for nutrients (1 mark).
- So these bacteria are more likely to survive, reproduce and pass on their alleles to the next generation (1 mark).
- After many generations the frequency of the beneficial allele increases in the population. / After many generations most bacteria in the population will have the alleles to produce tetracycline- based antibiotics (1 mark).
2. Directional selection because that is where individuals with alleles for characteristics of an extreme type, such as antibiotic resistance, are more likely to survive and reproduce (1 mark).
3. Any two from: e.g. they should all be the same breed of cattle. / The cattle should all be the same age. / The cattle should all be kept in the same type of environment. / None of the cattle should have been given any other antibiotics before the experiment started. (1 mark for each correct)
4. To see what percentage of the E. coli present in the cows' stomachs were already resistant to tetracycline (1 mark).
5. - E.g. tetracycline resistance is present in some of the cattle who do not receive any antibiotics in their feed (1 mark)
- and in cattle that had antibiotics other than tetracycline added to their feed (1 mark).
- Cattle that had both tetracycline and sulfamethazine added to their feed showed the most resistance to tetracycline/more resistance than cattle that had tetracycline alone added to their food (1 mark).
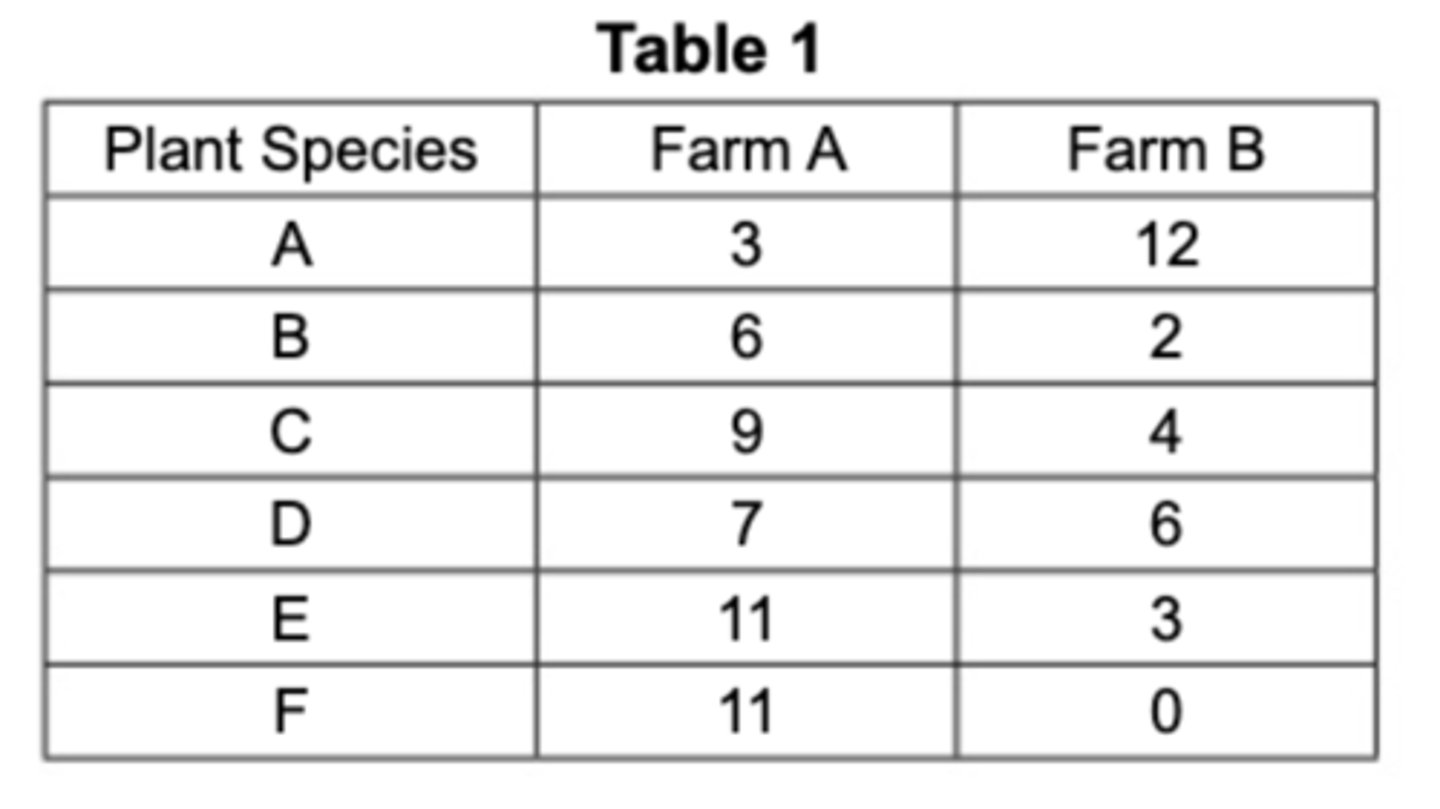
Q: A team of students have investigated plant biodiversity on two farms. To do so, they calculated an index of diversity. Species richness can also be used to measure biodiversity.
1. Explain why an index of diversity is a more accurate way of measuring biodiversity than species richness. (2 marks)
Table 1 shows the number of individuals of different plant species found in a single hedgerow on each farm.
2. Calculate the index of diversity for the hedgerow on each farm using the equation provided below.
d = N(N-1) / sum of n(n-1)
Where, N = total number of all organisms
And n = total number of organisms in one species.
(4 marks)
3. One of the farms grows organic crops and does not use chemical herbicides. Which farm is this most likely to be? Explain your answer. (2 marks)
4. Many organic farms use biological pesticides. These include introducing organisms that prey on the pests that eat crops. The students behind the first study want to investigate the impact of biological pesticides on insect species diversity in farm hedgerows. Suggest a control the students might use in their investigation. (1 mark)
5. The government offers grants to farmers to maintain their hedgerows. Suggest one advantage to farmers of removing hedgerows from their land.(1 mark)
6. Suggest what impact hedgerow removal could have on insect biodiversity on the farm. Explain your answer.(3 marks)
1. - The index of diversity takes the number of individuals of each species into account, as well as the overall number of species - unlike species richness (which is just the number of species) (1 mark).
- This gives a more accurate picture of biodiversity because species that are in a community in very small numbers aren't treated the same as those with bigger populations (1 mark).
2. Farm A = 5.84
Farm B = 3.86
3. - Farm A. It has a higher index of diversity (1 mark)
- and using chemical herbicides tends to reduce the number and abundance of species (1 mark).
4. E.g. they could include a sample of hedgerows do not use on farms that biological pesticides (1 mark).
5. E.g it increases the area of farmland by turning lots of small fields into fewer large fields, which may increase crop production / make it easier to plant/harvest a lot of crops at once (1 mark).
6. - Hedgerow removal could reduce insect biodiversity (1 mark).
- It destroys habitats, so insect species could lose their shelter and food sources (1 mark).
- This could kill insects or force them migrate to other areas (1 mark).
Q: Lactase is an enzyme that is necessary to digest lactose sugar in milk. Some parts of the world, animals are not farmed for milk and no dairy products are eaten. Adult humans that are native to these parts of the world do not produce lactase. In areas where animals are farmed for milk, native adult humans do produce lactase. In these populations, a new allele has arisen by gene mutation.
Over time, the frequency of this new allele increased in the gene pool of the human populations whose diet included milk. Name the process by which this increase occurred. (1 MARK)
Natural / directional selection
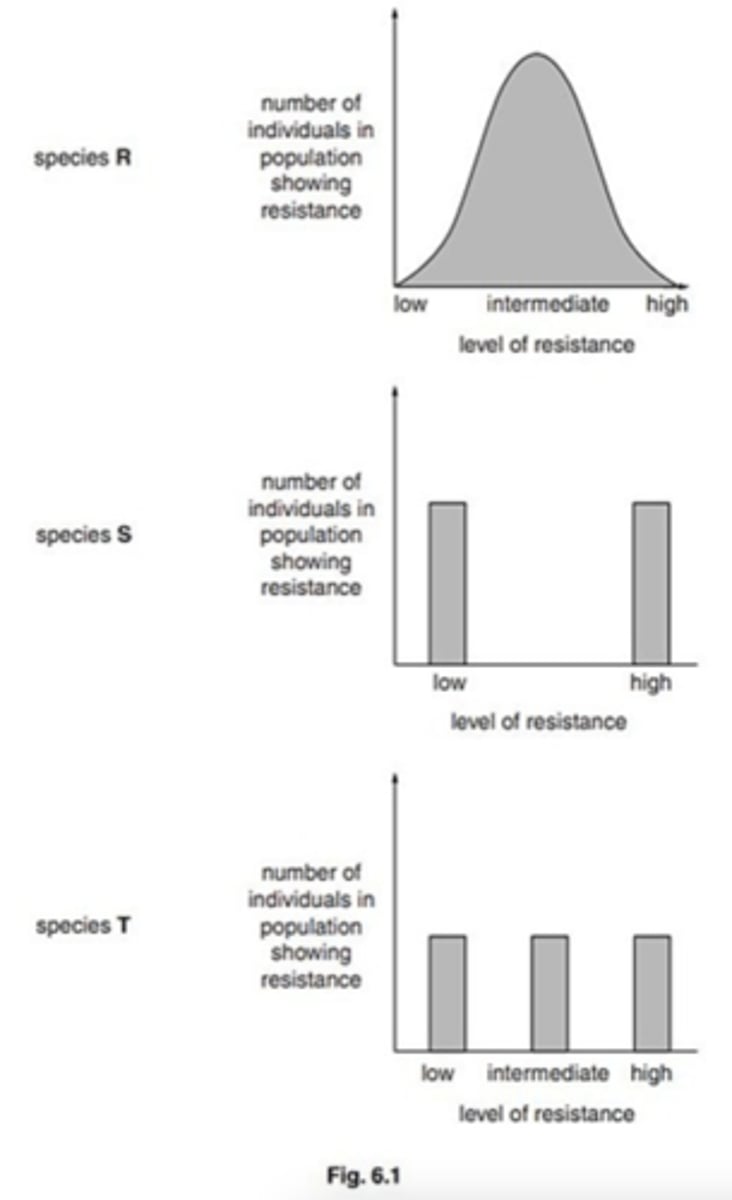
Q: Many species of insects have evolved resistance to chemical insecticides. A student noted a number of statements on his revision card that referred to the patterns of resistance shown in species R, S and T in Fig 6.1:
1. It is controlled by a single gene
2. There is an additive effect
3. May involve multiple alleles
4. Heterozygote shows distinct phenotype
5. Its controlled by many genes (polygenic)
6. Involved a dominant and a recessive allele
7. Shows codominance or incomplete dominance
8. Just involves two alleles
Select the correct numbered statement(s) that explain the genetic basis of each pattern of resistance for each species. You may select a number more than once. (6 MARKS)
1. Statement 1 in S and T only
2. Statement 8 in S and T only
3. Statements 2 and 3 in R only
4. Statement 5 in R only
5. Statements 4 and 7 in T only
6. Statement 6 in S only
Q: A mildew fungus infects wheat plants, causing disease. Some wheat plants have been bred to be resistance to the mildew. Over a period of time, mildew can overcome the resistance bred into the wheat.
Use the theory of natural selection to explain how the mildew fungus adapts to overcome this resistance. (7 MARKS)
- Genetic variation
- Due to mutation
- Mutation is spontaneous / random
- Mildew fungus produces large numbers of spores / gametes / offspring
- Wheat resistance acts as a selection pressure
- Individuals that overcome resistance have selective advantage / are more likely to survive / pass on mutation / mutated allele to offspring
- Increase in allele frequency (of allele to overcome resistance)
Q: The effect of global warming on the environment is uncertain. It is important to keep seeds of olf varieties of crops. Suggest why. (2 MARKS)
- Show greater variation
- Likely some individuals will have alleles / characteristics for survival
Q: Ecologists noticed that a species of birds surviving on colder islands has a larger body size than those living on warmer islands.
Explain how a larger body size is an adaptation to a colder climate. (2 MARKS)
- Larger birds have a lower SA:VOl ratio
- So less heat loss / more heat retained
Q: The amazonian forest today contains a very high diversity of bird species.
Over the last 2 000 000 years, long periods of dry climate caused this forest to be separated into a number of smaller forests.
Different plant communities developed in each of these smaller forests.
Each time the climate became wetter again, the smaller forests grew in size and merged to reform the Amazonian forest.
1. Use the information provided to explain how a very high diversity of bird species has developed in the amazonian forest. (5 MARKS)
2. Speciation is far less frequent in the reformed Amazonian forest. Suggest one reason for this. (1 MARK)
1. - No interbreeding / gene pools are separate / geographical isolation
- Mutation
- Different selection pressures / different foods / niches / habitats
- Adapted organisms survive and breed / differential reproductive success
- Change / increase in allele frequency / frequencies
2. Similar / same environmental / abiotic / biotic factors / similar / same selection pressures / no isolation / gene flow can occur (within a species);
Q: Milk contains lactose. Human babies produce the enzyme lactase, which digest lactose. Many human adults do not produce lactase and are lactose intolerant. People who are lactose intolerant can become very ill if they drink milk or eat dairy products, such as butter and cheese.
Scientists found that the percentage of people who can tolerate lacrosse is much higher in populations that drink a lot of milk and eat a lot of dairy products. Use your knowledge of natural selection to explain this finding. (4 MARKS)
- Selective advantage producing lactase / able to digest milk / eat dairy foods
- People producing lactase reproduce
- And pass on gene / allele
- Allele frequency increases
Q: Bats are the only mammals that can truly fly. Many species of bat hunt flying insects at night. Both are able to use sound waves (echolocation) in order to help them find their prey in the dark.
Suggest how the ability to use echolocation may have evolved from an ancestor that did not have that ability. (7 MARKS)
- Natural / directional selection mutation
- Mutation is random
- Selection pressure is lack of / competition for food
- Individuals with mutations survive
- Echolocation genes / mutations passed on to next generation
- Over many generations frequency of echolocation / allele / characteristic increases
Q: North Ronaldsay sheep are listed as ‘endangered’ by the Rare Breeds Survival Trust. These sheep were raised on a small Scottish Island where they were kept along the seashore for most of the year. Teh sheep developed an unusual metabolism that allowed them to survive by eating seaweed. They are, however, susceptible to copper poisoning when fed on grass.
1. State two essential steps that must have occurred for a breed to develop a distinctive metabolism, such as the ability to eat mainly seaweed. (2 MARKS)
2. Suggest what particular problems mke the North Ronaldsay breed one of the most endangered sheep breeds in the United Kingdom. (2 MARKS)
1. - Mutation
- Selection / selection pressure / selective advantage
2. - Small population / gene pool
- Inbreeding / genetic drift OR unusual diet / cannot eat grass / must eat seaweed / may not be commercial viable / expensive to keep
Q: The lava cactus, Brachycereus nesioticus, is found only in the Galapagos Islands. It speciated rapidly from a very few individuals of a parent species, perhaps only two. These individuals were carried on
currents from the mainland of South America. There is a gene that enables the mainland Brachycereus species to obtain water from damp mists in the atmosphere:
• let Q be the normal allele, allowing the cactus to obtain water from damp mists
• let q be a rare recessive allele that, when homozygous, could allow the cactus to obtain water from salty sea spray.
B. nesioticus colonises bare rock at the edge of the Galapagos Islands. Explain how individuals homozygous for the q allele would soon come to dominate the gene pool. (7 MARKS)
- (island edges / cacti) subject to sea/salt spray
- qq (genotype) confers ability to obtain water from salt spray
- (gives) selective advantage
- (individuals with qq genotype) survive / reproduce
allele / q frequency increases
- directional selection
- geographic isolation / barrier/(means) no new alleles coming in
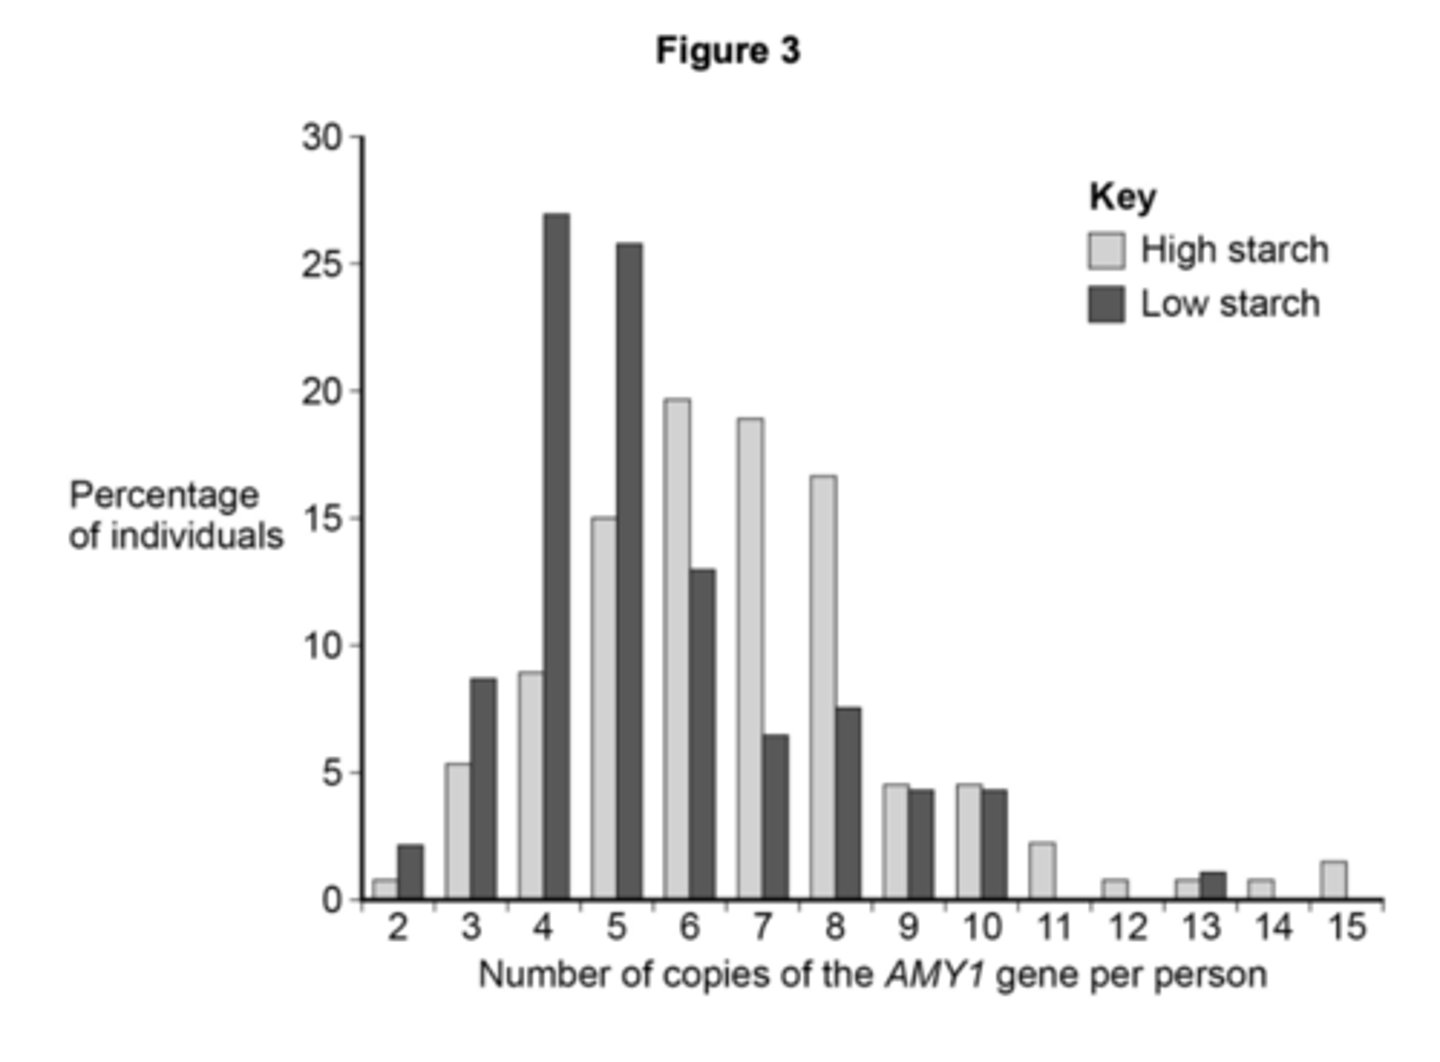
EQ: Most human cells contain two copies of each gene. However, there might be up to 15 copies of the gene for amylase (AMY1). Scientists investigated the number of copies of the AMY1 gene in individual people in two populations. One population had a high-starch diet and the other population had a low-starch diet. Figure 3 shows their results.
1. Describe what their results show. (3 MARKS)
2. Multiple copes of the AMY1 gene is an adaptation to a high-starch diet. Use your knowledge of protein synthesis and enzyme action to explain the advantage of this adaptation. (3 MARKS)
3. Multiple copies of the AMY1 gene is an adaptation to a high-starch diet. Suggest how this evolved through natural selection. (3 MARKS)
1. - Low starch, fewer copies;
- Ranges overlap almost completely; OR Ranges overlap from 2 - 13 copies;
- (surprisingly) very few / 2 or 3% have only 2 copies / are diploid;
- the mode / highest percentage for low starch is 4 copies and for high starch is 6;
- the range / spread is greater with high starch;
2. - More mRNA / more transcription;
- More translation / enzyme;
- So reaction faster;
3. - Mutation(s) produce extra copies of (AMY1) gene;
- Those with more copies / this adaptation/mutation reproduce / survive better on high starch diet;
- And pass on multiple copies / this adaptation/mutation (to offspring);
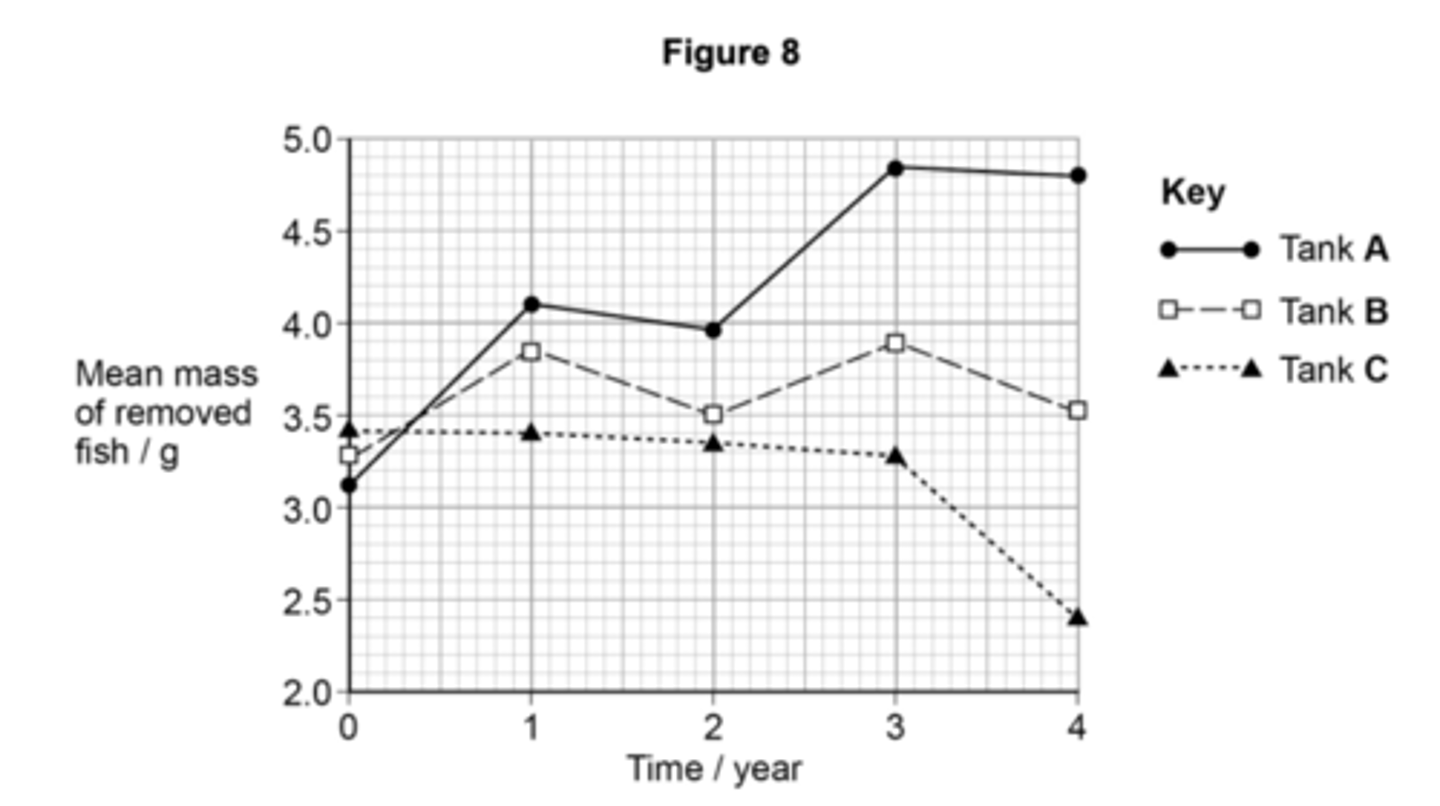
EQ: Scientists investigated changes in the mass of fish from three populations of the same species. The fish they used had a life cycle of one year. The scientists set up three fish tanks, each containing a separate population. Each year the scientists removed all the fish from each tank and determined the mean mass of the fish removed. They then put back 10% of each population in the following way.
Tank A – put back only the largest fish.
Tank B – put back fish at random.
Tank C – put back only the smallest fish.
During each year the fish were left to grow and reproduce. The scientists’ results are shown in Figure 8.
1. What type of selection were the scientists modelling in this investigation by putting back only the largest or only the smallest fish in Tank A and Tank C? Give a reason why. (2 MARKS)
2. Explain the purpose of Tank B (2 MARKS)
3. Calculate the ratio of the mean mass of fish removed from Tank A (on page 21) to the mean mass of fish removed from Tank C (on page 21) at 1 year and at 4 years. How much greater is the ratio at 4 years compared with the ratio at 1 year? (2 MARKS)
4. Sea fishing is regulated in law. The size of the mesh used in some fishing nets is controlled so that small fish can escape but large fish are captured. This regulation is designed to protect populations of wild fish. Using all the information in this question, evaluate whether the scientists’ investigation supports the use of these types of nets in sea fishing. (3 MARKS)
1. Directional; One extreme selected/removed/favoured/ chosen OR One extreme allowed to breed;
2. - As a baseline/control;
- To show effect of no selection
- OR To show what happens in a normal population/naturally
- OR To show effect of/ compare with tank A/tank C;
3. Correct answer for 2 marks
(How much greater) 1.6 to 1.7;;
Accept for 1 mark, 1.2 : 1 and 2 : 1
Accept for 1 mark, 4.1 : 3.4 and 4.8 : 2.4
4. Not supported because
1. (Sea) fishing reduces (mean) mass of fish;
2. Because large fish removed
OR Because small fish escape/put back
OR Because fishing (model) like Tank C;
But
3. Information from (only) one species
OR Sea fishing catches other/different (types of) species;
4. No statistical test;
5. Size of tank may affect fish growth;
6. Fish in tanks are all same age/sea fish not all the same age;
7. No measure of number of fish (removed)/ only measured mean mass
OR No measure of (total) yield of fish
OR No measure of reproductive success of fish;
8. Removal of 90% of population is unlikely to be replicated in the sea fishing;
9.Sea fish do not have life cycle of one year OR Sea fish do not reproduce all at the same time;
An index of diversity describes....
the relationship between the number of different species in a community and the number of individuals in each species.
Define a population.
all the organisms (interbreeding individuals) of the same species in a habitat
Community: all of the population of all of the species in a habitat
Define species diversity.
The number of different species (living in an
area);
Define ecosystem diversity.
range of different habitats within a particular area
Define biodiveristy.
the variety of species in an area e.g. pond / forest / earth
What is a habitat?
The place where an organism lives, e.g. a rocky shore or field.
What is a community.
all the populations of different species in a habitat.
Define species richness.
the number of different species in an area / community
Define index of diversity.
describes the relationship between number of species in a community and the number of individuals of each species.
Describe the effects of farming on biodiversity
- Decreases biodiversity because
- Forests are cleared
- Hedgerows are removed
- Monoculture (herbicide); replace natural meadows with one cereal crop
- Use of pesticides, herbicides and inorganic fertilisers
- Crops better competitors for resources eg. light / nutrients
SO:
- Fewer species of plants
- Fewer species of insect
- Fewer food sources for other species
- Fewer habitats + niches
Describe conservation of biodiversity.
- Get farmers to conserve biodiversity → eg plant more hedgerows
- Protect species by law
- Restrict urban development in important / biodiverse areas
Some conservation techniques can be applied that increase biodiversity without unduly raising food costs or lowering yields, for example...
- Use crop rotation of nitrogen fixing crops instead of fertilisers
- Maintain existing hedgerows and plant new hedges instead of using fences
- Reduce the use of pesticides
What are the 3 components of biodiveristy?
1. Species diversity - the number of different species and the number of individuals of each species within a community
2. Genetic diversity
3. Ecosystem diversity
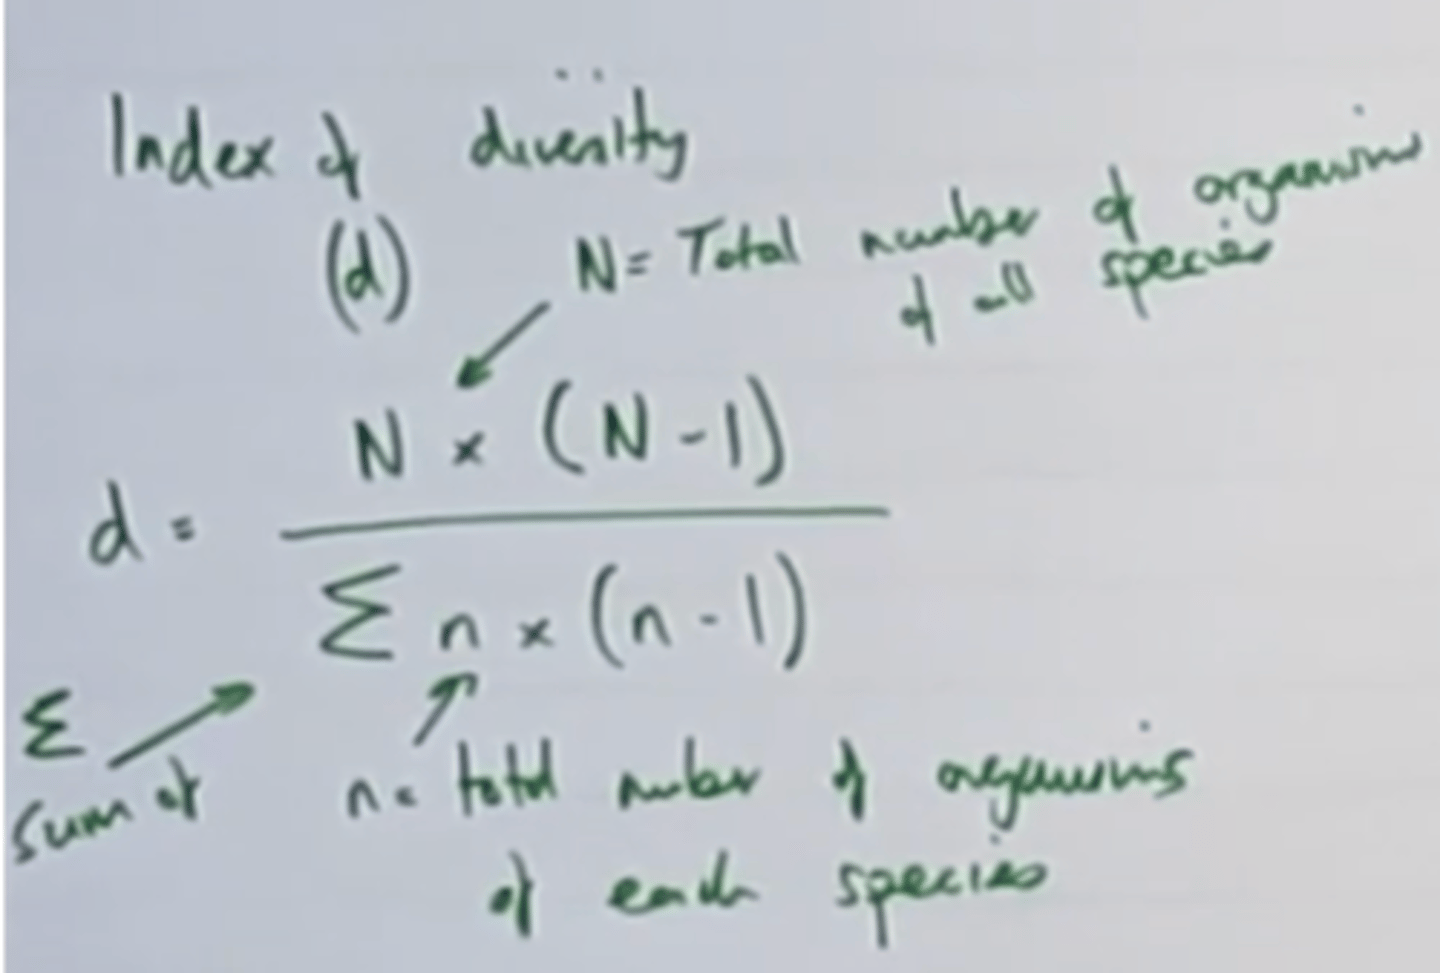
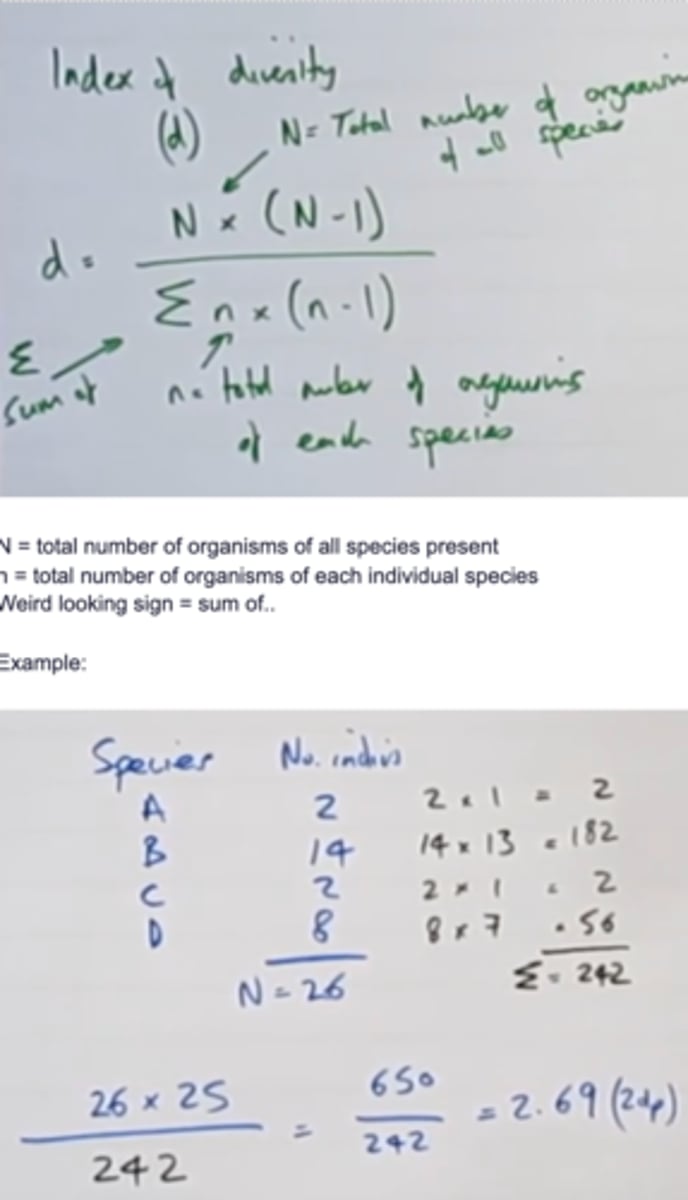
What is the equation for index of diveristy?
N = total number of organisms of all species present
n = total number of organisms of each individual species
Weird looking sign = sum of..
Calculate the index of diversity in the following figure.
Look at image.
Describe the aspects of index of diversity.
- The greater the species richness and species evenness, the higher the number
- The lowest possible value of D is 1. The larger the value of D, the greater the diversity.
- Index of diversity is a more useful measure of species diversity than species of richness
- As well as measuring the number of species, it also measured the number of individuals in a species (different proportions of species)
- So takes account for the fact that some species may be present in low / high numbers
Q: Farmers clear tropical forest and grow crops instead. Explain how this causes the diversity of insects in the area to decrease. (3 MARKS)
- Less variety of plants / lower diversity of plants (could now be monoculture)
- Fewer habitats / niches
- Less variety of food sources
- Aspect of agriculture kills insects e.g. pesticides
Q: The demand for increased food production has led to areas of health being used to grow wheat. Explain the effect of this on (i) the species diversity of plants (2 MARKS) and (ii) the species diversity of animals (2 MARKS)
(i)
- Reduced as one species grown / other species removed
- Use of herbicides / weeding / ploughing
- Wheat (better) competitor for named factor e.g. light / nutrients
(ii)
- (reduced) as less variety of food sources
- (reduced) as fewer habitats / niches
- Reduced by pesticides / chemicals
Q: Explain why it is more useful to calculate the index of diversity than to record just the number of species present in an investigation. (2 MARKS)
- Measures number of individuals and number of species
- Some species only present in small numbers
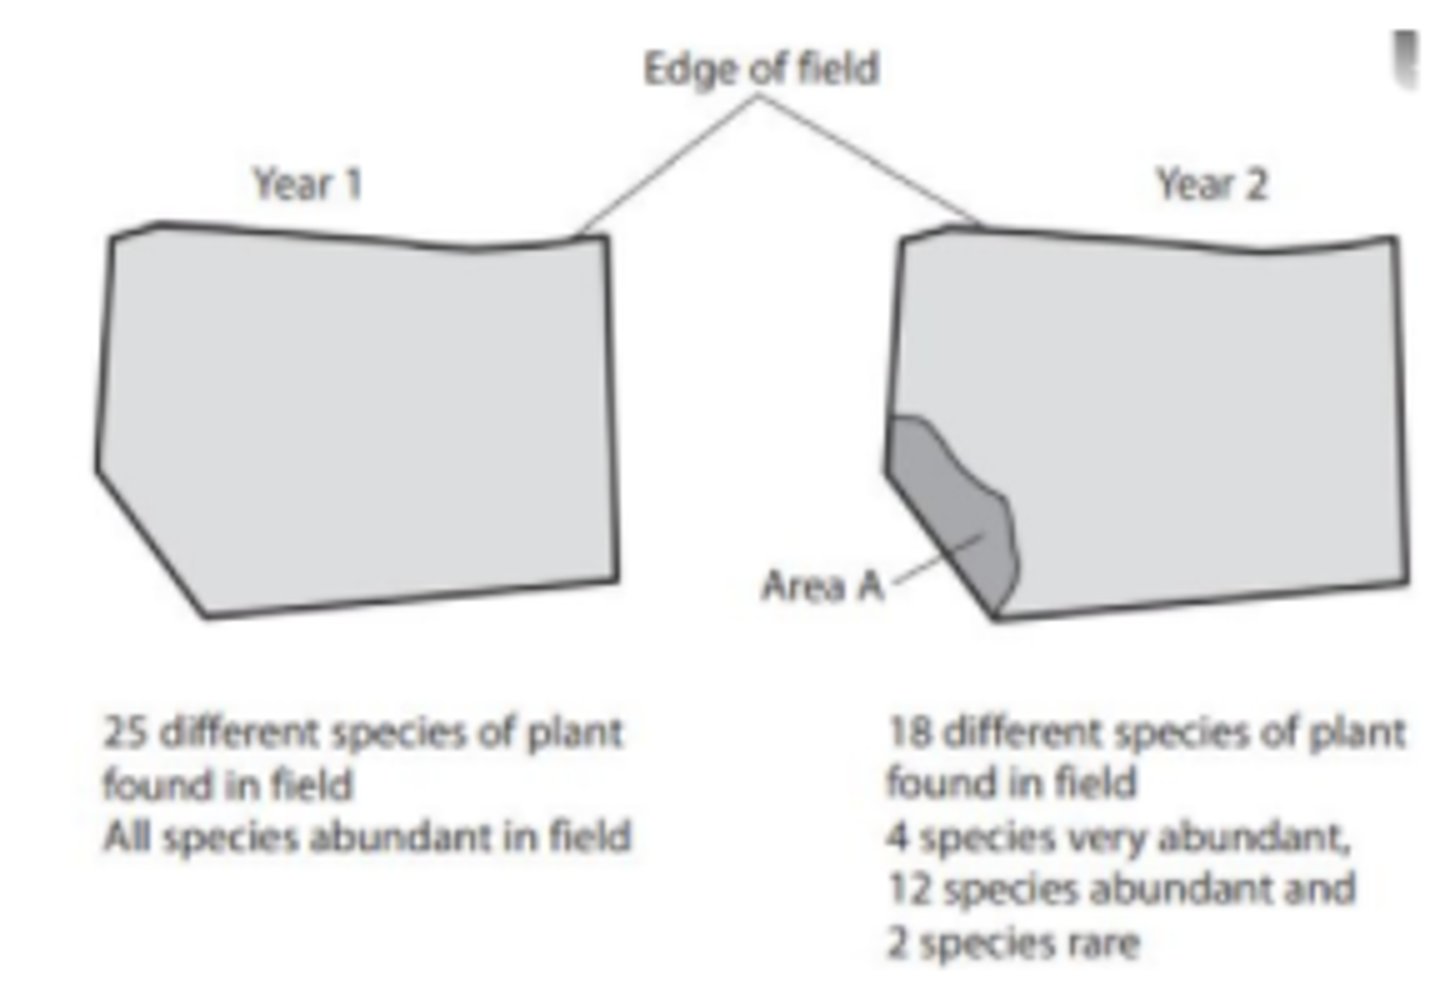
Q: A student studied one field in two different years. She recorded some information, shown in the diagram. Using the information in the diagram, suggest in which year the species richness was greater. Give a reason for your answer.
- Year 1
- More species present in year 1 / greater variety of species
Q: Outline the implications for a habitat if the index of diversity is low. (3 MARKS)
- Habitat dominated by one / few species
- Change in one species likely to affect whole habitat
- Community / habitat is unstable / not able to withstand change
Q: What are two measurements would ecologists need to abstain to calculate the index of diversity of birds on an island? (2 MARKS)
- Number of individuals / birds of each species
- Total number of individuals / birds of all species
Q: Before any major development can take place, an environmental impact assessment (EIA) needs to be carried out. Suggest the implications of a high index of diversity on planning decisions. (2 MARKS)
- Many species present / high biodiversity
- So should not be developed / should be conserved
Q: What is the difference between the terms ‘population’ and ‘community’? (1 MARK)
- Population - all the organisms of one species in a habitat
- Community - all of the population of all the species in a habitat
Q: The European Union gives grants to farmers to replant hedges previously removed. Explain how replanting hedges might affect the index diversity for birds found on farms. (2 MARKS)
- Increase
- More habitats / niches / variety of food sources
Q: The demand for increased food production has led to areas of heath being used to grow wheat. Explain the effect of this on:
1. The species diversity of plants. (2 MARKS)
2. The species diversity of animals. (2 MARKS)
1. - Reduced as one crop / species grown / other species removed
- Use of herbicides / weeding / ploughing OR Wheat (better) competitor for named factor e.g. light / nutrients
2. - Reduced as less variety of food sources OR reduced by pesticides / chemicals
- Reduced as fewer habitats / niches
Q: Farmers clear tropical forest and grow crops instead. Explain how this causes the diversity of insects in the area to decrease. (4 MARKS)
- Lower diversity of plants / few species of plants / less variety of plants / few plant layers OR aspect of agriculture (killing insects)
- Few sources / types of food / feeding sites
- Fewer habitats / niches
- Fewer (species of) herbivore so few (species of) carnivores
Q: Ecologists determined the index of diversity of lizards in an oil palm plantation next to a woodland area. They found fewer species of plant in the oil plantation. Lizards feed on plants and insects. Explain why fewer species of plant would lead to fewer species of lizard in the oil palm plantation. (3 MARKS)
- Fewer habitats / niches
- Lower diversity of insects / however insect types
- So fewer food sources / less variety of food
Q: Suggest five possible reasons for conserving woodlands. (5 MARKS)
- Conserving / protecting habitats / niches OR conserving / protecting (endangered) species / maintains / increases biodiversity
- Reduces global warming / greenhouse effect / climate change Or remove / take up carbon dioxide
- Source of medicines / chemicals / wood
- Reduced erosion / eutrophication
- Tourism / aesthetics / named recreational activity
EQ: A student investigated the distribution of plants in a heathland. Table 2 shows the number of plants he found in a sample area of 1 m2
1. What is the species richness of this sample? (1 MARK)
2. Calculate the index of diversity of this sample. Show your working. Use the following formula to calculate the index of diversity. (2 MARKS)
3. Suggest how this student would obtain data to give a more precise value for the index of diversity of this habitat. (2 MARKS)
1. 4;
2. 2.68(6);
3. - Take more samples and find mean;
- Method for randomised samples described;

EQ: Scientists investigated the effect of different types of animal farming on the diversity and number of dung beetles. They determined the number of dung beetle species and their total number on intensive (I), rough grazing (R) and organic (O) farms. Figure 4 and Figure 5 show some of their results.
1. What is the mean species richness for dung beetles on the rough grazing farms? (1 MARK)
2. In addition to the information provided in Figures 4 and 5, what other measurement is required to calculate an index of diversity for dung beetles? (1 MARK)
3. Explain what the standard deviations suggest about the difference in mean total number of dung beetles between the different types of farm. (2 MARKS)
4. The scientists placed traps to collect the dung beetles at sites chosen at random. Explain the importance of the sites being chosen at random. (1 MARK)
5. On the intensive farms, the farmers had removed hedges to increase land for grazing. This resulted in a decrease in the diversity of birds on these farms. Explain why the removal of hedges caused a decrease in the diversity of birds. (3 MARKS)
1. 14;
2. Number (of individuals) in each species (of dung beetle);
3. - No overlap in standard deviations;
- (Difference in mean total) significant/is not due to chance/is real;
4. No bias;
5. - Removes species/types of plant/insect;
- Fewer food sources;
- Fewer habitats/niches;
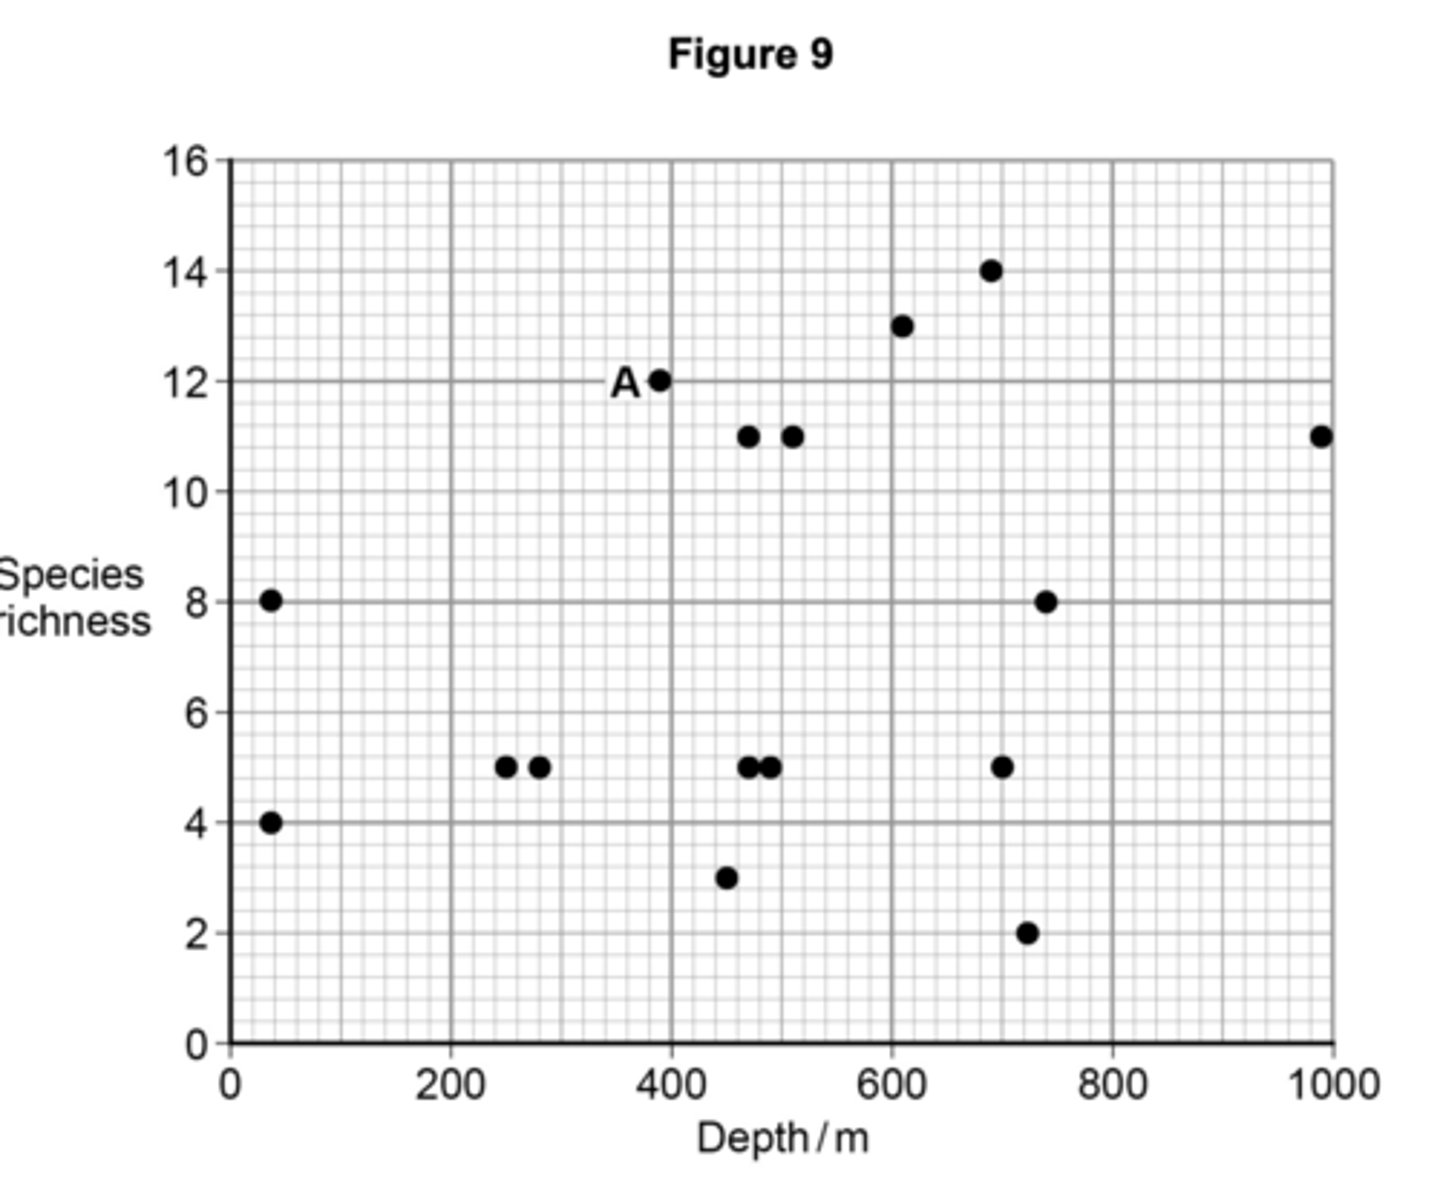
EQ: Scientists investigated the species richness of fish caught at various depths in the Pacific Ocean close to the western coast of Chile. Figure 9 shows the scientists’ results. 68% of all the fish caught in this investigation came from sample A.
1. What is the modal value of species richness? (1 MARK)
2. 68% of all the fish caught in this investigation came from sample A. A student thought this showed that sample A had a greater index of diversity than any of the other samples. It is not possible to draw this conclusion from the given data. Give reasons why. (3 MARKS)
1. 5;
2. - Number of individuals of each species not known;
- Almost all (of sample A / the 68%) could be of the same species;
- Two / other samples have a higher number of species / higher species richness but a lower number of individuals / fish;
- Other samples may have more individuals of each species;
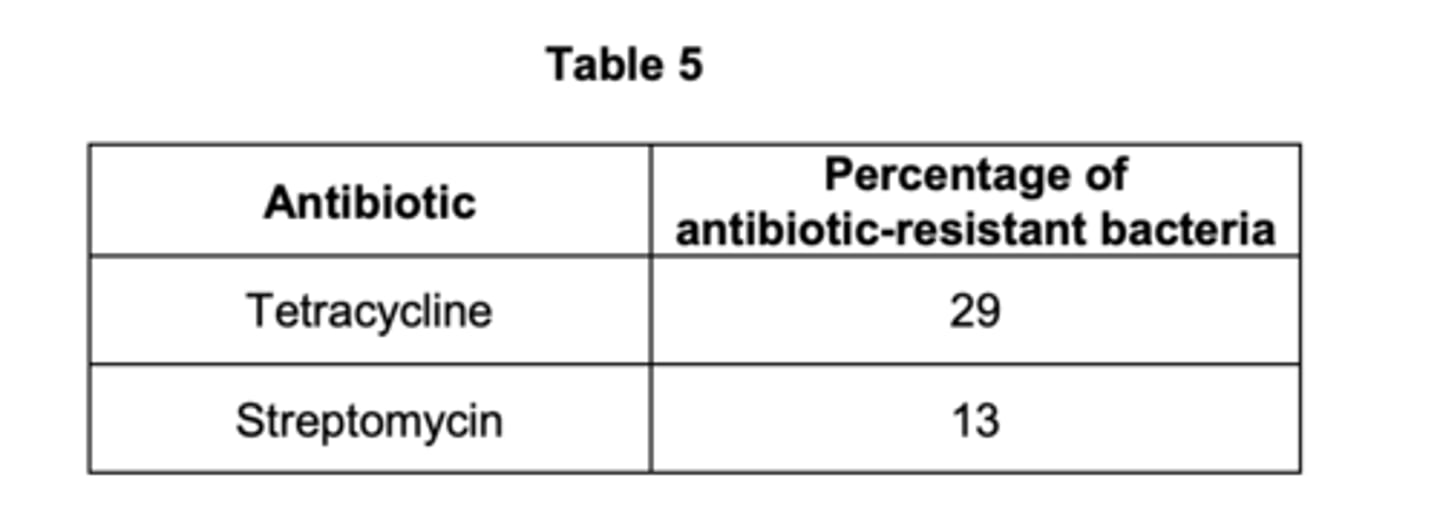
EQ: On some farms, animals are routinely given antibiotics in their food. box Scientists investigated whether these farm animals had antibiotic-resistant bacteria in their intestines. They tested the bacteria for resistance to two antibiotics, tetracycline and streptomycin. Their results are shown in Table 5.
1. Suggest and explain one reason why bacteria resistant to tetracycline are more common than bacteria resistant to streptomycin in these farm animals. (2 MARKS)
2. In recent years, these farm animals have not been given tetracycline in their food. Despite this, the percentage of bacteria resistant to tetracycline has remained constant. Suggest one reason why. (1 MARK)
1. 1. Tetracycline used more often / in higher doses;
2. Resistant bacteria more likely to (survive and reproduce and) pass on allele/gene for (tetracycline) resistance;
OR 3. More / higher frequency of mutations (for tetracycline resistance);
4. (so) gene passed on to more bacteria;
OR 5. Tetracycline used over longer time period;
6. More time for (chance) mutation to occur / for selection to occur;
2. No selection against resistant bacteria / resistance gene/allele;
OR Bacteria pass on (resistance) gene / allele when they reproduce;
OR Bacteria resistant to tetracycline are passed on from one generation of farm animals to the next (probably via faeces);
OR Environment does not change, so stabilising selection occurs;
Q: The spotted owl is a bird. Numbers of spotted owls have decreased over the past 50 years. Explain how this decrease may affect genetic diversity. (2 MARKS)
- Reduced (genetic diversity);
- As fewer different / varied alleles / genes / reduced gene pool;
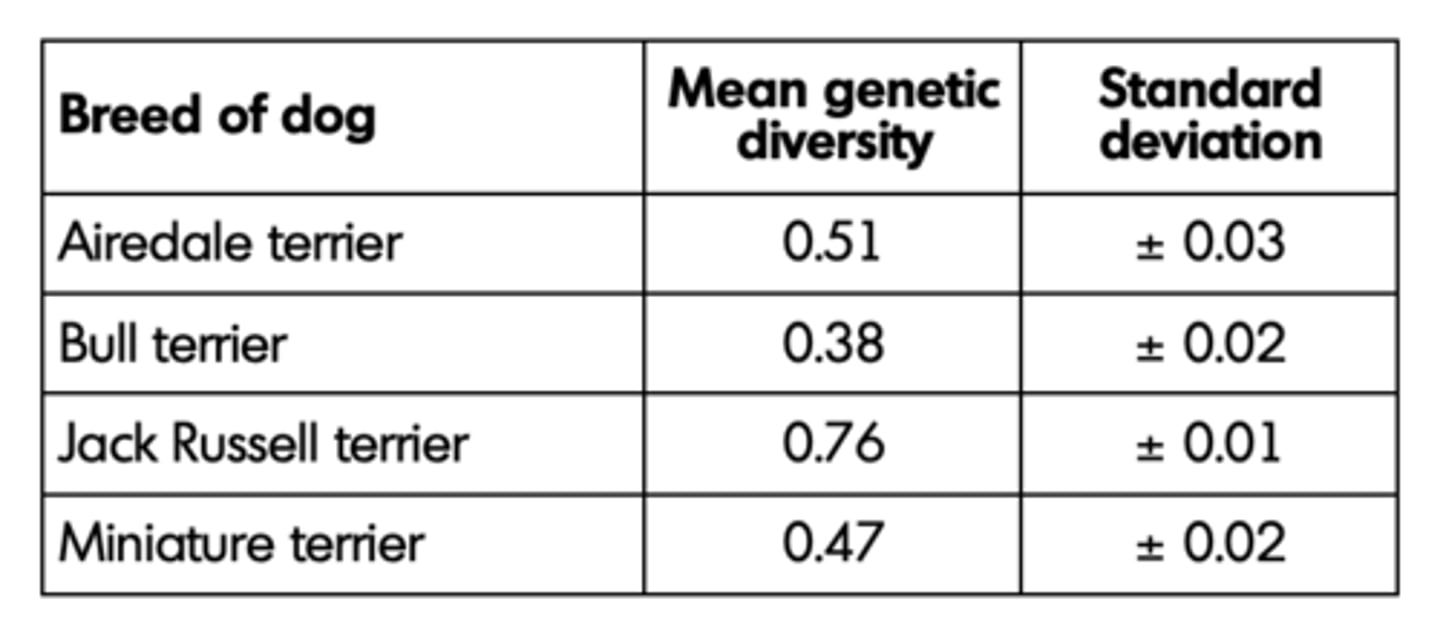
Q: A geneticist investigated genetic diversity in four different breeds of dog. She compared DNA base sequences of the same genes from a large number of dogs from each breed. The geneticist calculated the mean genetic diversity for each breed of dog. The value of this mean was between 0 and 1.
• A mean value of 1 shows maximum genetic diversity.
• A mean value of 0 shows no genetic diversity.
Her results are shown in the table
1. What do these data show about the differences in genetic diversity between these breeds of dog? (3 MARKS)
2. Miniature terriers were first bred from bull terriers in the 19th century. Suggest one explanation for the observed difference in genetic diversity between miniature terriers and bull terriers. (2 MARKS)
1. - Jack Russell (genetic) diversity is (significantly) greatest;
- Bull terrier (genetic) diversity is (significantly) smallest / is most inbred;
- Miniature terrier and Airedale terriers are similar;
- Standard deviations do not overlap / do overlap with correct ref to significance;
2. - (Bull terrier) breeding has included a genetic bottleneck/ small population/more inbreeding/ greater selection (pressure);
- Reduced number of different alleles/size of gene pool;
OR
- Miniature (terrier) breeding has included more outbreeding/less selection (pressure);
- Increased number of different alleles/larger gene pool/more variety of alleles;
Q: Describe and explain how selection will have affected the genetic diversity of sugar beet. (2 MARKS)
1. (Diversity) reduced / fewer different alleles / less variation / smaller gene pool;
2. As alleles have been chosen / rejected;
EQ: Explain why it is more useful to calculate an index of diversity than to record species richness. (2 MARKS)
1. (Index of diversity also) measures abundance / number / population (size) of each species;
2. (So useful because) may be many of some species
OR (So useful because) may be few of other species;
EQ: On the intensive farms, the farmers had removed hedges to increase land for grazing. This resulted in a decrease in the diversity of birds on these farms. Explain why the removal of hedges caused a decrease in the diversity of birds. (3 MARKS)
1. Removes species/types of plant/insect;
2. Fewer food sources;
3. Fewer habitats/niches;
Q: The index of diversity of the insects was higher in the hedge than in the barley field. Suggest why. (3 MARKS)
1. More plant species;
2. More food sources / variety of food;
3. More habitats / niches;
Q: Species richness and an index of diversity can be used to measure biodiversity within a community.
What is the difference between these two measures of biodiversity? (1 MARK)
Species richness measures only number of (different) species / does not measure number of individuals.
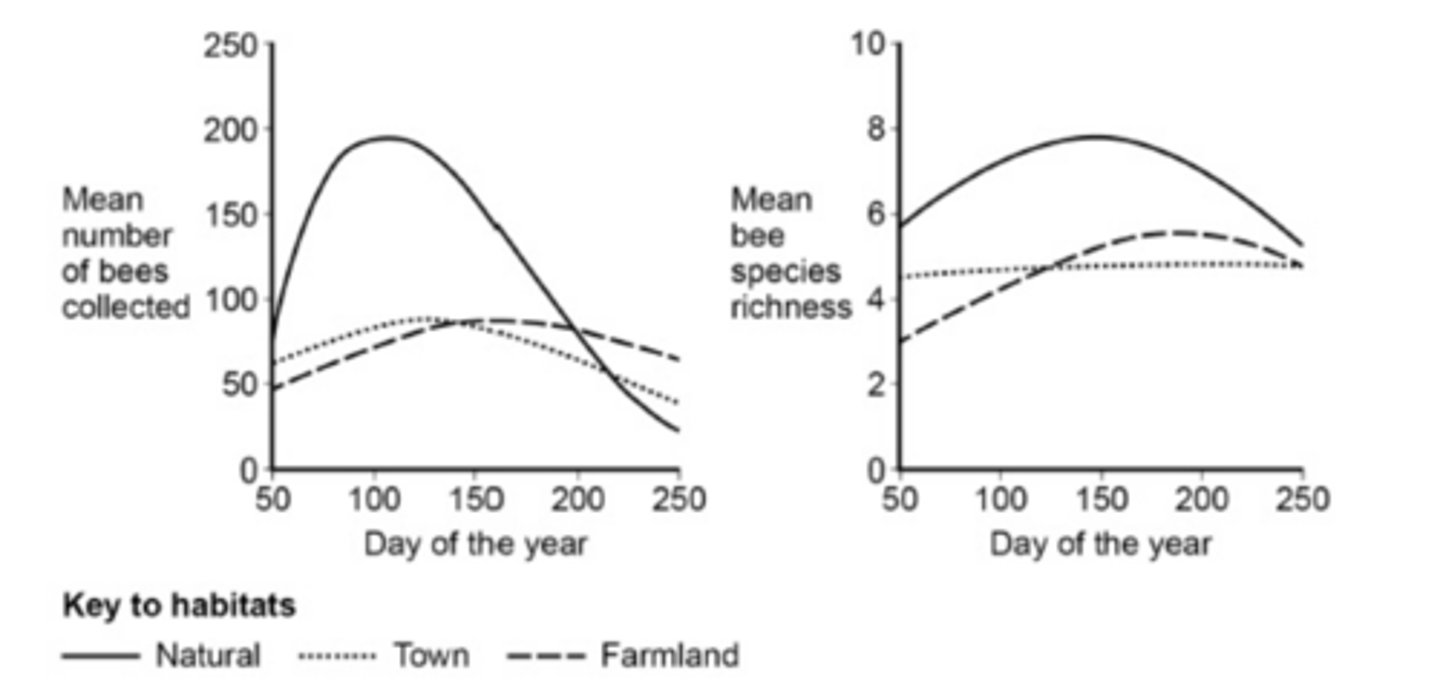
Q: Bees are flying insects that feed on nectar made in flowers. There are many different species of bee. Scientists investigated how biodiversity of bees varied in three different habitats during a year. They collected bees from eight sites of each habitat four times per year for three years. The scientists’ results are shown below in the graphs in the form they presented them.
From the data in the graphs, a student made the following conclusions.
1. The natural habitat is most favourable for bees.
2. The town is the least favourable for bees.
Do the data in the graphs support these conclusions? Explain your answer. (4 MARKS)
Yes, natural best, because
1. Peak of (mean) bee numbers in natural habitat is highest;
2. The (mean) number of bees was higher in the natural habitat until day 200;
3. (Mean) species richness in natural habitat higher at all times;
No, natural not best, because
4. Lowest (mean) number of bees after day 220; 4
Yes, town worst, because
5. Peak of species richness higher in both natural and farmland
OR Species richness lowest in town from day 125;
No, town not worst, because
(Mean) species richness is lower in farmland until day 125;
7. Similar (mean) number of bees to farmland;
OR (Mean) number of bees lower in farmland until day 140;
General, no, because
8. Index of diversity of bees not measured
OR The number of bees of each species is not known;

Q: Bees are flying insects that feed on nectar made in flowers. There are many different species of bee. Scientists investigated how biodiversity of bees varied in three different habitats during a year. They collected bees from eight sites of each habitat four times per year for three years. The scientists’ results are shown below in the graphs in the form they presented them.
The scientists collected bees using a method that was ethical and allowed them to identify accurately the species to which each belonged. In each case, suggest one consideration the scientists had taken into account to make sure their method
1. was ethical.
2. allowed them to identify accurately the species to which each belonged
(2 MARKS)
1. Must not harm the bees
OR Must allow the bee to be released unchanged;
2. Must allow close examination
OR Use a key (to identify the species);
Q: Bees are flying insects that feed on nectar made in flowers. There are many different species of bee. Scientists investigated how biodiversity of bees varied in three different habitats during a year. They collected bees from eight sites of each habitat four times per year for three years. The scientists’ results are shown below in the graphs in the form they presented them.
Suggest and explain two ways in which the scientists could have improved the method used for data collection in this investigation. (2 MARKS)
1. Collect at more times of the year so more points on graph/better line (of best fit) on graph;
2. Counted number of individuals in each species so that they could calculate index of diversity;
3. Collected from more sites/more years to increase accuracy of (mean) data;

Q: Bees are flying insects that feed on nectar made in flowers. There are many different species of bee. Scientists investigated how biodiversity of bees varied in three different habitats during a year. They collected bees from eight sites of each habitat four times per year for three years. The scientists’ results are shown below in the graphs in the form they presented them.
Three of the bee species collected in the farmland areas were Peponapis pruinosa, Andrena chlorogaster and Andrena piperi.
What do these names suggest about the evolutionary relationships between these bee species? Explain your answer. (2 MARKS)
1. A. chlorogaster and A. piperi are more closely related (to each other than to P. pruinosa);
2. Because they are in the same genus;
Q: Give two pieces of information needed to calculate an index of diversity for a community. (2 MARKS)
1. Number of (organisms of) each species;
2. Total number of organisms (of all species) / Total number of species;
Q: A scientist investigated the effect sewage entering a river had on the distribution of organisms living in the river. Where sewage entered the river, he found a high density of organisms but a low index of diversity.
1. Suggest how sewage entering the river could explain the scientist’s findings. (2 MARKS)
A second scientist repeated the investigation of the first scientist at the same place. The second scientist obtained a high index of diversity.
2. Explain how the second set of results affects the ability of the scientists to make any conclusions about the effect of sewage on the index of diversity. (2 MARKS)
3. Suggest the additional steps that should be taken by the scientists before they are able to make any conclusions about the effect of sewage entering this river. (1 MARK)
1. - Described effect of sewage (eg oxygen depletion/is toxic/kills);
- Prevents some/many species colonising/ reproducing/remaining;
- Sewage is food source for (individuals of) some/a few/species;
- (So) increase only in their numbers;
2. - Results are not repeatable / are not representative / unreliable / conflict / contradict;
- Can't make any conclusions;
3. Do repeats to find a pattern/distribution/mean (of index of diversity);
Q: Outline a method the ecologists could have used to determine the plant species richness at one site. (3 MARKS)
1. A method of selecting sampling sites at random;
2. Use of quadrat;
3. Identify (plant) species (at site / in each quadrat)
OR Count number of (different plant) species (at site / in each quadrat);
Q: The golf course was surrounded by undeveloped grassland from which it had been produced. The golf course had
• some areas of very short grass which was cut frequently
• some areas of longer grass which was cut less frequently
• some areas of long grass and shrubs which were never cut.
The index of diversity for the insects on the golf course was higher than that for the surrounding undeveloped grassland.
Explain the effect of developing this golf course on the index of diversity of insects. (3 MARKS)
1. Increase in variety of plants / shrubs / grass;
2. More habitats / niches;
3. Greater variety of food sources / more food sources;
Q: Farmers were offered grants by the government to plant hedges around their fields. Explain the effect planting hedges could have on the index of diversity for animals. (2 MARKS)
1. Greater variety of plants;
2. Another habitat / more habitats / places to live / niches / another food source / more food types;
Q: A hedgerow is a line of shrubs and trees bordering a field, together with the herbaceous plants at their base. In the last 50 years farmers have removed many hedgerows.
1. Explain two advantages for a farmer of removing hedgerows. (2 MARKS)
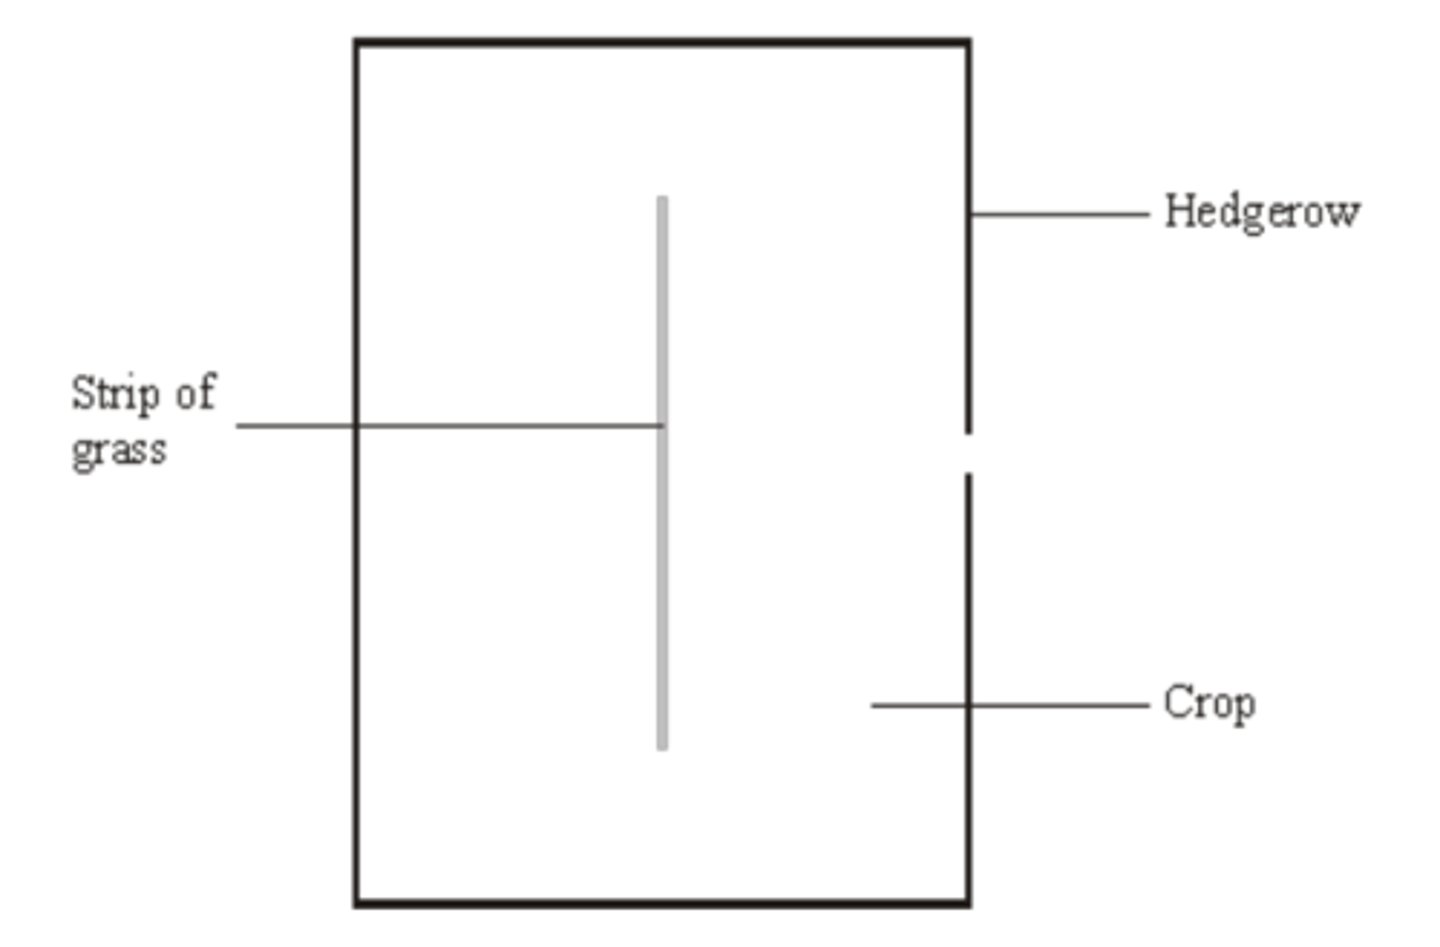
In recent years some hedgerows have been replanted. Ground beetles, which are unable to fly, are predators of crop pests. The beetles overwinter in the shelter of grasses at the base of the hedgerow. In some large fields, a permanent strip of grass is left as shown in the diagram.
2. Suggest and explain the advantage of leaving the strip of grass in the middle of the field. (2 MARKS)
3. Apart from providing a habitat for predators of crop pests, give two biological benefits of replanting hedgerows. (2 MARKS)
1. - source of pests / animals, and effect on crop;
- source of weeds / no longer taking nutrients, hence competition / reduced yield;
- creation of larger fields / leaving room, hence more efficient use of machinery / grow more crops;
- hedgerows have to be maintained, so removal saves time / money;
2. - allows beetles to remain / survive / over winter in the middle of the field / strip of grass;
- effect on distribution, e.g. do not normally reach the centre of the field / can reach all parts;
3. - increases biodiversity;
- source of food for animals;
- habitat / nest for animals;
- reduce need for insecticides / attracts insects away from crop;
- windbreaks / prevent erosion / run-off / leaching;
- migratory corridors;
Q: The ecologists also determined the index of diversity of lizards in an oil palm plantation next to the woodland area. They found fewer species of plant in the oil palm plantation. Lizards feed on plants and insects. Explain why fewer species of plant would lead to fewer species of lizard in the oil palm plantation. (3 MARKS)
(Fewer plant species) − no mark
1. (So) few(er) habitats / niches; I
2. (So) lower diversity of insects / fewer insect species / fewer insect types;
3. (So) fewer food sources / less variety of food.
Q: Ecologists investigated the size of an insect population on a small island. They used a mark-release-recapture method. To mark the insects they used a fluorescent powder. This powder glows bright red when exposed to ultraviolet (UV) light.
1. The ecologists captured insects from a number of sites on the island. Suggest how they decided where to take their samples. (2 MARKS)
2. Suggest the advantage of using the fluorescent powder in this experiment. (2 MARKS)
1. - Draw grid over (map of) area;
- Select squares / coordinates at random.
2. - Only glows brightly with UV, so doesn't make insects more visible;
- So doesn't affect / increase predation;
- OR Glows brightly with UV marking visible;
- So makes it easy to pick out labelled insects.
Q: A herbicide is a chemical used to kill weeds. Ecologists investigated the effect of a herbicide on crop yield and the diversity of insects. They sprayed different fields with the same volume of different concentrations of the herbicide. At harvest, the ecologists determined the mean crop yield and the mean index of diversity of insects for fields that had received the same concentration of the herbicide. The figure below shows their results.
Suggest an explanation for the relationship between the concentration of herbicide and the mean crop yield. (2 MARKS)
1. (More) weeds killed so more crops / plants survive / higher yield / less competition;
2. High concentrations (of herbicide) harm / damage / kill / are toxic to crops / plants;
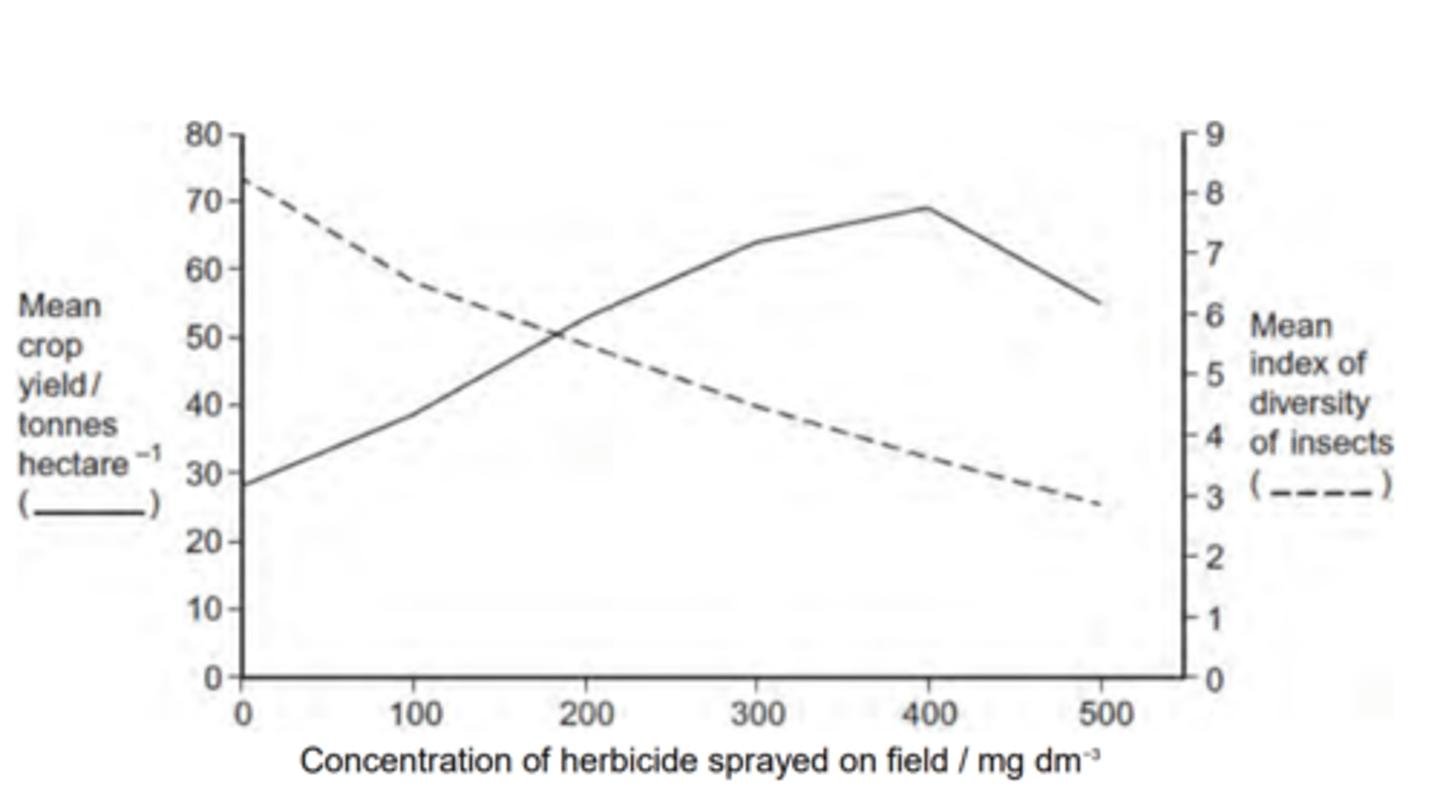
Q: A herbicide is a chemical used to kill weeds. Ecologists investigated the effect of a herbicide on crop yield and the diversity of insects. They sprayed different fields with the same volume of different concentrations of the herbicide. At harvest, the ecologists determined the mean crop yield and the mean index of diversity of insects for fields that had received the same concentration of the herbicide. The figure below shows their results.
Explain the relationship between the concentration of herbicide and the mean index of diversity of insects. (3 MARKS)
1. Reduced plant diversity / fewer plant species / fewer varieties of plant;
2. Fewer habitats / niches;
3. Fewer food sources / varieties of food;

Q: After the forest was cleared the species diversity of insects in the area decreased. Explain why. (3 MARKS)
1. Decrease in variety of plants / fewer plant species;
2. Neutral: fewer homes / less shelter
3. Decrease in variety of food / fewer food sources;
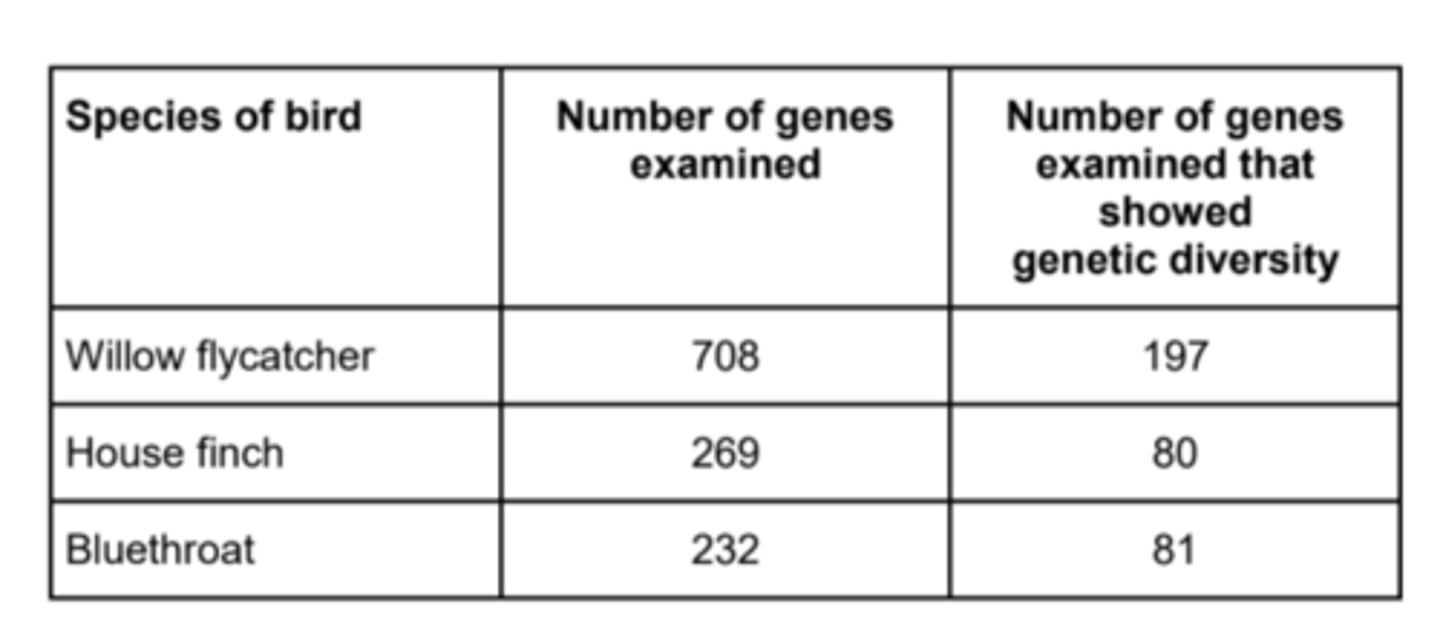
Q: A group of scientists investigated genetic diversity in different species of bird. For each species, the scientists:
• collected feathers from a large number of birds
• extracted DNA from cells attached to each feather
• analysed the samples of DNA to find genetic diversity.
Table 2 summarises their results.
The scientists concluded that the bluethroat showed greater genetic diversity than the willow flycatcher. Explain why they reached this conclusion. Use calculations to support your answer. (2 MARKS)
1. Has greater proportion of genes / percentage of genes showing diversity;
2. Percentage is 35% compared with 28% / proportion is 0.35 compared with 0.28.
Q: Explain why a catastrophic event that causes a sharp decline in numbers of a population is dangerous for the future of a species, even when the species is not totally wiped out. (2 MARKS)
- The decline narrows/reduces the gene pool / causes the gene pool to shrink/get smaller;
[1 mark]
- The population will become vulnerable to / be less able to adapt to further environmental/biotic changes; [1 mark]
Q: State one consequence of there being NO mixing between different populations of the same species. (1 MARK)
- Inbreeding / an accumulation of harmful alleles; [1 mark]
- Small gene pool / range of alleles / low genetic diversity; [1 mark]
Q: State whether the development of antibiotic resistance in bacteria is an example of directional selection or stabilising selection. Give a reason for your answer. (2 MARKS)
- Directional selection; [1 mark]
- The bacteria population's phenotype changes over time (to better ensure survival and reproduction); [1 mark]
Q: Suggest a method for how the scientist calculated the mean genetic diversity for the different breeds of cat. (2 MARKS)
- They obtained/took DNA samples from a large number of cats from each breed;
- (Then they) compared the DNA base sequences of the same genes;
- And used the results to calculate the mean (genetic diversity);
Q: Describe and explain how artificial selection will have impacted the genetic diversity of the domestic carrot plant. (2 MARKS)
- (The genetic diversity will have) reduced OR there will be less different alleles / variation
OR there will be a smaller gene pool; [1 mark]
- (Because through artificial selection) some alleles have been chosen/rejected/lost;
[1 mark]
Q: The percentage of fish with allele C in the open is different from the percentage of fish with allele C in the cave. Suggest a reason for this difference. (4 MARKS)
- The Founder Effect (has caused this difference);
- A small number of fish originally went into the cave;
- All/a high proportion of the fish (that entered the cave) had allele C;
- The fish in the cave reproduced to increase the frequency of allele C;
Q: Describe how a population of Staphylococcus Aureus bacteria can become resistant to antibiotics. (4 MARKS)
- Genetic variation arises by (spontaneous/random) mutation;
- This mutation is beneficial/advantageous BECAUSE it gives the bacteria resistance to an antibiotic
- Resistant bacteria are not killed by the antibiotic / are more likely to survive;
- Surviving bacteria reproduce (by binary fission), passing on the advantageous/antibiotic resistant allele to the next generation;
- The frequency of the (advantageous) allele increases over subsequent generations;
Q: Lactose is a sugar that is found in milk and dairy products. The enzyme lactase hyrdolyses this sugar in the ileum, making it an important enzyme to newborn mammals who rely entirely on lactose based food sources. Most mammals stop producing lactase as they get older as their diet becomes more varied. An exception to this are humans, they are able to produce lactase as adults, known as lactase persistence. This ability to produce lactase is controlled by a dominant allele.
It is thought that the farming of cattle by early humans could have led to a rapid increase in the frequency of the allele for lactose persistence. Describe how this could have occurred. (3 MARKS)
- Milk is a source of glucose/galactose/protein/calcium;
- Lactose persistence had a selective advantage OR those individuals that could hydrolyse lactose would be more likely to survive and pass on the allele; [1 mark]
- Over time the frequency of the dominant allele increased within human populations;
- Directional selection occurs; [1 mark]
Q: Some plants can be genetically engineered to have resistance to mildew, for example by introducing genes that produce a chemical that can destroy the mildew fungus. However, mildew can overcome this resistance over time. Explain how the mildew fungus adapts to overcome this chemical resistance. (3 MARKS)
- The chemical produced by plants (in defence) is a selection pressure; [1 mark]
- A random mutation in the mildew fungus causes them to be unaffected by the plant's chemical defences / inhibits the chemical substances produced by plants; [1 mark]
- The fungi that have the advantageous allele are more likely to survive and reproduce;
[1 mark]
- The frequency of the advantageous (resistance) allele increases over time; [1 mark]