Structural and functional annotations
1/23
There's no tags or description
Looks like no tags are added yet.
Name | Mastery | Learn | Test | Matching | Spaced | Call with Kai |
|---|
No analytics yet
Send a link to your students to track their progress
24 Terms
in-paralogs
In-paralogs are genes within the same species that arose from a duplication event after a speciation event and are more similar to each other than to their orthologs in another species.
Reciprocal Best Hits (RBH)
Orthologous genes
pair of homologous genes that
have emerged through a speciation event. They are more likely to indicate conserved function than paralogs.
Paralogous genes
pair of homologous genes that have emerged through a duplication event.
Multiple sequence alignment (MSA)
process of aligning three or more biological sequences (DNA, RNA, or protein) to identify regions of similarity. These similarities may indicate functional, structural, or evolutionary relationships among the sequences. They are used to look at orthologues obtained from different species to study phylogeny.
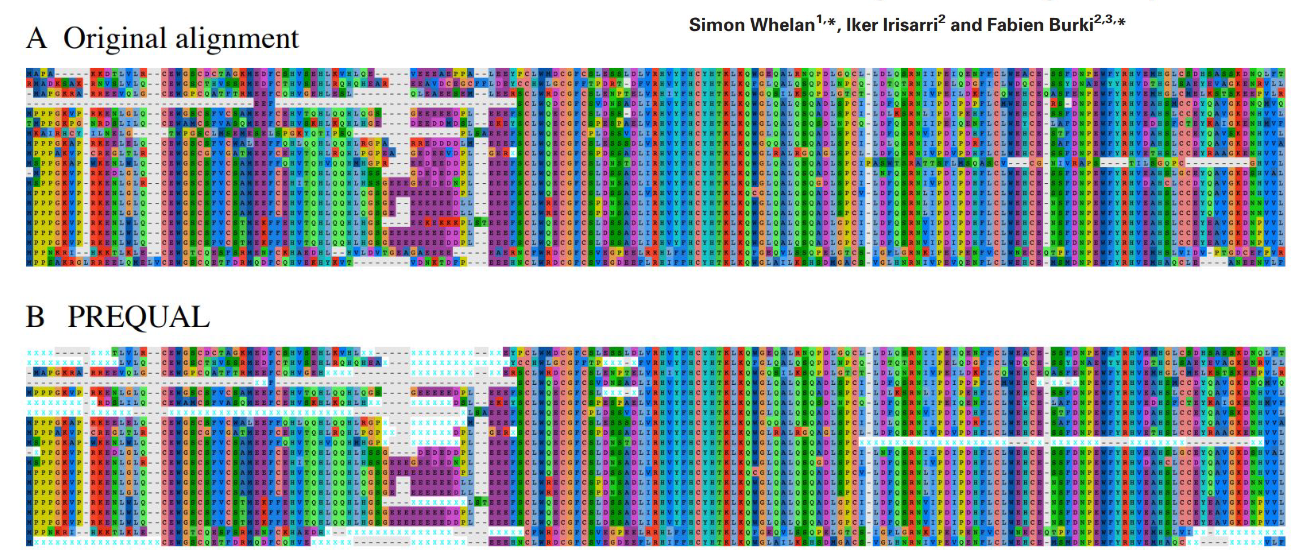
PREQUAL
Software tool that can detect non homologous charactersi/regions n sets of unaligned homologe sequences. They remove these chrarcters/regions to prevent false positives
TrimAl
Trimming tool whith compareable results to unfiltered data, but with much faster runtime. But still better to not trim if possible
Assumptions of nucleotide substitution models
● Independent evolution of sites (Markov property);
● Substitution rates do not change over time (homogeneity);
● Equilibrium of base frequencies (stationary); (frequencies of nucleotiddes stay the same)
● Time reversible (rate of i→j is equal to the rate of j→i).
Q-matrix
summarize substitution rates and give information about the probability of the substitution of a nucleotide by another.
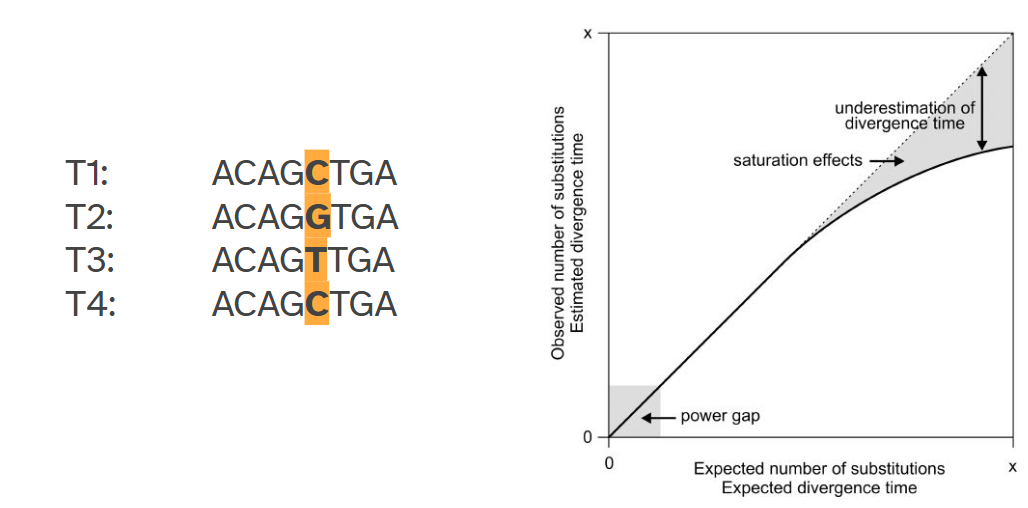
Sequence saturation
observed and real differences are not the same. It would seem there would be no substitutions between time1 and time4 if you wouldn’t have access to t2 and t3.
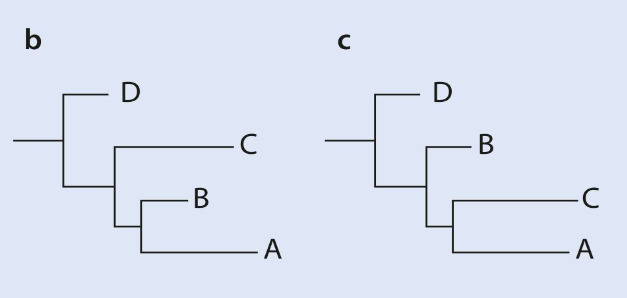
Long branch attraction
With neighbourg joining Long branches attract each other and cluster together despite not being the most closely related. This is because of sequence saturation. B is the real tree while c is the one you get with neighbour joining.
neighbour joining
maximum likelihood
formula for PSSM score
(Actual count of base X at position i + sq(Number of aligned sequences)*frquency(x)) / Number of aligned sequences + sq(Number of aligned sequences)
meaning of PSSM score
the relative likelihood of observing a specific nucleotide (A, T, C, or G) at a specific position in an aligned set of sequences. In other words (score form 0 to 1)
Problem of transposable elements in gene annotation
they often contain open reading frames (ORFs) that resemble real genes, leading to false positives. These ORFs can be mistakenly identified as functional genes by annotation tools, causing errors in gene predictions. Additionally, the repetitive nature of TEs can interfere with identifying true gene structures, making the overall genome annotation more challenging. Identified repeat regions are ofton masked bc of this reason
Why is it difficult to form a biological valid gene with exon assembly
There are many different combination options due to:
Alternative splicing | Real biological variability increases complexity |
Weak signals | Splice sites or exons may be predicted with low confidence |
Close proximity | Nearby predicted exons might be incorrectly joined |
Overlapping genes | Multiple transcripts in the same locus confuse the assembler |
EVidenceModeler (aka EVM)
software that combines ab intio gene predictions and protein
and transcript alignments into weighted consensus gene structures.
Differences between %simiarity and %identity
Identity is the percentage exact matches between sequences while siilarity looks at biochemical similar (leucine is similar to isoleucine)
Homology-Based Functional Annotation
It means using information from known genes to guess the function of new genes that are similar
Signature/motif of a protein
Sort of fingerprint of proteins in InterPro databases that are linked to certain domains or functions. When a new protein has a known fingerprint their function, structure and/or family could be predicted.
Protein Analysis THrough Evolutionary Relationships (PANTHER)
PANTHER is a tool that organizes genes into family trees (phylogenetic trees) based on evolutionary relationships. It helps us predict gene functions by comparing genes across species.
vHHR method (virtual High-Throughput Hybridization Readout)
a network-based approach for predicting gene functions.
Start with an RNA-Seq expression atlas:
This data shows how active each gene is in different tissues or conditions.
Build a co-expression network:
Genes that show similar expression patterns are connected.
This suggests they might work together in the same biological process.
Look at neighbors in the network:
For each gene, check the functions (GO terms) of its neighbors.
If many neighbors are involved in, say, root development, then the central gene likely is too—even if we don’t have direct evidence for it yet.
difference between multipe sequence alignment and BLAST
Blast compares one alignment with a database of many and looks for the best hit in that database. MSA aligns all sequences to one another and shows where sequences match or differ across all positions.