CNM - C5
1/19
There's no tags or description
Looks like no tags are added yet.
Name | Mastery | Learn | Test | Matching | Spaced | Call with Kai |
|---|
No study sessions yet.
20 Terms
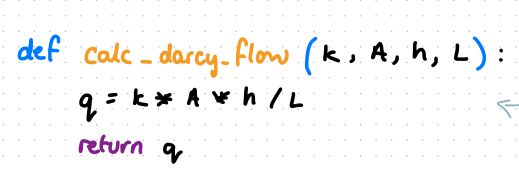
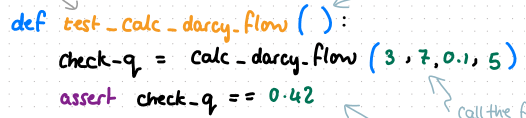
how to test this function
what do you import to make graphs on python?
import matplotlib.pyplot as plt
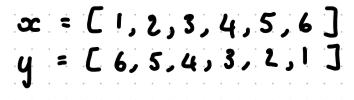
how to plot these valuies
plt.plot(x, y) - this produces a lineplot
is the figure and the legend when plotting graphs
the figure is the overall page that everything is drawn on and the legend is the key to your graph
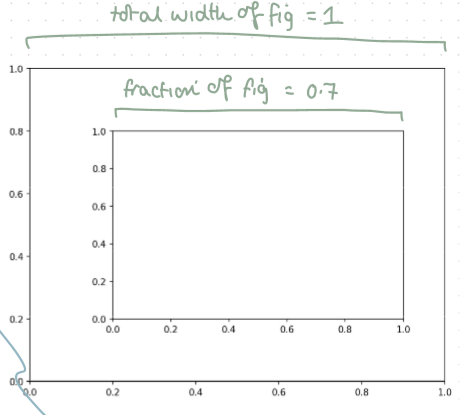
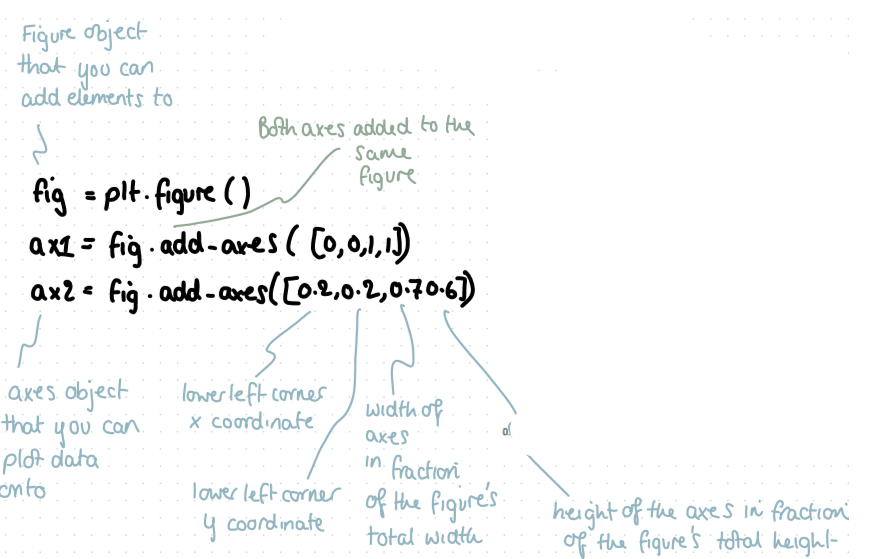
how to add these axes to a figure
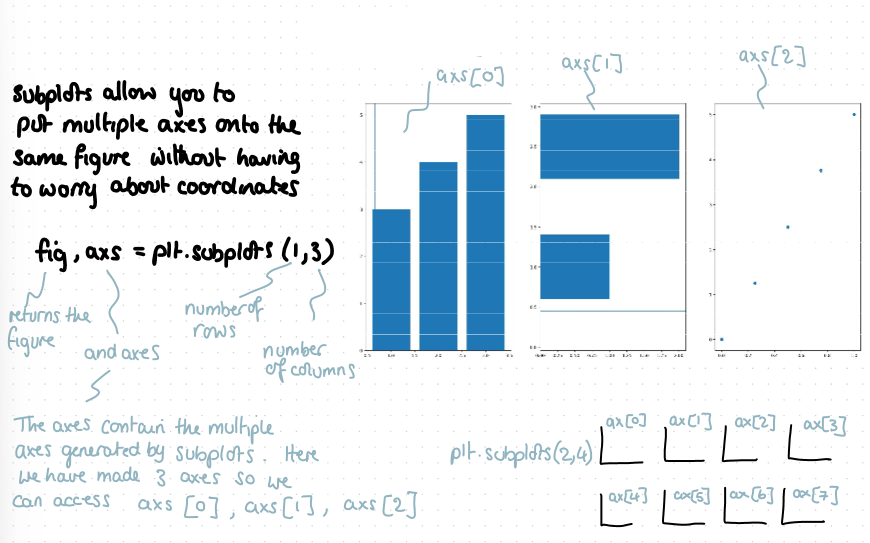
what do subplots do and how do you use them
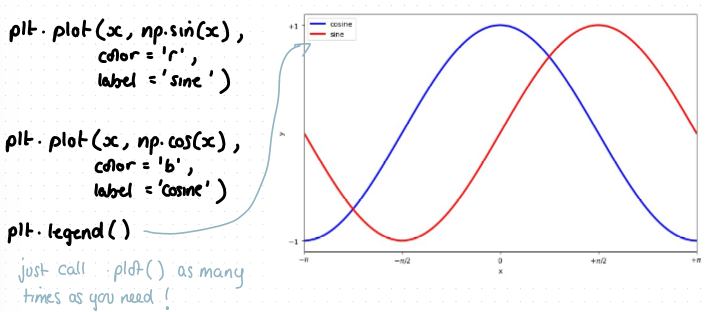
how to plot a red sinx and blue cosx line on the same graph with a legend
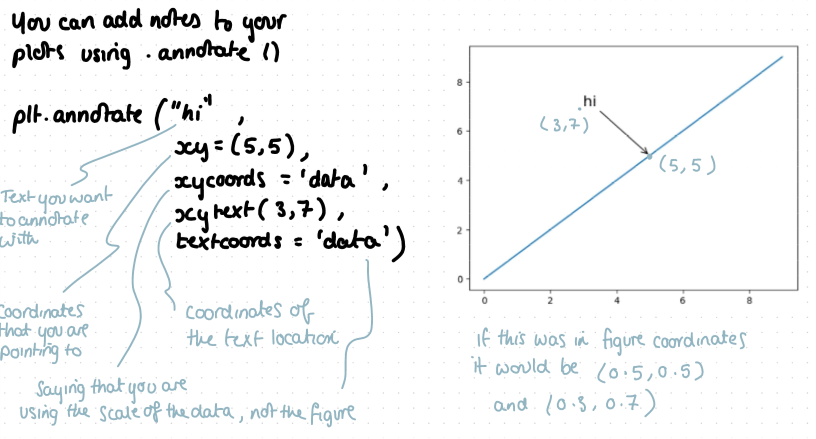
how to annotate the word ‘hi’ on a graph pointing to point (5,5) with text at point (3,7)
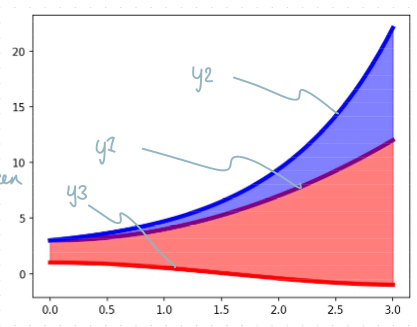
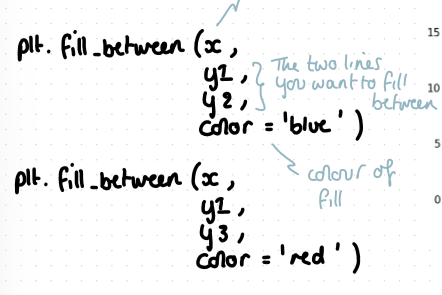
how to produce this (shade area between the lines)
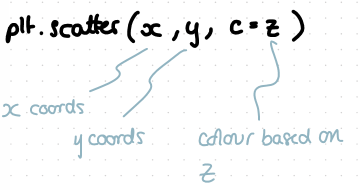
how to produce a scatter plot with a colour scale
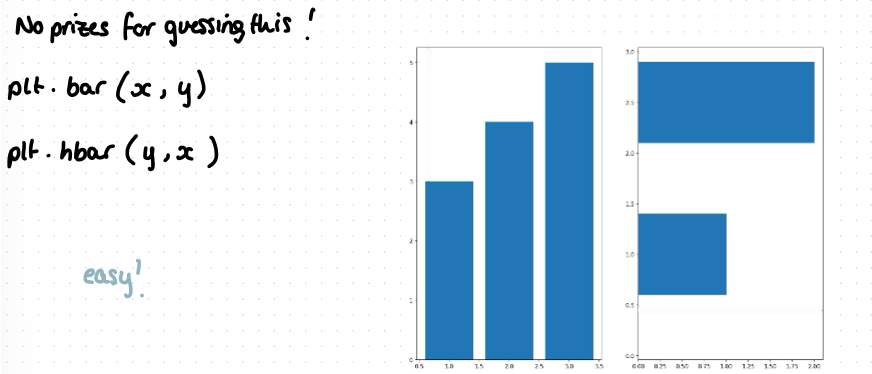
how to plot bar charts
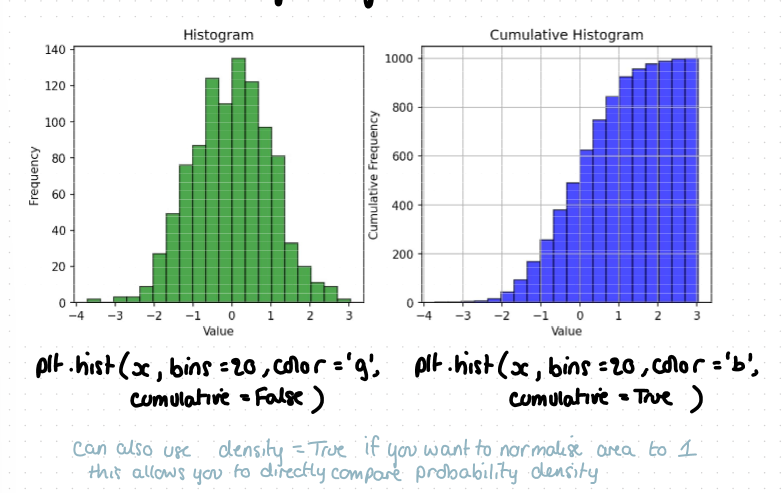
how to plot cumulative and non-cumulative histograms
How do you label the x-axis ‘X’
plt.xlabel(“X”)
how do you create a 2×1 grid of subplots (two rows, one column)
plt.subplot(2, 1, 1) and plt.subplot(2, 1, 2)
third slot is for index - tell python what position you want that plot in
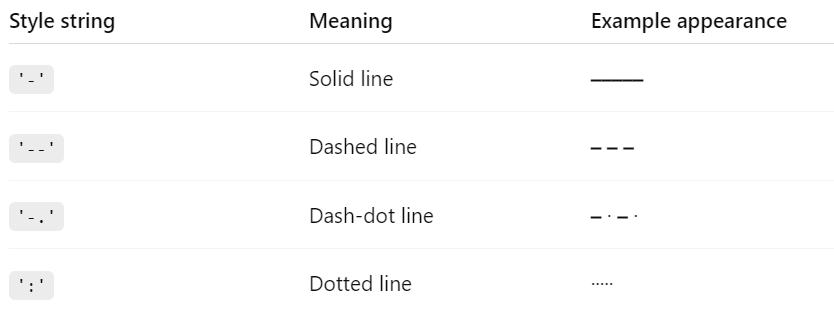
what are valid matplotlib line styles?
what does plt.show() do
The first time its called it shows all plots created, then closes them
The second time its called it shows all plots created since the last plt.show()
in exam it will likely just refer to showing all figures created so far
in the annotate function, what does the argument xy represent
the point being annotated - where the arrow should end
What library/libraries are used to work with dates in a plot?
import matplotlib.dates as mdates
import datetime as dt
What does the parameter alpha generally control in visualizations?
Transparency of objects
If x is a NumPy array of data, what does plt.hist(x, bins=10) do?
The range of values in x is divided into 10 equal-width intervals (bins).
Matplotlib counts how many data points fall into each bin.
These counts are shown as bars, representing the data distribution.