EOSC210 Topography
1/12
There's no tags or description
Looks like no tags are added yet.
Name | Mastery | Learn | Test | Matching | Spaced |
|---|
No study sessions yet.
13 Terms
Required in Constructed Maps Are:
LOTS:
Legend
Orientation
Title
Scale
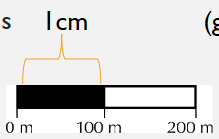
Verbal Scale
1cm = 100m
Fractional Scale
1/10,000
Graphical Scale
Contour Lines
lines of equal elevation represent the shape of the land surface
Contour Interval
The elevation difference between lines
Topographic Relief
Difference in elevation present within the map area
High Relief
rapid changes in elevation over short distances
Low Relief
small changes over long distances
Stream Gradient
(vertical elevation change)/(horizontal distance)
12 Rules for Constructing Topographic Map
1. Every point on a contour line is the same elevation (i.e. contour lines
connect points of equal elevation).
2. Contour lines separate points of higher (uphill) elevations from points of
lower (downhill) elevation.
3. Contour lines fall in simple multiples of the contour interval with zero
representing mean sea level.
4. Contour lines never intersect or cross, except in the case of
overhanging cliffs.They coincide only on vertical cliffs.
5. Contour lines always close but the closure may take place
outside the map boundary.
6. Contour lines never split.
7. The closer the contour lines, the steeper the slope.
8. Evenly spaced contour lines represent a uniform slope.
9. Closed contour lines represent a hill or a hollow
depression.
10. Depression contour lines have sometimes hachure
marks on the downhill side, always close and represent a
closed depression.
11. Contour lines “V” in an upstream direction and
cross the stream at the sharp point of the “V”.
12. Whenever vertical direction changes on the map
(crossing the top of a hill or the bottom of a valley)
the same contour line is crossed twice.
*bold/underlined are key rules to remember
Topographic Profiles
• A cross-section constructed along a line of particular interest on
the map to illustrate the relief displayed on the map.
• The profile can be considered as a graph on which the elevation
is plotted against the horizontal distances.
• Orientation of the profile must be labeled.
• Example- A-B (West- East)
Vertical Exaggeration
VE = (Vertical Scale)/(Horizontal Scale)