Biostats Lect 5 -7
1/16
There's no tags or description
Looks like no tags are added yet.
Name | Mastery | Learn | Test | Matching | Spaced |
|---|
No study sessions yet.
17 Terms
z - score
specifies the precise location of an x-value within a distribution
The number of standard deviations a raw score (individual score) deviates from the mean
A raw score or raw deviation alone is not meaningful because there is no context
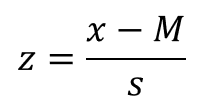
Z score in sample equation
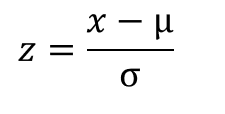
z score in a population Equation
Sign of a z score
(+ or −) signifies whether the score is above the mean (positive) or below the mean (negative).
Numerical value of z score
specifies the distance from the mean by counting the number of standard deviations between x and μ.
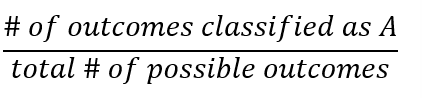
Probability
likelihood of obtaining a specific outcome or class of outcomes from all possible outcomes
Defined as a fraction or a proportion
used to predict the type of samples that are likely to be obtained from a population
establishes a link between samples and populations.
Probability of A equation
Label the graph A - B
A. Body
B. Tail
Graph distribution is divided into two sections
Body: larger section (has high probability)
Tail: smaller section (has low probability)
To find the probability of a class of outcomes corresponding to a particular score:
1.Transform that score into a z-score
2.Look up the z-score in the first column of unit normal table and read across the row to find the appropriate proportion/probability.
Percentile rank for a specific X value
the percentage of individuals with scores at or below that value, rounded up to next whole number because percentiles are intervals.
The percentage used to find percentile for a score in a normal distribution is simply the percentage to the left of the score (body for positive z-score, tail for negative z-score).
If the sample has a high probability of being obtained from a specific population
then the sample is likely to have come from it
If the sample has a low probability of being obtained from a specific population
then the sample probably didn’t come from it
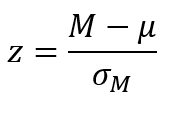
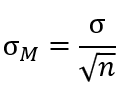
Standard error
The standard deviation of the distribution of sample means
It gives a measure of the typical deviation between a sample mean and μ, the typical sampling error.
Standard error equation
Central Limit Theorem - The shape of the distribution of sample means tends to be normal. It is guaranteed to be normal if either
a) the population from which the samples are obtained is normal, or
b) the sample size is n = 30 or more.
z-score for Sample Means equation