EKG Lab Worksheet Bio 221
1/22
There's no tags or description
Looks like no tags are added yet.
Name | Mastery | Learn | Test | Matching | Spaced |
|---|
No study sessions yet.
23 Terms
What is the electrical pathway (conduction system) of the heart?
The electrical pathway of the heart consists of the following components:
Sinoatrial (SA) node
Atrial internodal pathways
Atrioventricular (AV) node
Bundle of His (AV bundle)
Right and left bundle branches
Purkinje fibers
What causes the "Lub" sound (S1) of the heart?
The "Lub" sound (S1) is caused by the closing of the atrioventricular (AV) valves (tricuspid & mitral).
What causes the "Dup" sound (S2) of the heart?
The "Dup" sound (S2) is caused by the closing of the semilunar valves (aortic & pulmonary).
When measuring blood pressure, what are you measuring?
You are measuring pressure in arteries.
What does the top number of a blood pressure reading represent?
The top number represents Systolic pressure, which is ventricular contraction.
What does the bottom number of a blood pressure reading represent?
The bottom number represents Diastolic pressure, which is ventricular relaxation.
Which blood pressure number represents ventricular relaxation?
Diastolic pressure.
Which blood pressure number represents ventricular contraction?
Systolic pressure.
Describe blood flow and sound in a fully open vessel.
Fully open vessel
Laminar flow
Silent (no sound)
Describe blood flow and sound in a partially occluded vessel.
Partially occluded vessel
Turbulent flow
Creates a sound
What are the sounds heard during BP measurement called, and what causes them?
The sounds during BP measurement are called Korotkoff sounds, caused by turbulent blood flow.
True/False: To take an accurate BP, you must first tighten the BP cuff enough to completely occlude the artery and stop blood flow.
✅ True
What is the P wave on an EKG?
A small rounded bump before each QRS complex; represents atrial depolarization.
What is the QRS complex on an EKG?
A tall, sharp spike after the P wave; represents ventricular depolarization.
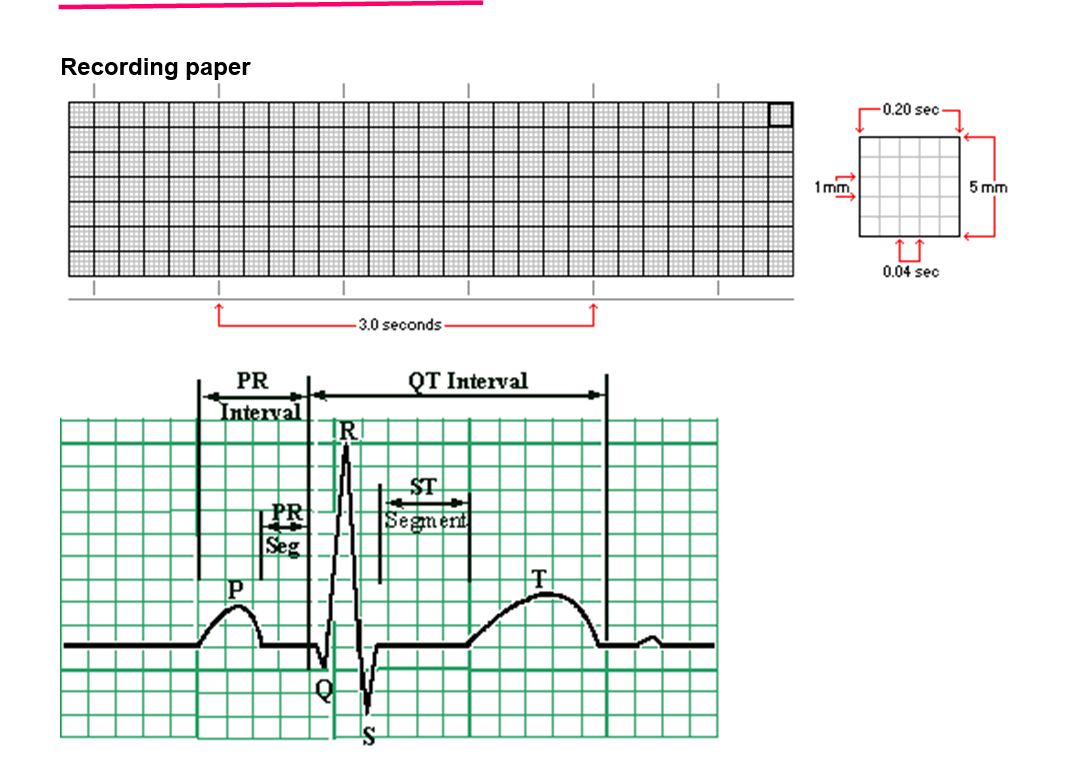
How do you measure the PR interval on an EKG?
From the beginning of the P wave to the beginning of the QRS complex.
How do you calculate the PR interval length?
Count the small boxes between P wave and QRS start, then multiply by 0.04 sec per small box.
What is the normal PR interval range?
0.12\text{–}0.20 sec (3\text{–}5 small boxes).
Example: If the PR interval = 4 small boxes, what is the value?
4 \times 0.04 = 0.16 sec (normal).
How do you measure heart rate (HR) on an EKG?
Count the large boxes between two R waves (QRS peaks), then use the formula: HR = 300 / \text{# of large boxes} .
Example: If there are 4 large boxes between R waves, what is the HR?
300 \div 4 = 75 bpm.

Answer the following:
P wave represents - _________________________
QRS Complex represents - ______________________
T wave represents- ________________________
PR interval normal- _______
Normal heart rates - __________
Sinus Tachycardia -_____________ Sinus Bradycardia - ___________
Calculating heart rates:
Heart rate= _________________ 300_______________________
# of big boxes between 2 consecutive QRS's
P wave represents – Atrial depolarization
QRS Complex represents – Ventricular depolarization (atrial repolarization also occurs here but is hidden)
T wave represents – Ventricular repolarization
PR interval normal – 0.12 – 0.20 sec (3–5 small boxes)
Normal heart rates – 60–100 beats per minute (bpm)
Sinus Tachycardia – >100 bpm
Sinus Bradycardia – <60 bpm
Calculating heart rates formula:
Heart rate=300/ # of big boxes between 2 consecutive QRS’s
✅ Example: If there are 4 big boxes → HR = 300 ÷ 4 = 75 bpm

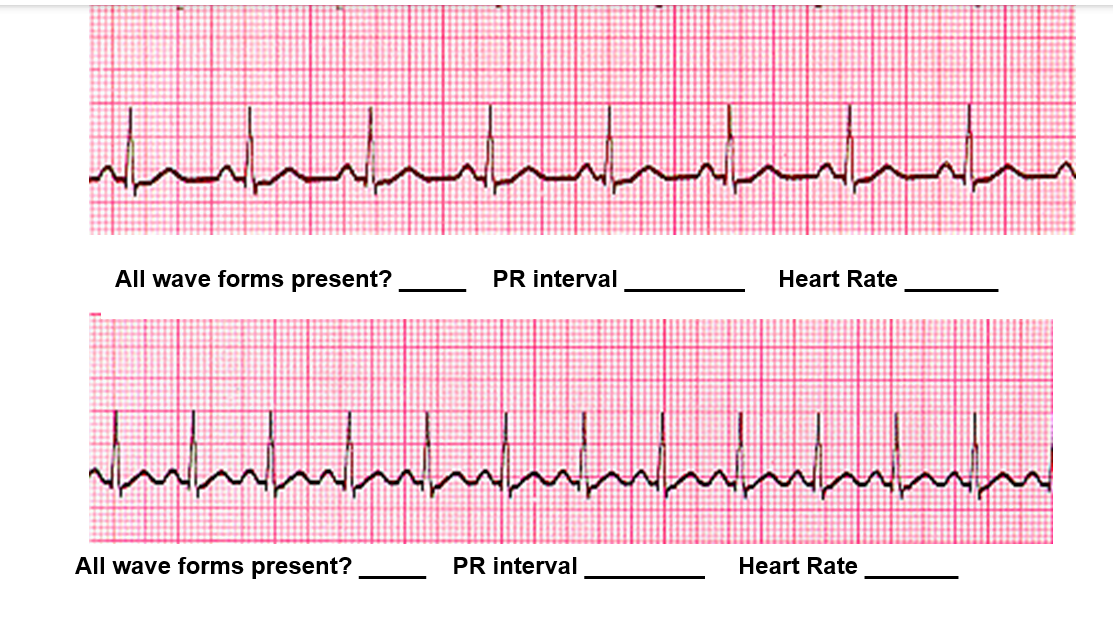
Fill in the blanks for the top EKG strip and the bottom EKG strip.
Top ECG strip
All wave forms present? ✅ Yes (P wave, QRS, and T wave all visible)
PR interval → Each small box = 0.04 sec. The PR interval here is about 4 small boxes ≈ 0.16 sec (normal: 0.12–0.20 sec).
Heart Rate → Count large boxes between 2 QRS complexes. There are about 4 large boxes.
HR=300/4≈75bpm
✔ Answer (Top strip): All wave forms present: Yes | PR interval: 0.16 sec | Heart Rate: 75 bpm
Bottom ECG strip
All wave forms present? ✅ Yes
PR interval → Also about 4 small boxes ≈ 0.16 sec
Heart Rate → Between QRS complexes, there are about 2 large boxes.
HR=300/2=150 bpm
✔ Answer (Bottom strip): All wave forms present: Yes | PR interval: 0.16 sec | Heart Rate: 150 bpm

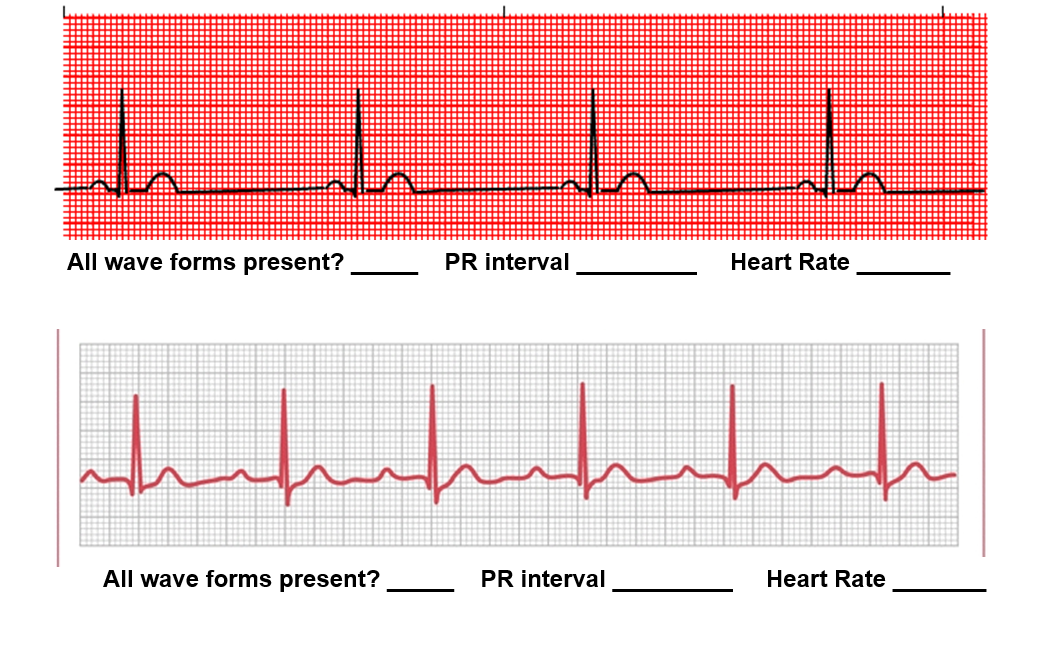
Fill in the blanks for the top EKG strip and the bottom EKG strip.
Top ECG Strip (red background)
All wave forms present? ✅ Yes (P waves, QRS complexes, T waves are visible)
PR interval: Start of P wave → start of QRS. Looks like ~4 small boxes = 0.16 sec (normal).
Heart Rate: Count large boxes between QRS complexes → about 4 large boxes.
HR=300/4=75 bpm
✔ Answer (Top): All wave forms present: Yes | PR interval: 0.16 sec | Heart Rate: 75 bpm
Bottom ECG Strip (gray background)
All wave forms present? ✅ Yes (P, QRS, T all present)
PR interval: Also about ~4 small boxes = 0.16 sec
Heart Rate: About 5 large boxes between QRS peaks.
HR=300/5= 60 bpm
✔ Answer (Bottom): All wave forms present: Yes | PR interval: 0.16 sec | Heart Rate: 60 bpm