Reservoir KNW2
1/35
There's no tags or description
Looks like no tags are added yet.
Name | Mastery | Learn | Test | Matching | Spaced |
|---|
No study sessions yet.
36 Terms
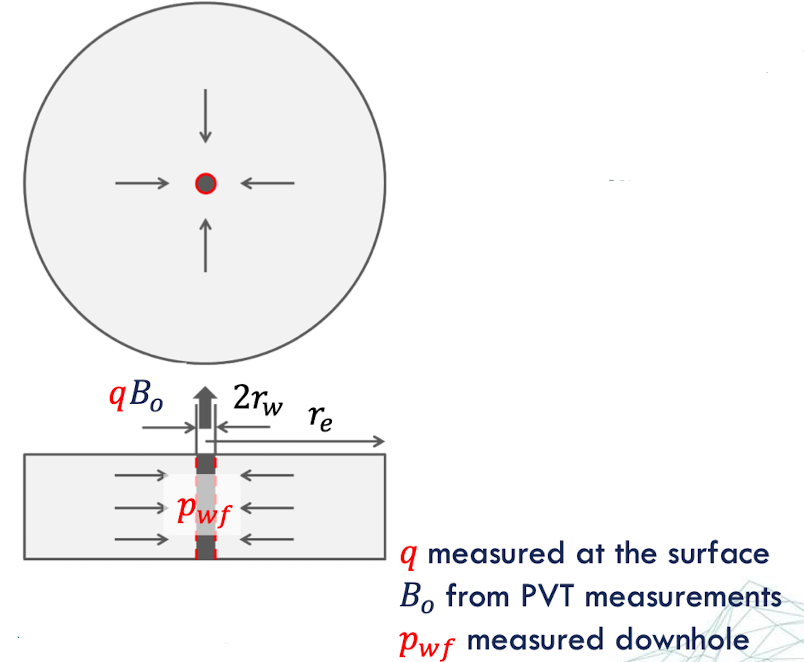
Production well assumptions
the reservoir is considered homogeneous in all rock properties & isotropic w/ respect to permeability
the well is completed & perforated across the entire formation thickness (quasi 1D)
the formation is saturated with/ a single fluid
partial différentiel equation factors
initial cond.
boundary cond.
const. terminal rate solution scenario
at a point in time at which the res., is at equilibrium pressure pi, the well starts producing w/ constant. rate q at the wellbore w/ radius rw
radial flow states
transient: infinitely acting res.
semi-steady state (SSS)
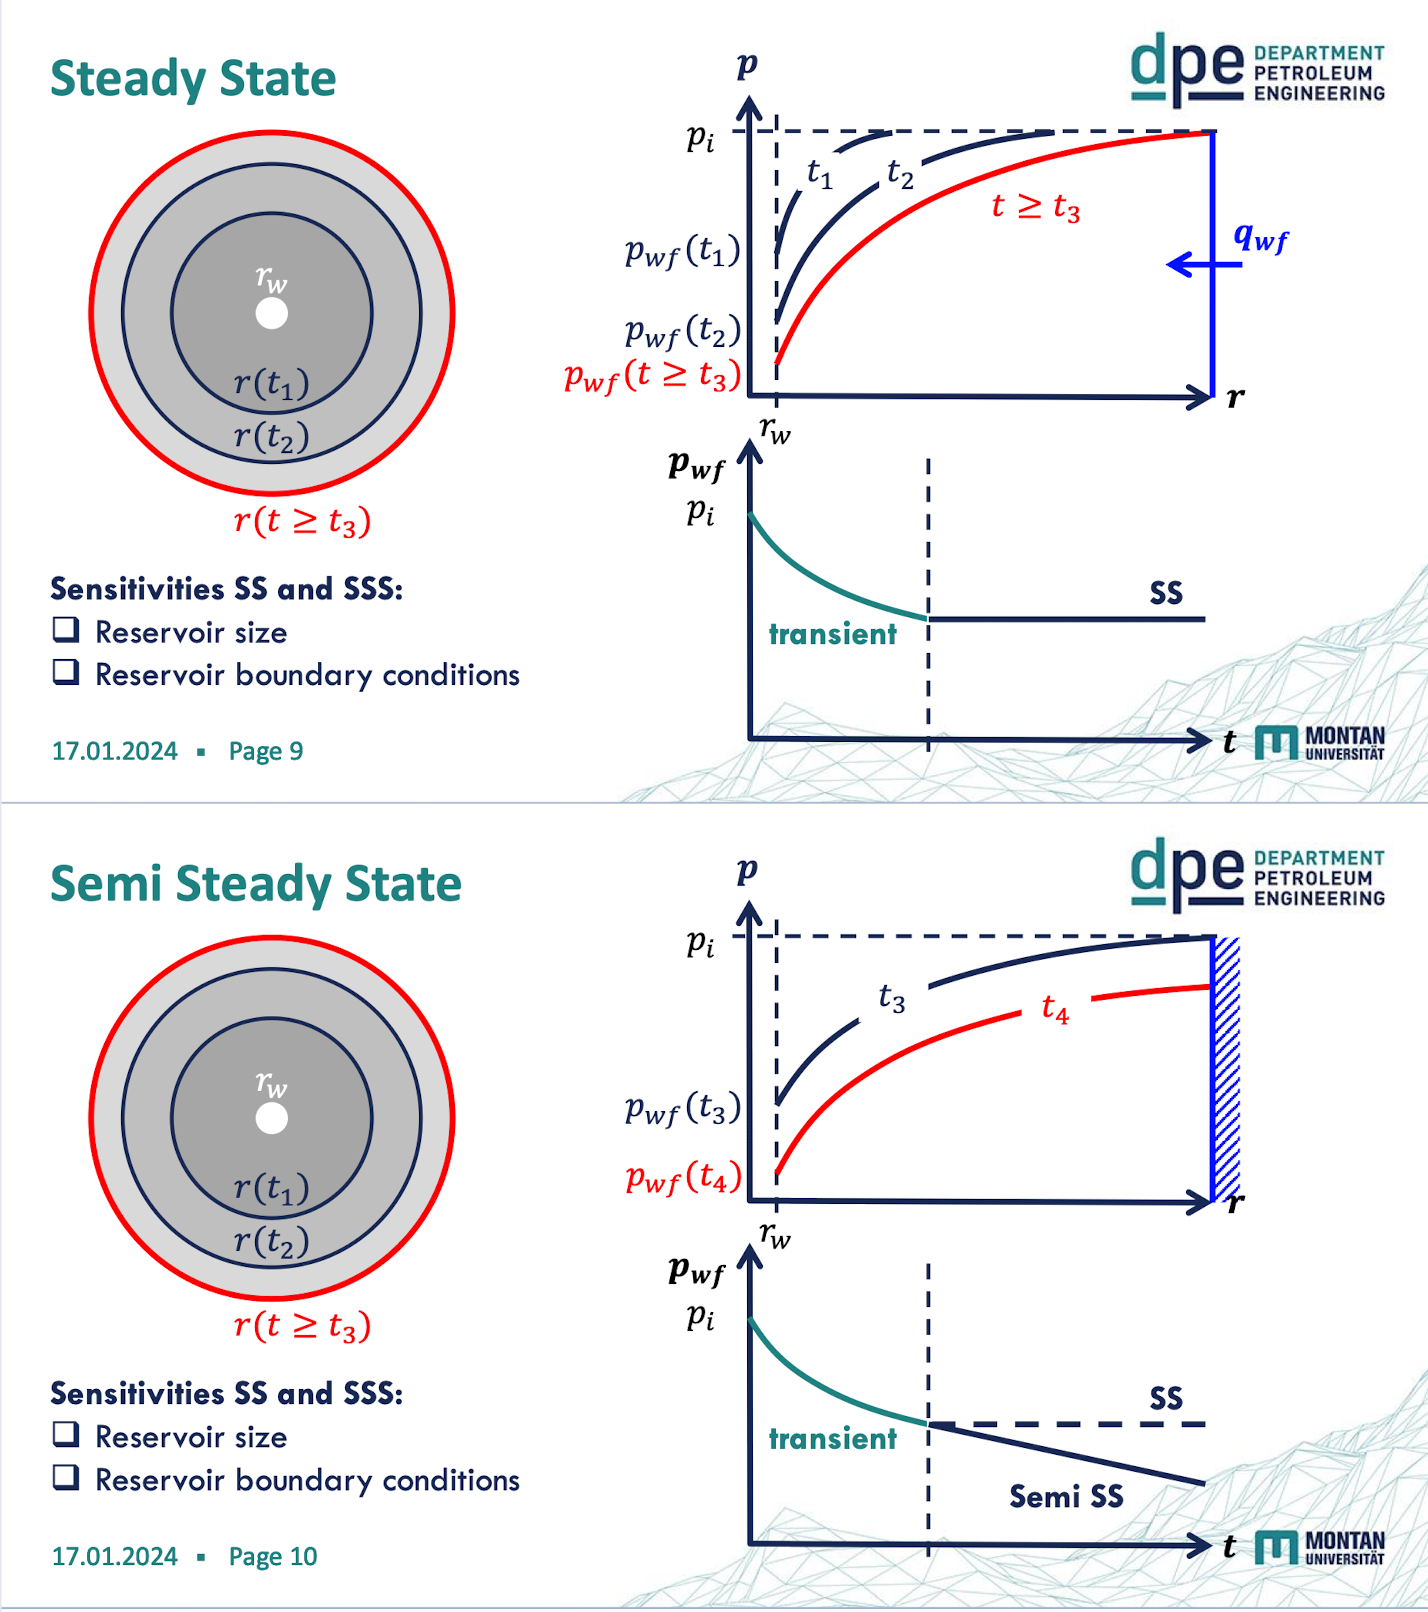
steady state (SS)
=> SSS & SS are stabilised flow cond.
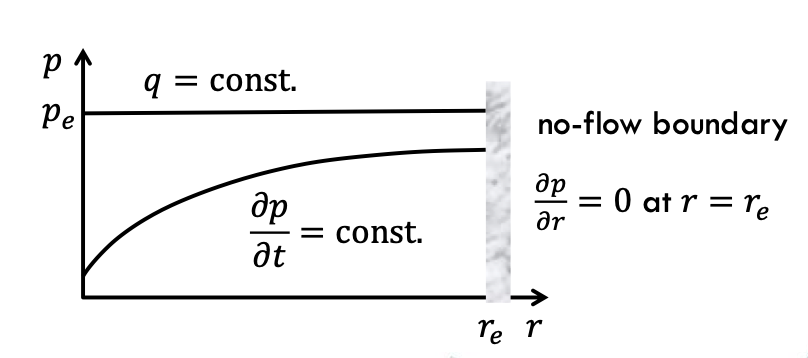
semi steady state
reservoir has closed/ solid boundaries, meaning there is no influx of fluid from the outside → production is changing pres
the pressure decline is proportional to the production rate and invers proportional to the reservoir size
applied to reservoir that is producing for a sufficient period of time such that the boundary effects are fully developed.
q = const.; ∂p/∂t = const; ∂p/∂r = 0 at r=re
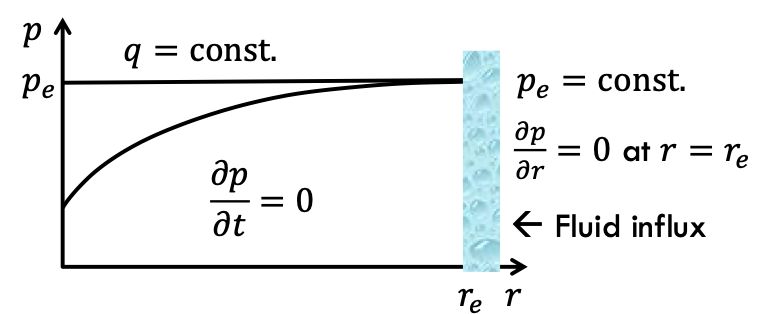
Steady state
influx from boundaries compensates for fluid loss from production
pe = const; q = const; ∂p/∂t = 0; ∂p/∂r = 0 at r = re
Dietz shape factor
considers the irregularities in the drainage area as each well have its own drainage boundary with the symmetry depending on the injection pattern and the geological settings.
proportional to the well’s production rate under SSS conditions
NOT the TRUE shape
cant obtain the orientation
superposition theorem
individual const. rate wells can be placed in any position at any time and each well will drain from within its own no flow boundary quite independently
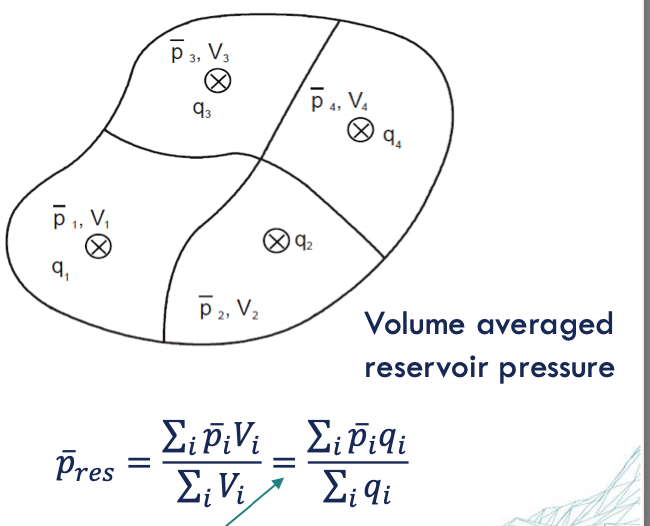
pres = ∑piVi/∑Vi = ∑piqi/∑qi
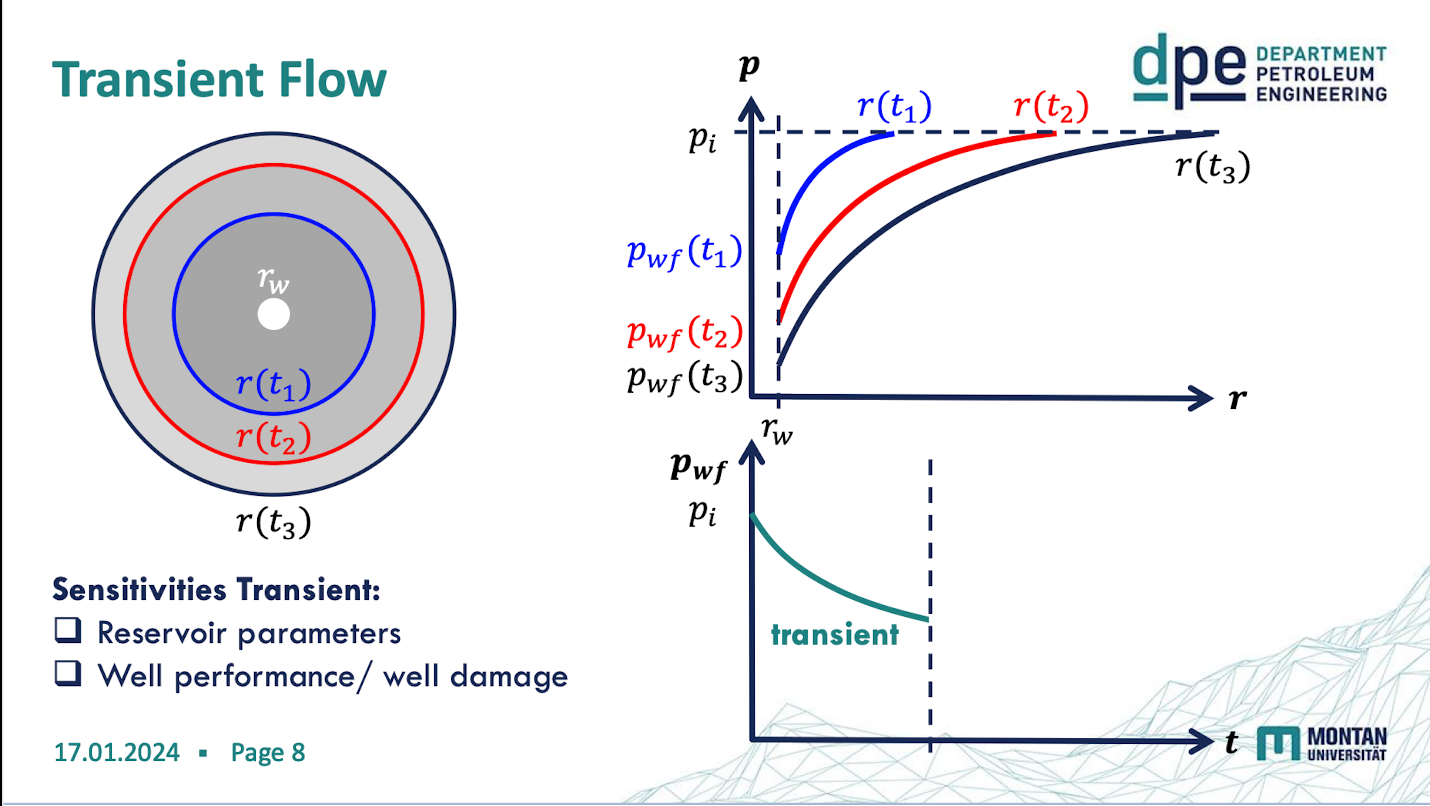
transient flow
the pressure disturbance travels into the field right after starting production & is not affected by the boundaries of the res.
p = pi at t=0 for all r → pbefore production = pi
p = pi at r=∞ for all t → ensures transient cond.: infinite reservoir
lim r ∂p/r = qµ/2πKh# for t>0 → line-source inner boundary cond.
well testing
the process of measuring the changes of production or injection rate and the downhole pressure under flowing cond. of the testing well, i.e. obtaining input or output signals of the system.
well testing objectives
Provides information about:
permeability
formation damage
productivity index
res. drive mechanism
basic res. geometries & other characteristics
well testing methods
wireline
drill stem (DST)
production test
Pressure Measurement Challenges
Pressure gauge limitations:
Gauge type
Applicable pressure range
Calibration status
Depth measurement errors:
Need for accurate true vertical depth
Corrections affected by uncertain fluid density in the well
Background noise:
Pressure variations from nearby producing wells
Interpretation assumptions
surface rate measurement
accuracy of converting reservoir to surface volumes, effected by conversion factors & exact hydrostatic head
production test process
Case off the hole
Run a production string
Perforate the zone of interest
Produce reservoir fluids at controlled rates for a desired period
Record reservoir pressure as a function of time
Take fluid samples (either downhole or at the surface)
=> basis of field appraisal & development decisions
drill stem test
carried out with a temporary completion using the drill stem as temporary conduit
Run DST tool into the wellbore
Set packer to isolate test zone
Open valve and allow initial flow
Close valve for pressure measurement
Open valve for main production period
Collect fluid samples
Close valve for final pressure readings
Remove tool from wellbore
=> used for low GOR for safety reasons
pressure transient analysis
creates a controlled disturbance (perturbation) in the reservoir and analyzing its response.
Perturbation: Create a change in the reservoir (by producing or shutting in the well)
Reservoir Mechanism: The reservoir responds to this change
Response: Measure the pressure changes over time (pressure transient)
Analysis: Interpret the pressure transient data to derive reservoir properties
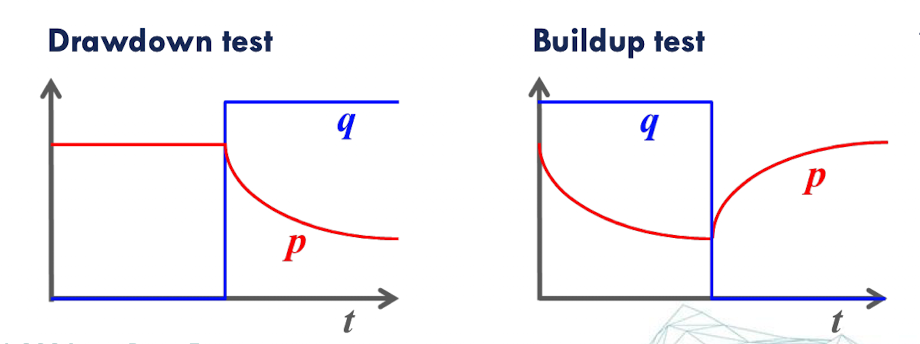
transient analysis test types
drawdown test: log-log plot
Input: Constant flow rate (well is opened to produce)
Output: Decreasing pressure over time
build up test: Horner plot (semi-log)
Input: Well is shut in (flow rate becomes zero)
Output: Increasing pressure over time
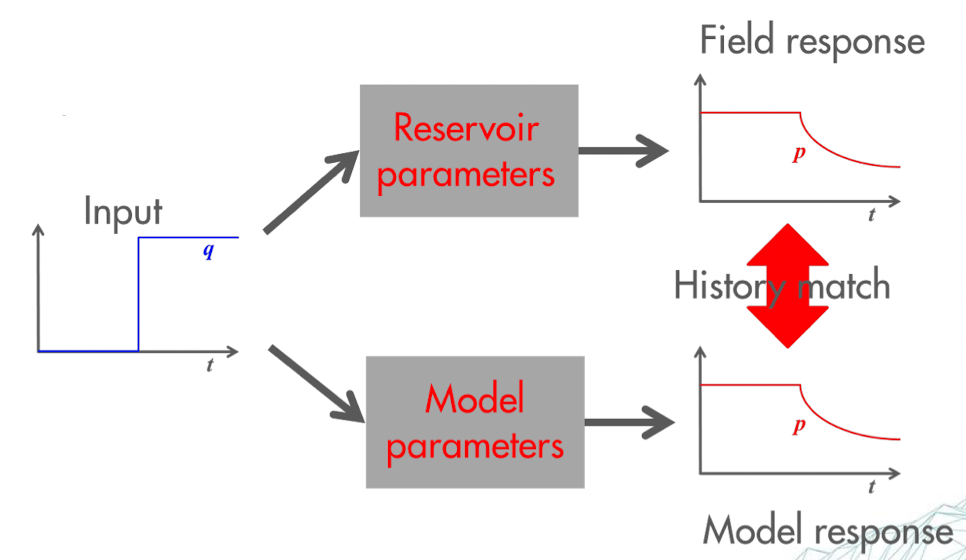
transient analysis approaches
comparison to analytical model: compares observed pressure and flow rate data to theoretical models
numerical history matching: uses computer simulations to match observed data
transient analysis output parameters
permeability
skin factor
drainage radius
productivity index
transient flow sensitivties
reservoir parameters
Well performance
well damage
radial flow method
the movement of fluid in a reservoir from the perimeter towards the bottom hole along radial directions in the horizontal plane.
SS & SSS flow sensitivties
reservoir size
reservoir boundary conditions
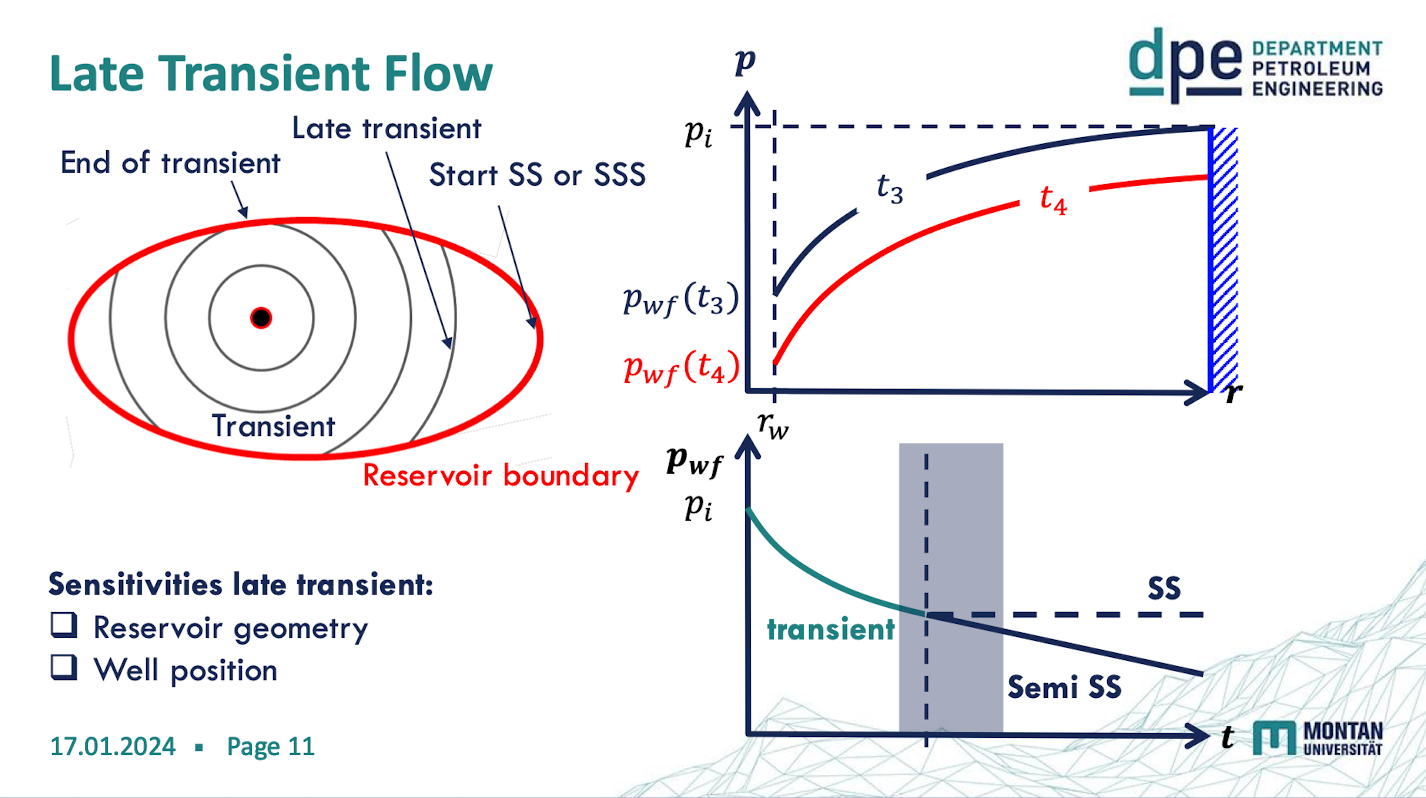
late transient flow sensitivties
reservoir geometry
well position
wellbore storage
the effect of fluid expansion or contraction within the wellbore itself, separate from fluid flow from the reservoir
wellbore storage causes
pressure decrease due to:
expansion of fluids in the well
changing liquid level in the well annulus
wellbore storage mechanism
When production starts or stops, there's a delay before the sandface flow rate matches the surface flow rate
During production, fluid in the wellbore expands as pressure decreases
During shut-in, fluid in the wellbore compresses
skin factor
damage zone around the production & injection wells caused by invasion of mud filtrate or cement during drilling / completion (a.k.a formation damage)
S>0: additional pressure drop → formation damage
S<0: improved wellbore cond. → well simulation
S=0: no changes in the well cond. → formation permeability
drainage radius
gives an estimate about the size if the reservoir
at the drainage radius: p(r,t>0) - pi = 0
max drainage radius: p(re, t) - pi = 0
productivity index
measures of the ability of the well to produce
PI = qtotal /(p-pwf) [stb/d.psi]
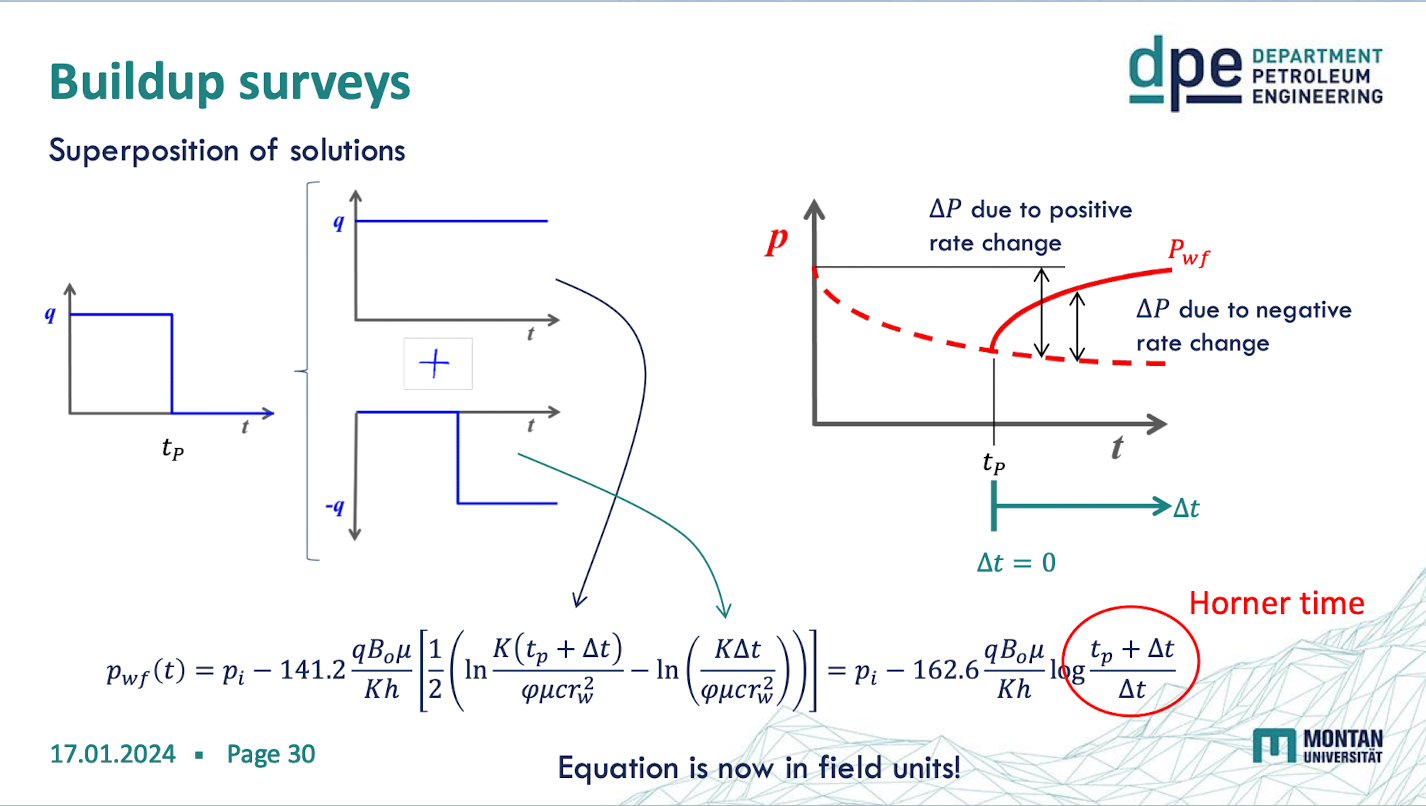
buildup survey benefits
less susceptible for noise from fluctuating production rates
cancel skin effects
buildup survey procedure
the well is producing for a certain time (pressure drawdown) and is then shut-in → the pressure builds up again
Horner plot
a semi-logarithmic analysis in which its time axis is read from right to left
Right side: Wellbore storage effects
Middle: Transient flow (straight line)
Left side: Boundary effects
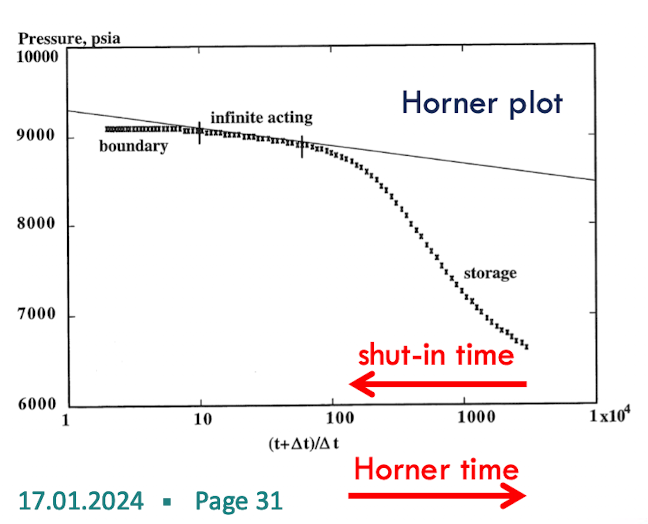
Horner plot benefits
Complements drawdown data for verification
Usually provides cleaner data (less noise)
Transient flow appears as a straight line
Permeability calculated from the slope
Sequence of Flow Regimes in horizontal wells
Wellbore Storage and Skin Effects
Occurs immediately after production starts or stops
Early Radial Flow (in the yz plane)
Flow is radial in a vertical plane perpendicular to the wellbore
Linear Flow (in y direction)
Fluid flows linearly towards the wellbore
Late Pseudoradial Flow (in the xy plane)
Occurs when the pressure transient extends beyond the well's ends
elliptical flow
a transitional flow period that occurs between a linear or near-linear flow pattern at early times and a radial or near-radial flow pattern at late times