APES chapter 7 (population)
1/45
Earn XP
Description and Tags
Population growth
Name | Mastery | Learn | Test | Matching | Spaced |
|---|
No study sessions yet.
46 Terms
What changes a population size
Birth and Death Rates
Fertility
Life Expectancy
Migration
Education of women
total fertility rate (TFR)
estimate the average number of children a woman will have in her lifetime per country
Life expectancy
-The average number of years an infant is expected to live
-Specific for each country
-Specific for each year
what are the 3 categories of life expectancy?
1. Overall Life Expectancy
2. Male Life Expectancy
3. Female Life Expectancy
Who on average lives shorter men or women?
men

What is the crude birth rate (CBR)?
average births per 1,000 people
infiant mortality
deaths under the age of 1
child mortality
deaths under the age of 5
Nations with high life expectancy and low infant/ child mortality tend to have
high rates of health care
adequate food supply
good sanitation
clean drinking water
moderate rates of pollution
Highest cause of death is…
heart disease
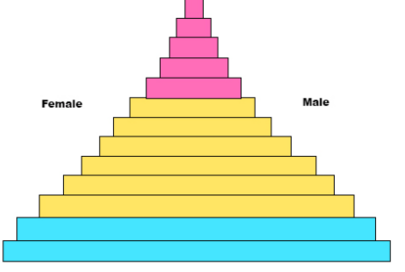
This pyramid represents
Rapid growth
- Wide Base = Many Young People
- High Birth rate
- Shorter Life Expectancy
- Developing Nations
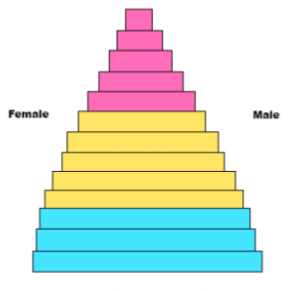
This pyramid represents
Slow growth
-developed nation
-Long Life expectancy
-Little difference between age groups
-Low infant mortality
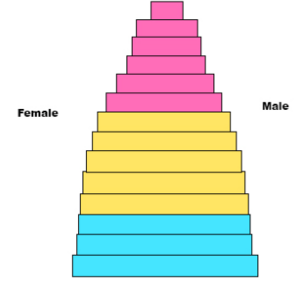
This pyramid represents
zero growth
-developed nation
-Long Life expectancy
-Little difference between age groups
-Low infant mortality
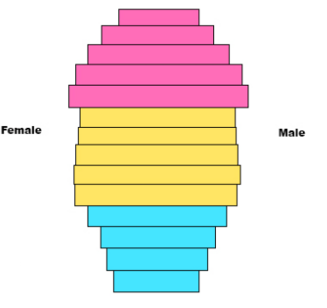
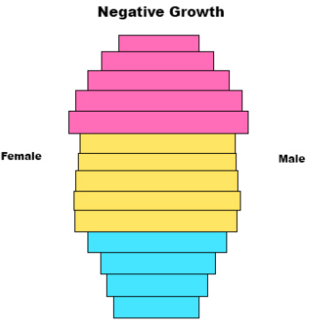
This pyramid represents
Negitive growth
-Greater number of older people than young people
-declining population
-long life expectancy
-Low birth rate

Urban populations represent ___ of the human population but consume ____ of the Earth’s resources.
Urban populations represent ½ of the human population but consume ¼ of the Earth’s resources.
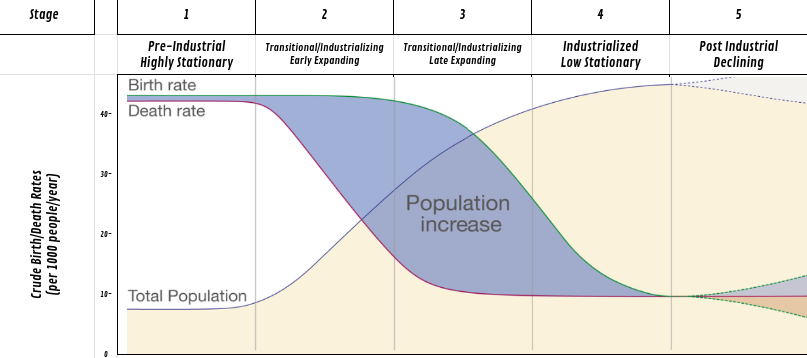
What is a Demographic Transition Model?
A model outlining the stages of population change as economies develop, shifting from high to lower birth and death rates.
What is the difference between a developed and a developing country?
Developed countries have high incomes, industrialization, and advanced infrastructure while developing countries have lower incomes and may lack adequate healthcare, education, and infrastructure.
what is the formula for growth (in a country)?
(Crude birth rate+ immigration) - (Cude death rate +emigration)/ 10
When someone is leaving the population this is called…
emigration
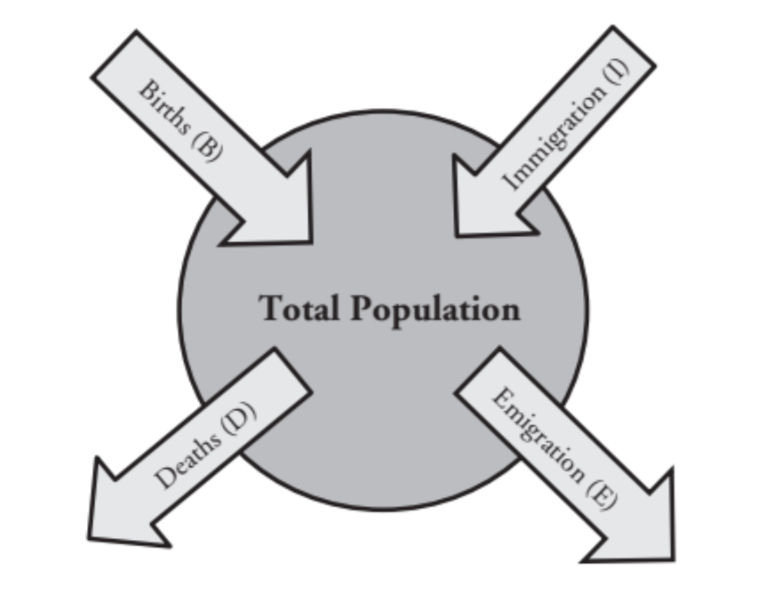
When someone is entering the population this is called…
immigration
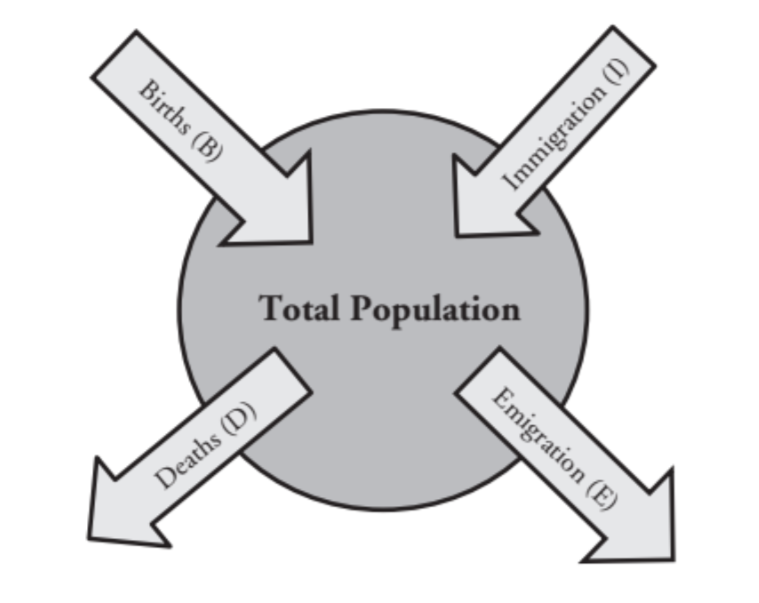
What is the crude death rate (CDR)?
number of deaths per 1,000 individuals per year
What is replacement-level fertility (RLF)?
the total fertility rate required to offset the average number of deaths in a population in order to maintain the current population size
what is the percent change formula?
Final- initial / initial × 100
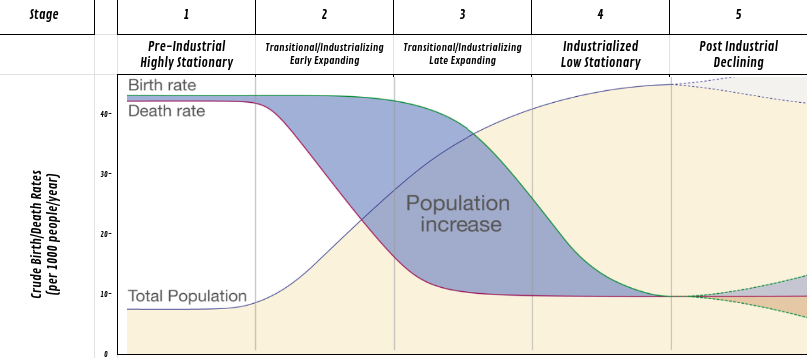
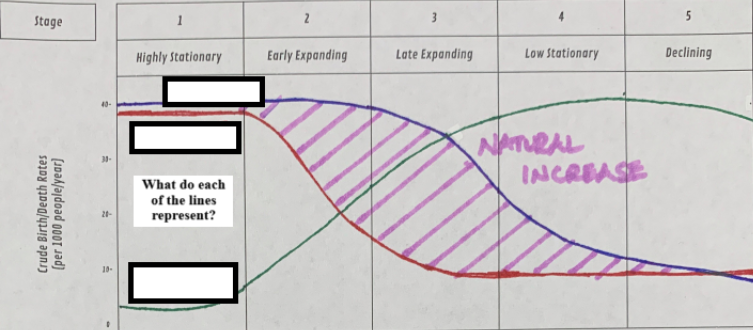
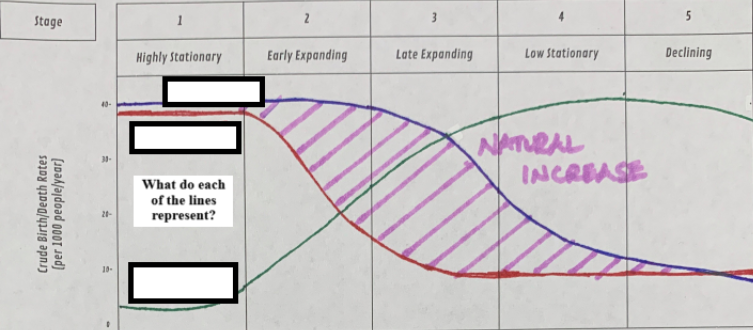
describe stage 1
this is the pre-industrial stage
high birth rate
high death rate (poor healthcare)
natural increase is sitting
has a rapid growth pyramid
ex) a tribe
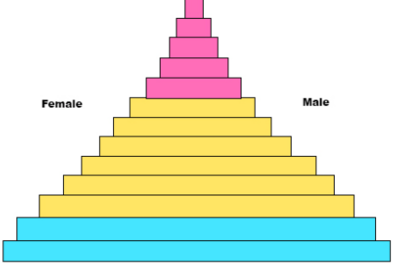
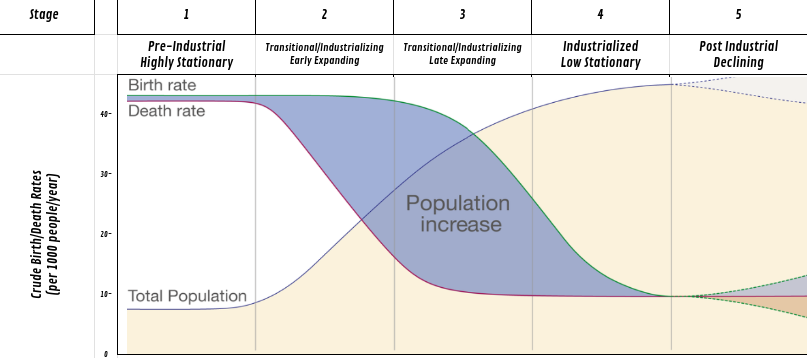
describe stage 2
this is the transitional stage
High birth rate (improved healthcare)
dropping death rate (better sanitation)
rapid natural increase
forms a rapid growth pyramid
ex) democratic republic of Congo
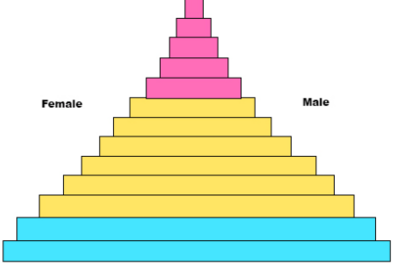
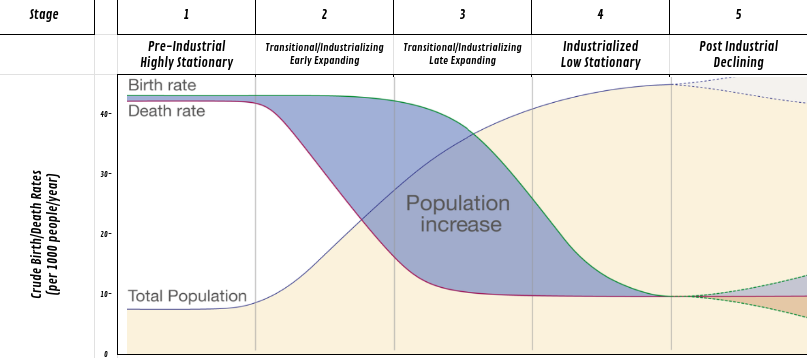
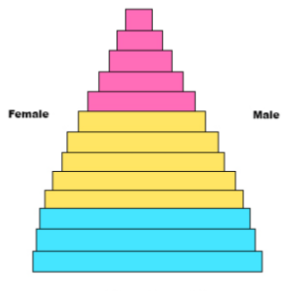
describe stage 3
this is the initializing stage
dropping birth rate
the death rate is decreasing
natural increase is slow
forms a slow growth pyramid
ex) Mexico
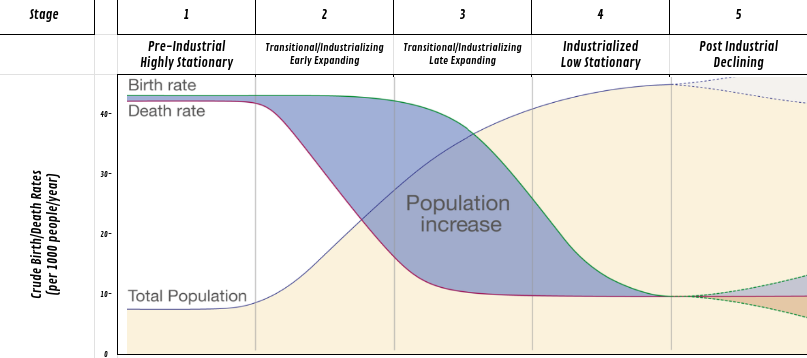
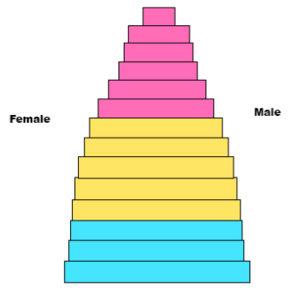
describe stage 4
this is the industrialized low stationary stage
low birthrate (better education)
low death rate (good healthcare)
stable natural increase
zero growth pyramid
ex) U.S.A
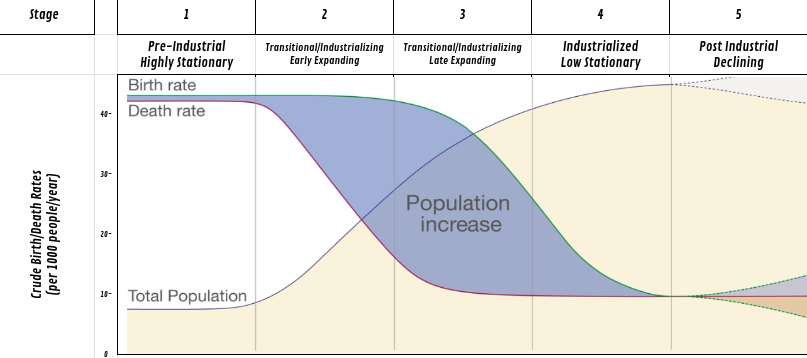
describe stage 5
this is the post industrial decline stage
birth rate is very low
death rate is low
slow decrease
forms a Negative growth pyramid
ex) Italy
what is the formula to determine the impact that a country has on the environment?
impact = population × affluence × technology
what is GDP?
gross domestic product
What are the 4 parts of GDP?
1) consumer spending
2) investments
3) government spending
4) exports minus imports
Why is increased GDP supposed to help the environment?
Wealthier societies can invest in cleaner technology to reduce pollution and support regulatory efforts, ensuring compliance with environmental regulations.
most materials consumed in __________ countries are consumed locally.
most materials consumed in developing countries are consumed locally.
where does ½ of the USA’s ecological footprint come form?
its use of fossil fules

Based on the trends shown in the table, in which of the following years was the owl population at carrying capacity?
2015
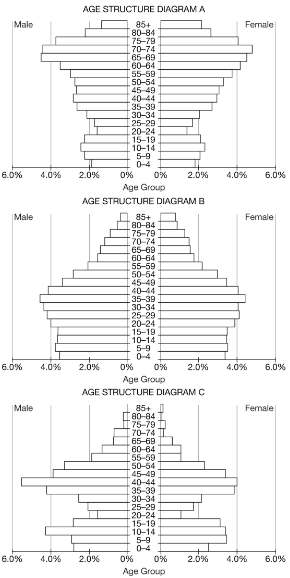
In a given county, the population size is decreasing because there are fewer prereproductive-aged individuals in the population. Which of the age structure diagrams best illustrates the population of this county?
A
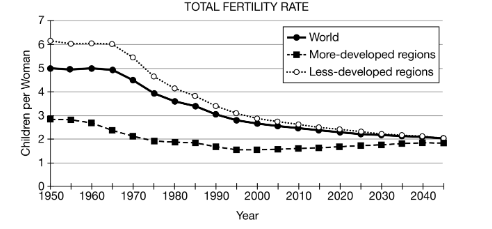
Based on the data in the graph, what was the average number of children born per woman in less-developed regions in 1975?
4.7
Replacement level fertility occurs at ___ children per woman.
Replacement level fertility occurs at 2.1 children per woman.
describe the difference between generalist species and specialist species
Generalists use a large range of resources, while specialists have a limited range of resources they use to survive.
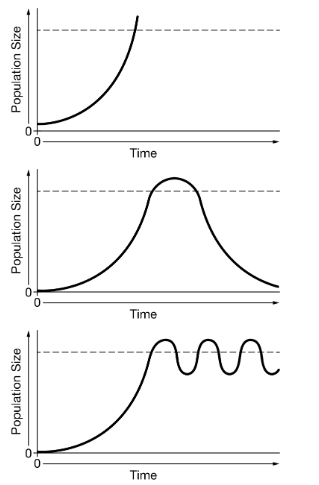
The graphs below show changes in a population over time. The dashed line represents the carrying capacity of the species. Which of the following graphs best shows the population size of a K-selected species over time in a stable environment?
The last one
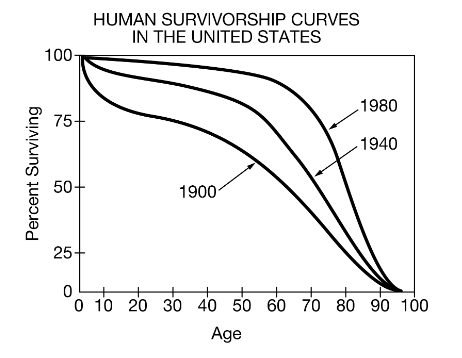
Based on the survivorship curves shown below, what is a possible reason for the change in the shape of the curve from 1900 to 1980?
Improvements in health-care services and medical research
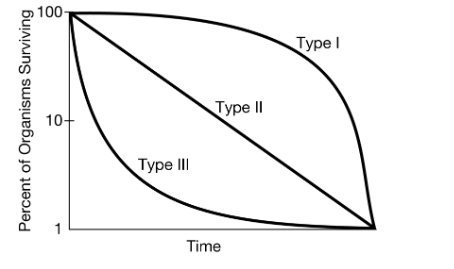
What is a characteristic of an organism that displays a Type III survivorship curve, as shown in the graph?
The organism produces large numbers of offspring every time it reproduces.
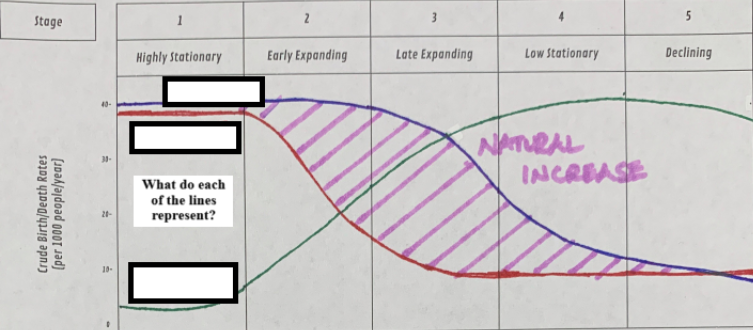
Which dose the blue line represent?
total births
Which dose the red line represent?
total deaths
Which dose the green line represent?
total population
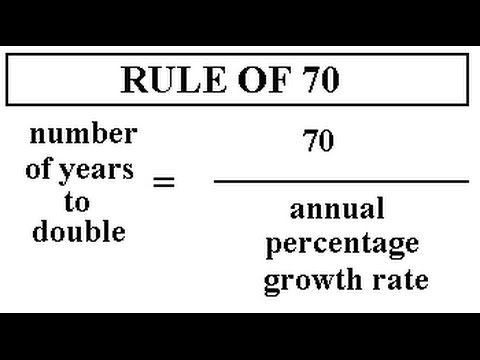
What is the rule of 70s?
