Stat Meth Ch 6 The Normal Distribution and other Continuous Distributions
1/14
There's no tags or description
Looks like no tags are added yet.
Name | Mastery | Learn | Test | Matching | Spaced |
|---|
No study sessions yet.
15 Terms
Variable
A characteristic or property of an item or individual.
Data
The set of values associated with one or more variables.
Statistics
Summary value of data of a particular variable.
Descriptive Statistics: The methods that primarily help summarize and present data.
Inferential Statistics: Methods that use data collected from a small group to reach conclusions about a larger group
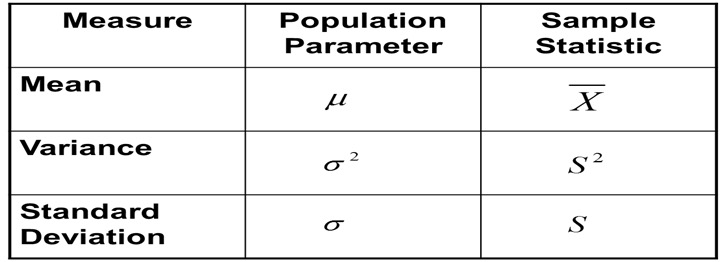
Sample Statistics vs Population Paramaters
Parameter: A descriptive measure for a population.
Statistic: A descriptive measure for a sample.
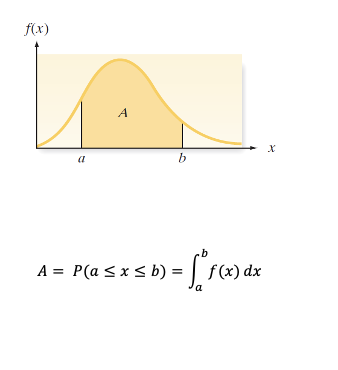
Continous Probability Density Function
1.The graphical form of the probability distribution for a continuous random variable x is a smooth curve
2.This curve, a function of x, is denoted by the symbol f(x) and is called a probability density function (pdf) (also called a frequency function, or a probability distribution).
3.The area A beneath the curve between two points a and b is the probability that x assumes a value between a and b.
Probability Density Curve
Represents the distribution of a continuous variable
The probability is interpreted as "area under the curve."
Basic Properties of probability distribution (Density Curves)
Property 1: A density curve is always on or above the horizontal axis.
Property 2: The total area under a density curve (and above the horizontal
axis) equals 1.
Some continuous probability distributions:
Normal distribution
Standard Normal (Z) distribution
Student's t distribution
Chi-square ( χ2 ) distribution
F distribution
Normally Distributed Variable
A variable is said to be a normally distributed variable or to have a normal distribution if its distribution has the shape of a normal curve
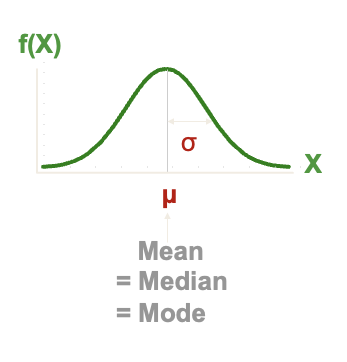
Characteristics of the Normal Distribution:
Bell Shaped
Symmetric about the mean µ
Mean, Median, and Mode are equal
The mean determines location, μ
The standard deviation σ determines spread.
The random variable has an infinite theoretical range: Negative infinitty to positive infinity.
Importance of Normal Distribution
Describes many random processes or continuous phenomena
Can be used to approximate discrete probability distributions
Example: binomial
Basis for classical statistical inference
Z Distribution
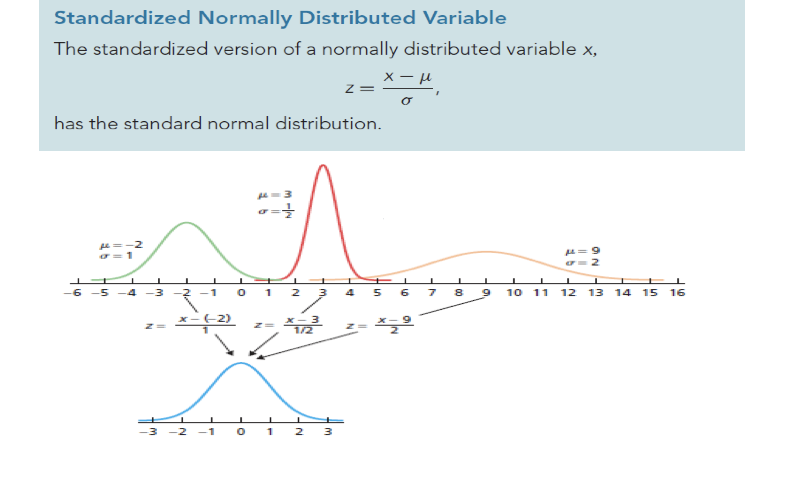
There is one normal distribution, Z, that is special. It has a μ = 0 and a σ = 1. This is the Z distribution, also called the standard normal distribution.
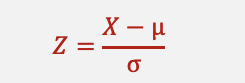
Any normal distribution can be converted into a standard normal distribution by transforming the normal random variable into the standard normal random variable:
This is called standardizing the data. It will result in (transformed) data with μ = 0 and σ = 1.
The areas under the curve for the Standard Normal Distribution (Z) has been computed and tabled
Standardizing Normal Distributions
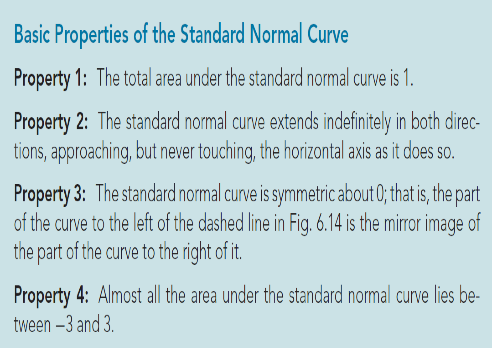
Basic Properties of the Standard Normal Curve
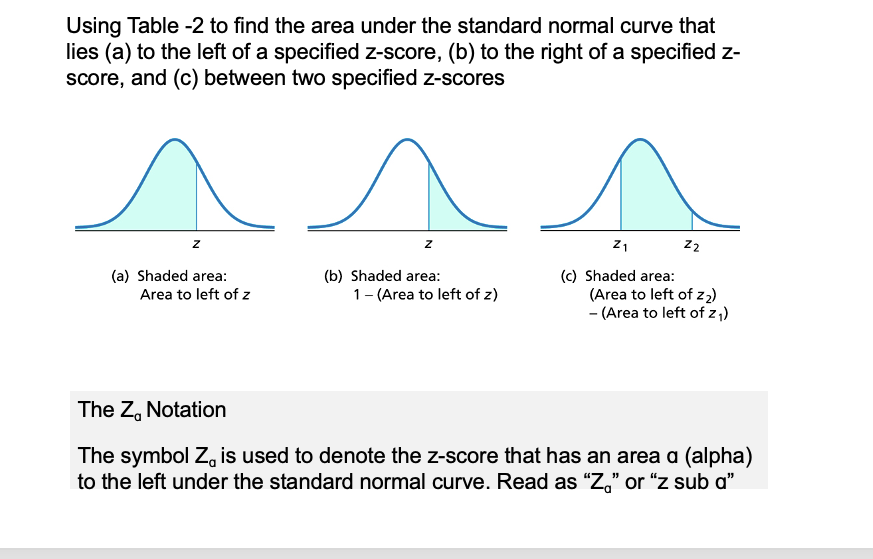
Shaded Area Figure
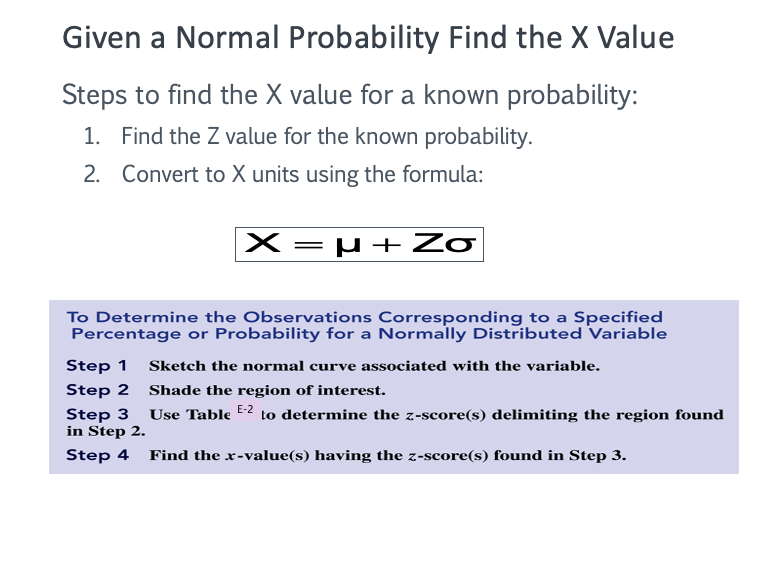
Finding the X Value
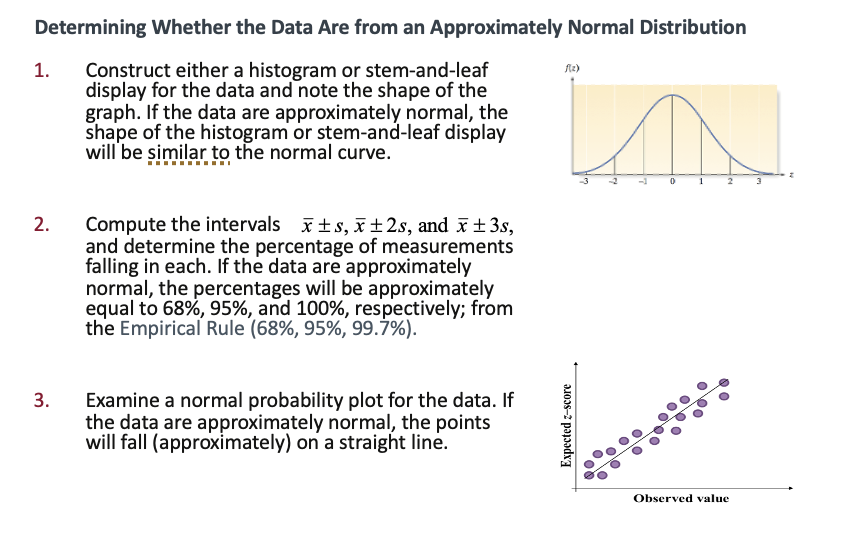
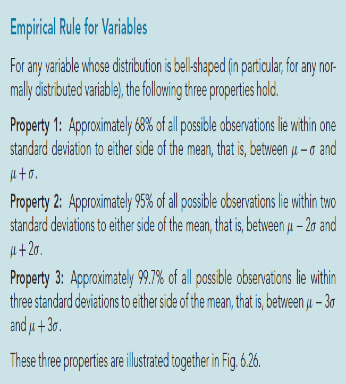
Empirical Rule for Variables
Determing Whether the Data are from an Approximately Normal Distribution