Econ1001
1/16
There's no tags or description
Looks like no tags are added yet.
Name | Mastery | Learn | Test | Matching | Spaced | Call with Kai |
|---|
No analytics yet
Send a link to your students to track their progress
17 Terms
Basic economic problem
Infinite wants but finite resources
Correlation and causation
Correlation: when two or more factors are observed to be moving in the same direction
Causation: A change in one variable brings a change in another
Opportunity costs
The value of the next best options forgone
Contain both implicit and explicit costs
Don't consider unrecoverable or [sunk costs] (you already spent the money or time)
Explicit and implicit costs
Explicit costs: involve direct payment (would be considered by an accountant)
Implicit: opportunities that are forgo
Marginal
This means additional or extra
- Marginal benefits: extra benefits of 1 more unit consumed
- Marginal costs: extra costs of 1 more unit consumed
Ceteris paribus
- The world is complex and entangled with each other
- To isolate the impact of one factors, we examine the impact of one change while holding everything else constant
Correlation and causation
correlation: when two or more factors are observed to be moving in the same direction.
- eg. fire truck and fire might be at the same place, doesn't mean that one caused another
- Causation: A change in one variable bring a change in another
Gain from trade
Proposition that trade makes people better off, allocate good and services to those who valuet it the most.
eg. adam 10$ bike, Eve willing to buy for 100$. Adam sell for 50$ and make a surplus of 40$, Eve loses 50$ but now has a bike that they value at 100$.
PPF
Production possibility frontier, map out all the possible combinations of the quantity of 2 goods that an individual or country can make if all resources are used

PPF notation
Y and X are the product
Y and x bars are the maximum production of each product individually
A is an efficient use of resources, fully utilized or maximum
B is possible to produce but isn’t fully utilizing the resources
C is unattainable
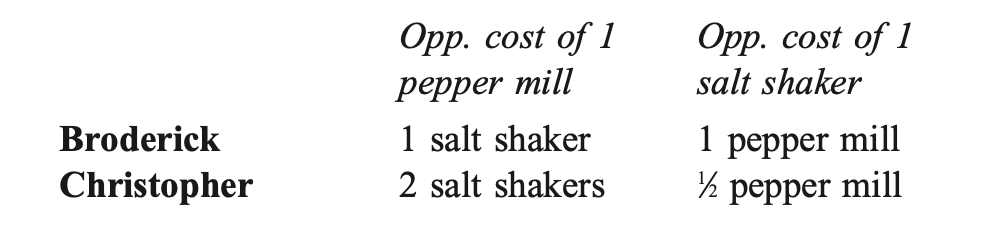
Absolute and comparative advantage
We say that Party A has an absolute advantage over Party B in the production of a good if, for a given amount of resources, A can produce a greater number of that good than B.
We say that Party A has a comparative advantage over Party B in the production of a good if A’s opportunity cost of producing that good is lower than B’s opportunity cost.
eg. B has an absolute advantage in both, C has a comparative advantage in ss and B has CA in pm

Competitive market
The actions of choices of individua; consumers cannot affect the price in the market
Willingness to pay (WTP)
As consumer derives some benefits from consuming a good or service
This can be measure using WTP
What is the most that they will be WTP, that is how much the consumer value it in monetary terms
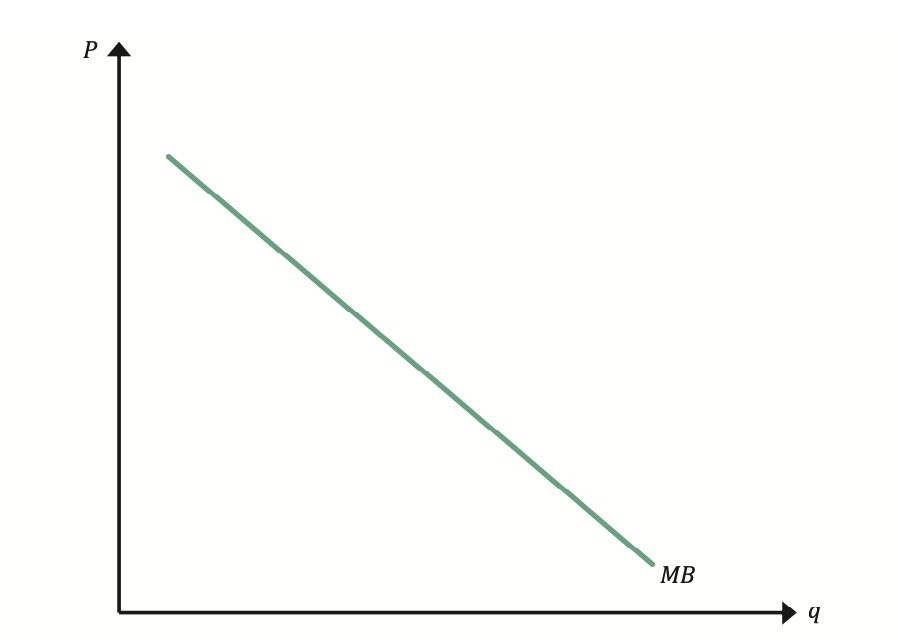
Marginal benefits
Eg. Adam orders 3 coffee, and his WTP is 4 for the first, 3, and 2 for the second and third. The total benefit is 9, MB ( extra benefit) is 4 for the 1st, 3 for the 2nd, 2 for the 3rd
MB usually declines with each additional unit consumed, this is called diminishing marginal benefit. Represented by a downward demand curve
Individual demand
Quantity of a good or service that a consumer is willing and able to buy at a certain price
The consumer will buy a unit at P=MB, P>MB exceeds their WTP
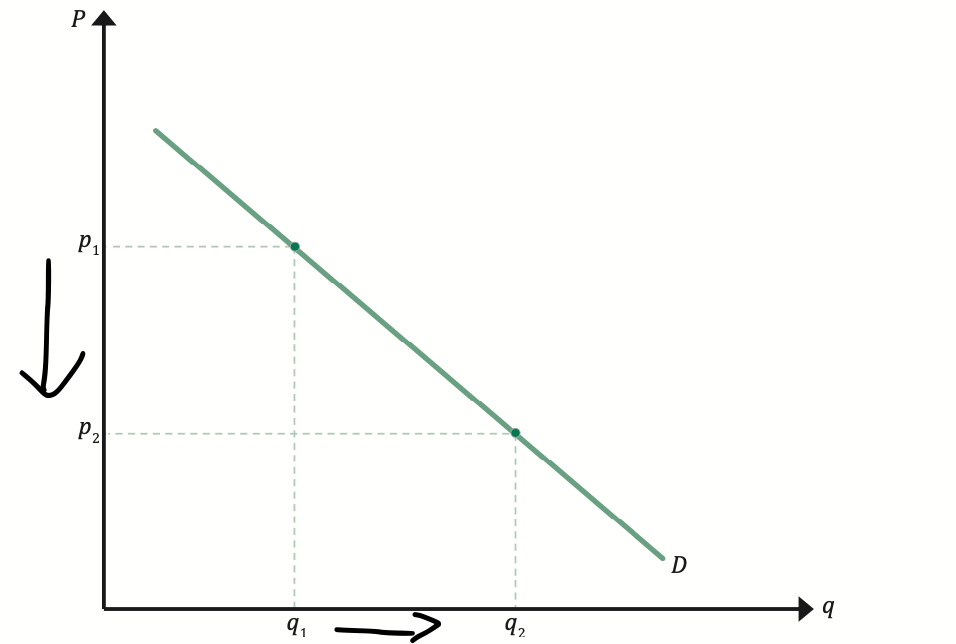
The higher the market price, the lower the demand, the law of demand
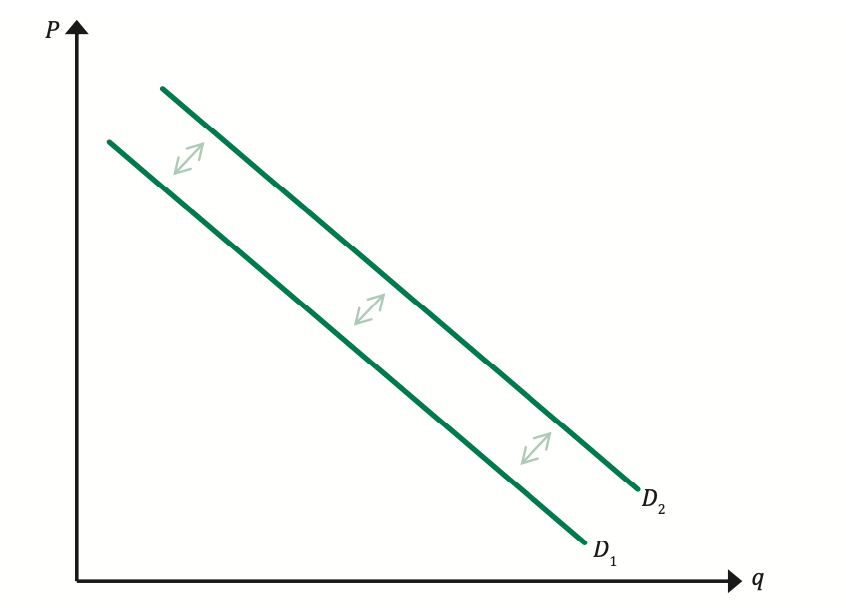
Change in quantity demanded and change in demand
If price change which cause the quanity to change, we call this a change in quantity demanded. This is represented by a movement on the curve
If there any external factor which cause a change in demand, we call this a change in demand. This is represented by a shift in the curve
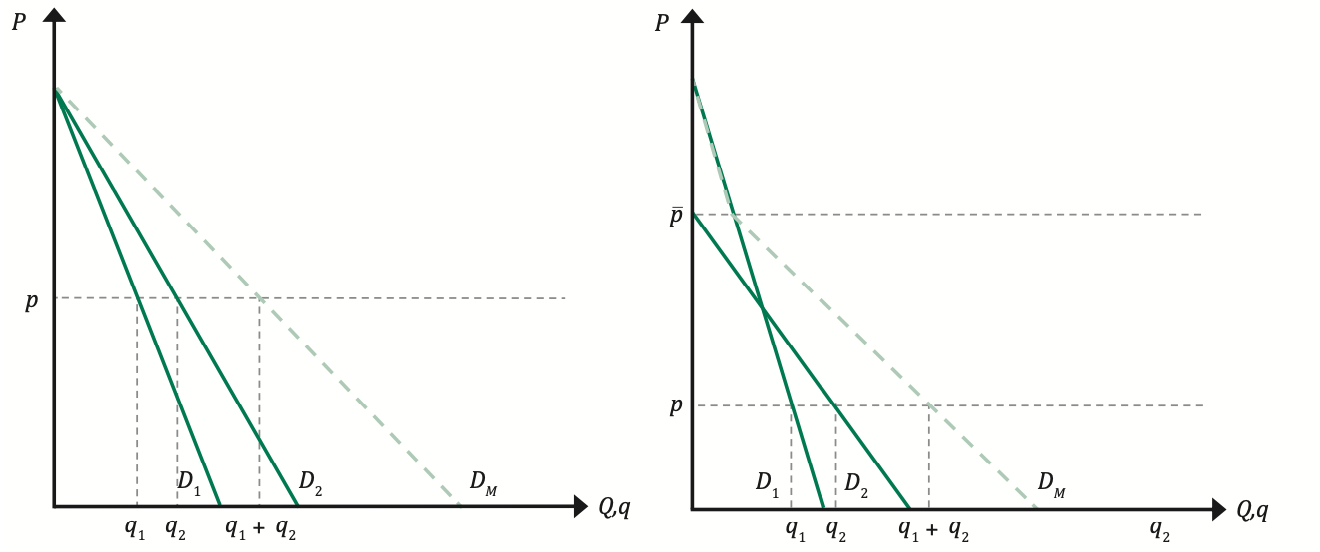
Market demand
The market demand curve (DM) can be derived by summing horizontally the individual demand curves (D1 and D2). In the first graph, both individual demand curves have the same P-intercept. If this is the case, then for every price p, the quantity demanded by the market will be the sum of individual consumer demand (that is, q1 + q2). In the second graph, the individual demand curves have different P-intercepts. Above the price p–, the quantity demanded by individual 2 will be zero; therefore, in this range, the market demand curve follows the individual demand curve for consumer 1. Below the price p–, the quantity demanded by both consumers is positive; in this range, the quantity demanded by the market will be the sum of individual consumer demand (that is, q1 + q2)