Week 10: Non-parametric tests
1/42
There's no tags or description
Looks like no tags are added yet.
Name | Mastery | Learn | Test | Matching | Spaced | Call with Kai |
|---|
No analytics yet
Send a link to your students to track their progress
43 Terms
What are the assumptions of parametric tests?
• Underlying probability distributions, e.g., normal distribution
• DV measured at interval or ratio level
• No outliers
• Homogeneity of variances (specific to independent t-test) - variance around the mean should be similar
• Linearity (specific to correlation)
What happens when assumptions for parametric tests are not met?
Data might be non-normal (skewed/multi-modal)
Data might not be at the required level
There might be outliers
Sample size might be too small
There may be unequal sample sizes if using groups
What is a positive skew in data distribution?
A distribution where the peak is extended to the left.
What is a negative skew in data distribution?
A distribution where the peak is extended to the right.
What is a multimodal distribution?
A distribution with multiple peaks.
How do non-parametric tests differ from parametric tests?
Non-parametric tests are 'distribution free' and do not rely on normal distribution.
How do non-parametric tests work?
• ‘Distribution free’ - doesn't rely on the data being normally distributed
• Ranks of data - puts into order
• Outliers have little impact
• They analyse the same research question/ hypotheses as parametric tests.
-> Less powerful than parametric tests
Name 3 examples of non-parametric tests and their alternative parametric statistical test
Man-Whitney U: Alternative to the independent samples t-test
Wilcoxon signed ranked: Alternative to the related samples t-test
Spearman's Rho: Alternative to the Pearson’s Product Moment Correlation
What type of relationship does Spearman's Rho assess?
It assesses a monotonic relationship, where variables tend to move in the same direction but not at the same rate.
When is Spearman's Rho appropriate to use?
Non-normal distribution of data, doesn't plot normally
Interval, ratio or ordinal data
Small sample size
Outliers
-> Ranks the x and y value separately and performs a correlation on the ranked variables
What does a Spearman's correlation of .84 indicate?
It indicates a large effect size.
What is the reporting format for Spearman's correlation results?
1. State what type of correlation has been performed, the variables correlated, and state the direction of the relationship found
2. Report the test statistic, df, statistical significance
3. Report the effect size (Cohen’s r s )
4. Comment on the direction of the relationship
What are the requirements for using the Mann-Whitney U test?
• When we have two unpaired groups
–Between-participants/ independent/ unrelated.
–Participants perform in one condition.
Non-normal distribution of data
Interval, ratio or ordinal data
Small sample size
Outliers
What does the Mann-Whitney U test calculate?
It ranks all values, sums the ranks in each group, calculates mean ranks, and computes the difference in ranks and associated p value.
What is the significance of effect sizes in non-parametric tests?
Effect sizes indicate the magnitude of differences or relationships between groups.
How is the Mann Whitney-U test calculated?
• It ranks all the values regardless of group/ condition.
• Sums the ranks in each group.
• Calculates the mean rank of each group.
• Computes the difference in ranks and associated p value
• The resulting test statistic is denoted by a U
What is the purpose of using boxplots in data analysis?
To visualise outliers and the distribution of data.
What does Cohen's effect size classification indicate?
Small effect sizes are not visible, medium are visible, and large are easily perceptible.
What is the main advantage of non-parametric tests?
They are less affected by outliers and do not require normal distribution.
What is the main limitation of non-parametric tests compared to parametric tests?
They are generally less powerful than parametric tests.
What is the significance of the sample size in non-parametric tests?
Small sample sizes can affect the reliability of the results.
What does 'ranks of data' mean in the context of non-parametric tests?
It refers to ordering the data values to perform analyses without relying on their actual values.
What is the alternative hypothesis regarding lecture-based and problem-based learning?
The medians for the enjoyment of lecture-based learning and problem-solving will be different.
What statistical test is used to compare the enjoyment ratings between two groups?
Mann-Whitney U test.
What does a significant p-value (p=0.04) indicate in the Mann-Whitney U test?
There is a significant difference in enjoyment ratings between lecture-based and problem-based learners.
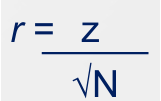
How to calculate the effect size for a Mann-Whitney U test?
Convert the z score into the effect size, r
How to formally report the statistical results for a Mann-Whitney U test
1. State what type of test has been performed and on what variables
2. Report the test statistic, z, statistical significance
3. Report the effect size (Cohen’s r)
4. Comment on the medians
What is the purpose of the Wilcoxon signed-rank test?
To compare two paired groups when the data is non-normally distributed.
When should the Wilcoxon signed-rank test be used?
Non-normal distribution of data
Interval, ratio or ordinal data
Small sample size
Outliers
However, it still assumes that: The samples are randomly sampled from the population
How to calculate a Wilcoxon signed ranked test?
• Calculates the difference between each pair of data (positive and negative).
• Ranks the value of the differences.
• Sums all the positive and all the negative ranks.
• Computes the difference between the sums of ranks and associated p value.
What is reported instead of mean values when reporting non-parametric test results?
Medians for descriptive statistics.
What is the significance of the Asymptomatic (Asymp.) value in SPSS output?
It is based on large samples.
What should be reported when presenting results of a Mann-Whitney U test?
Type of test, test statistic (U), z-value, statistical significance (p), and effect size.
What is the main assumption of the Wilcoxon signed-rank test?
The samples are randomly sampled from the population.
What is the significance of a large effect size in statistical tests?
It indicates a strong relationship or difference between the groups being compared.
What does the term 'Md' stand for in the context of medians?
Median value.
What is the main difference between parametric and non-parametric tests?
Parametric tests assume normal distribution, while non-parametric tests do not.
What is the role of ranks in the Wilcoxon signed-rank test?
Ranks are used to calculate the difference between paired data points.
What is the significance of the p-value in hypothesis testing?
It indicates the probability of observing the results if the null hypothesis is true.
How do you interpret a p-value less than 0.05?
It suggests that the results are statistically significant.
What is the purpose of calculating effect size in statistical tests?
To measure the strength of the relationship or the size of the difference between groups.
What does a negative z-value indicate in statistical testing?
It indicates that the observed value is below the mean of the distribution.
What is the significance of reporting medians in non-parametric tests?
Medians provide a better measure of central tendency when data is skewed.