Economics - revenues, profits and costs (3.3)
1/24
There's no tags or description
Looks like no tags are added yet.
Name | Mastery | Learn | Test | Matching | Spaced |
|---|
No study sessions yet.
25 Terms
Revenue definitions
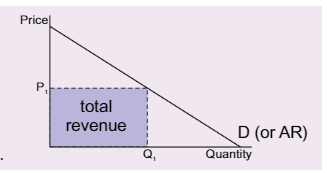
Total revenue - Total amount of money earned by a business through sales, measured by P x Q
Average revenue- TR/Q, or P
Marginal revenue- The extra revenue that a firm earns from selling one or more unit, measured by △TR/△Q
Total and average revenue diagrams
What does the total revenue curve look like?
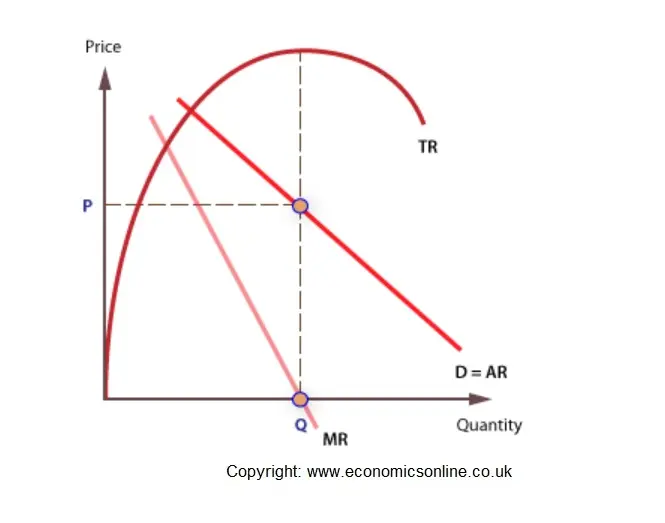
Key features of Marginal revenue curve
1) Starts at the same point as the AR curve
2) Intercepts the x-axis at half the value that AR does
3) MR must stop at the same value as the AR curve
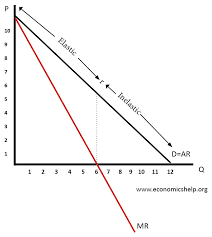
How and why does price elasticity change along the demand (AR) curve?
Along the AR curve, PED goes from being elastic, to unitary elastic, to inelastic as we go down the curve. This is because, at a higher price, a % change in price will have a big impact, causing a large change in demand.
However, at a smaller price, a % change will have a smaller impact, causing a smaller change in demand.
Costs definitions
Variable costs - Costs which vary with output (Raw materials, packaging, wages etc.)
Fixed costs - Costs which don’t vary with output levels (Rent, salaries, machinery etc.)
Marginal costs - the additional cost of selling one extra unit. Measured by △TC/△Q
Total costs - TFC + TVC
What is the difference between the short run and long run?
In the short run, at least 1 factor of production is fixed. However, in the long run, all factors are variable.
In the long run, there are only variable costs.
What does the marginal cost graph look like and why?
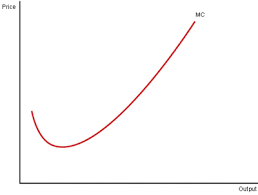
At the start of the graph, the MC decreases due to specialisation leading to an increase in productivity. However, after this point there are diminishing marginal returns. This is where, as more factors of production are employed, productivity will decrease.
Is diminishing marginal returns in the short run or the long run?
Diminishing marginal returns only occurs in the short run, as atleast 1 factor of production is fixed. However, in the long run, all factors are variable, and so we can accommodate for changes in our factors of production to increase productivity.
What do the ATC and MC curves look like and why
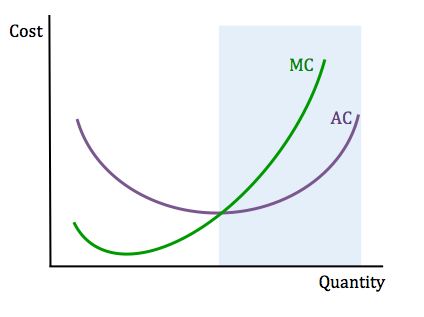
During the first half of the graph, MC is below AC, and so as quantity decreases AC will decrease. Therefore, AC is at its lowest when AC=MC. Past this point, MC is higher than AC, and so will drag it upwards as quantity increases.
What does the TFC and AFC curve look like and why?
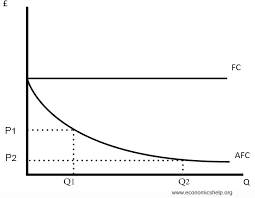
The total fixed cost curve will remain the same throughout, as fixed costs won’t vary with output. As AFC is TFC/Q, as Q increases, it will get lower and lower, but never reaching 0.
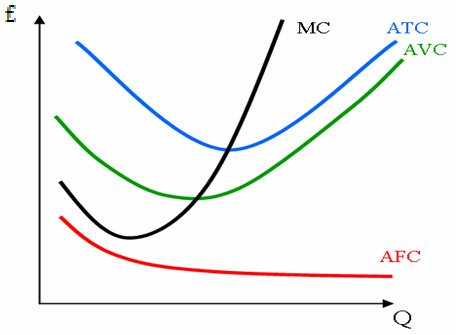
Full costs curve
What does the lrac curve look like and why?
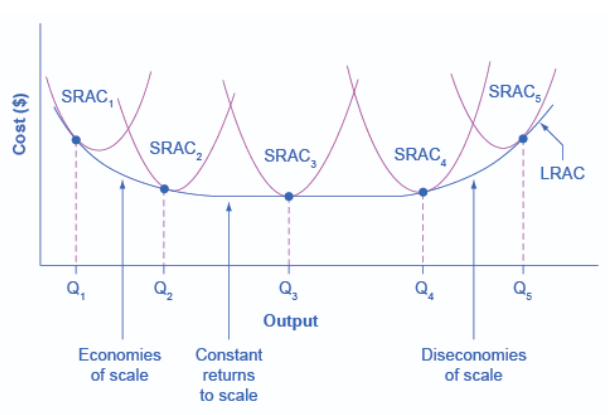
The LRAC curve is made up of different SRAC curves over time.
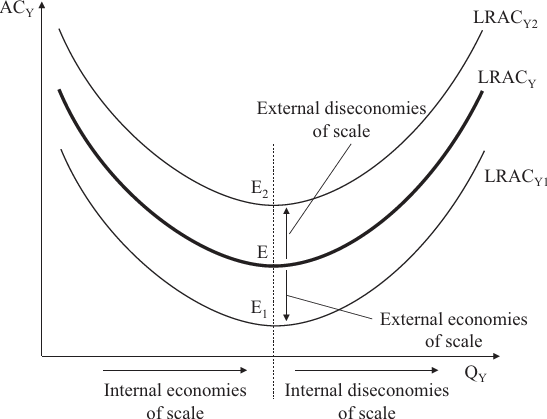
What are the 2 types of economies of scale?
Internal - When a firms LRAC decreases as a firms output increases
External - When a firms LRAC decreases as industry output increases
What is the Minimum Efficient Scale (MES)
The MES is the lowest point on the LRAC curve and is when internal economies of scale are fully used.
What are the 6 internal economies of scale?
Risk-bearing - Larger firms are able to operate in various markets, reducing the cost of failure
Managerial - Larger firms are able to employ specialist managers who are able to increase productivity
Financial - Larger firms are seen as less risky, so are able to receive loans from banks at a lower interest rate
Purchasing - Larger firms are able to bulk buy products, decreasing the cost per unit
Technical - When big firms are able to invest in specialist capital to increase productivity
Marketing - When firms spread their marketing costs over larger output, lowering their average marketing costs
What are the 3 types of diseconomies of scale?
Alienation - When workers feel less attached and therefore committed to the business, decreasing their motivation and productivity
Bureaucracy - All of the paperwork, filing, managers and secretaries a firm has to pay for as it expands.
Communication - Within a large business, communication can be slow, decreasing the efficiency and productivity of the business.
How is external economies of scale shown on a graph?
What does a standard cost-revenue diagram look like?
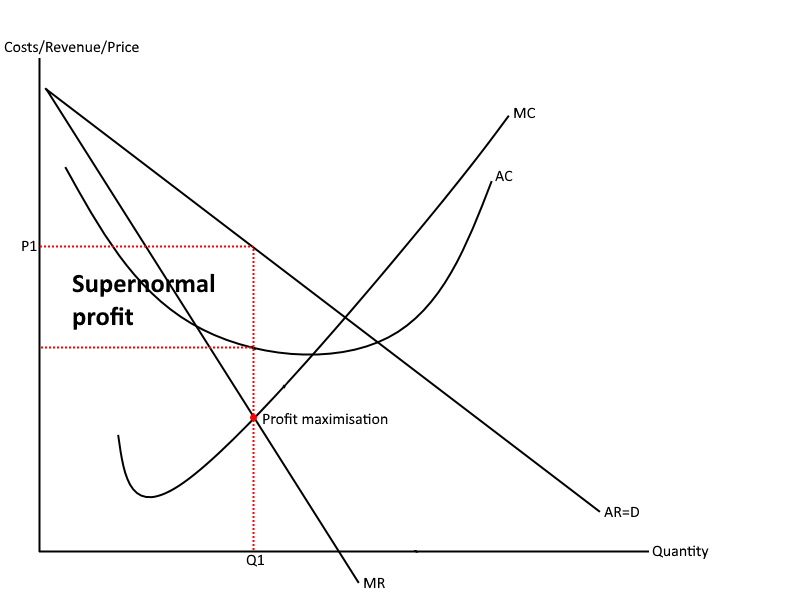
How is revenue maximisation shown on the Cost/Revenue graph?
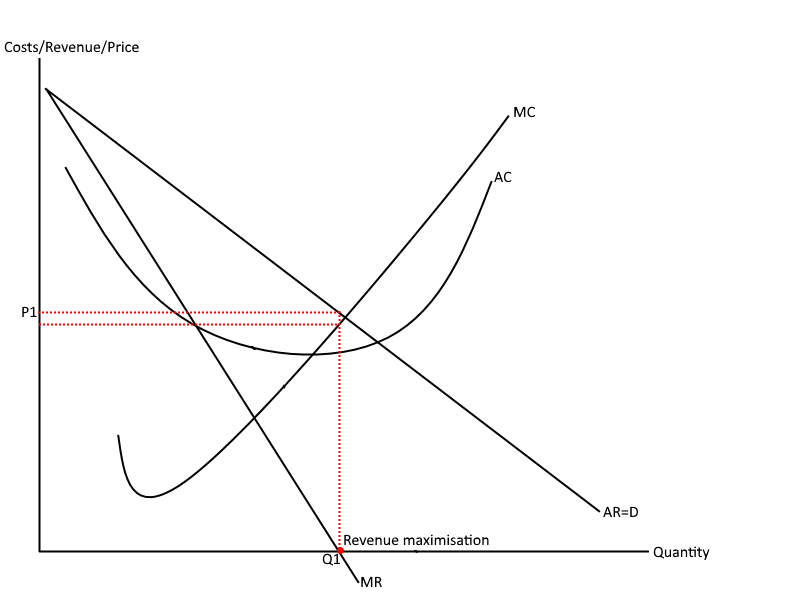
Revenue maximisation is at the point where MR=0, meaning that producing any more quantity will reduce revenue.
How is sales maximisation shown on a graph?
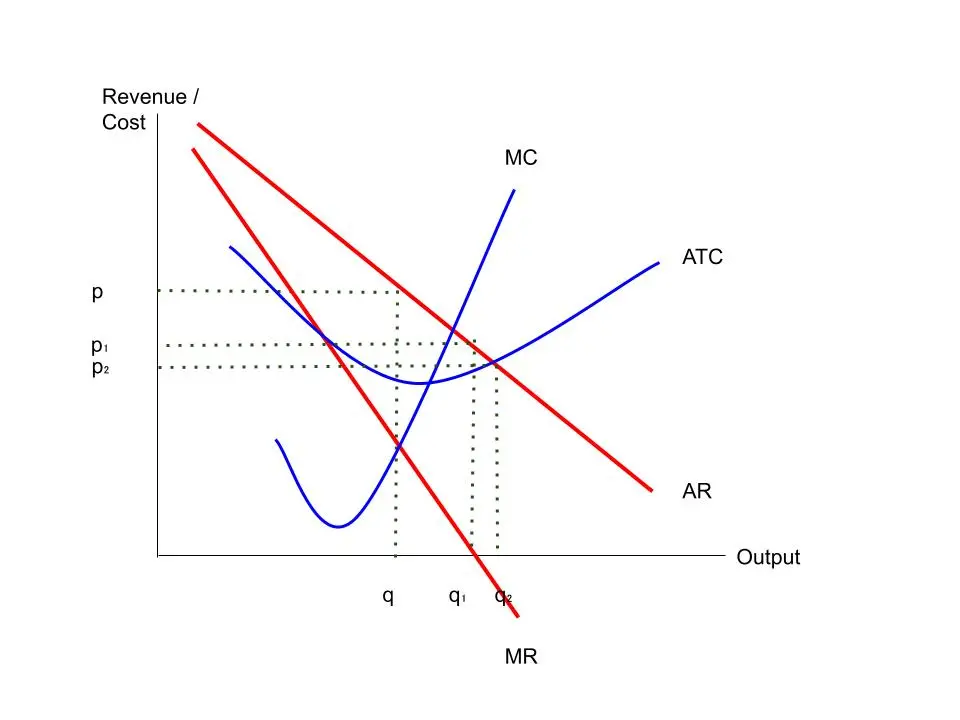
Sales maximisation is at the point AC=AR. This is the highest output that a firm could produce at without making subnormal profit.
What would be the difference on the graph if fixed costs increased as opposed to variable costs?
If fixed costs were to increase, then the AC curve would shift upwards. However, if variable costs were to increase, then both the AC and MC curve would shift up.
What is the short run shut down point and why?
The short run shut down point is when AVC=AR. If a firm is producing above this, then they shouldn’t shut down. This is because they are making money on each good sold, covering their variable costs and are contributing towards their fixed costs.
How is the short run shut down point shown graphically?
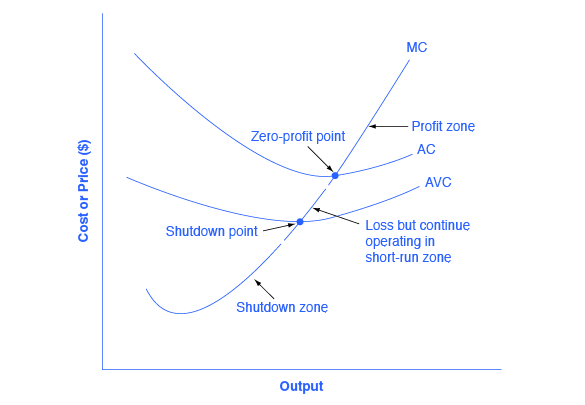
Draw AR and MR curves when drawing this diagram.
What is different between the short run and long run shut down point?
As there are no fixed costs in the long run, the long run shut down point is when ATC=AR.