Proteomics
1/29
There's no tags or description
Looks like no tags are added yet.
Name | Mastery | Learn | Test | Matching | Spaced | Call with Kai |
|---|
No analytics yet
Send a link to your students to track their progress
30 Terms
Proteins
A chain of amino acids (also known as a polypeptide).
20 amino acids.
Humans can produce 10 of these; the other amino acids are supplied by food (essential amino acids).
They are classified by their physical and chemical properties.
Translation: RNA to protein
mRNA carries the genetic code from DNA in sets of three bases called codons.
Each codon corresponds to one amino acid, matched by tRNA during translation.
Ribosomes read the mRNA and link amino acids together to form a protein.
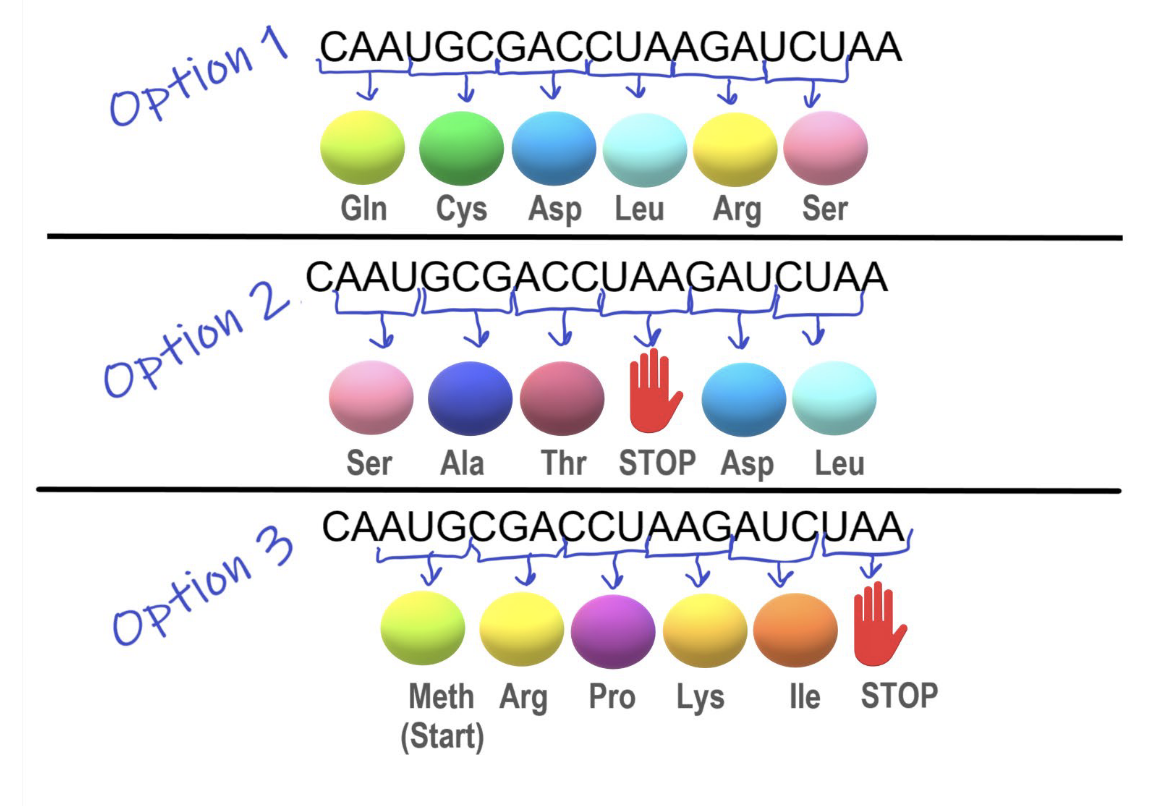
Translation begins with the start codon (AUG).
Translation ends with the stop codon (UAA|UAG|UGA).
Open reading frame (ORF):
Groupings of codons.
There are three possible reading frames on mRNA.
Protein structure
Primary structure: sequences.
Secondary structure: regular substructures (alpha-helix/beta sheets).
Tertiary structure: 3D structure of a single protein molecule.
Quaternary structure: larger assembly of several protein molecules or polypeptide chains, usually called subunits in this context.
Functional: transcription factors, receptors, ligands, signaling proteins, kinases, etc.
Post-translation modifications
Chemical modification of a protein after its translation.
They are the key mechnisms to increase proeomic diversity.
Genomics vs. proteomics
Genomics: the study of the organism's entire DNA (genome), which provides the relatively static blueprint for life.
Proteomics: the study of the entire set of proteins (proteome), which are the highly dynamic functional molecules that determine the cell's actual state and activity.
Transcriptomics vs. proteomics
Transcriptomics is the study of mRNA transcripts which indicates the potential cellular activity and is easier to measure.
Proteomics is the study of all proteins which reflects the actual biological function, disease state, and clinical outcomes.
Gene vs. protein biomarkers
Gene expression (mRNA level):
Measures which genes are being transcribed into RNA.
Indicates potential cellular activity.
Easier, faster, and cheaper to measure (e.g., RNA-seq).
Good for detecting early molecular changes before symptoms.
mRNA levels do not always correlate with protein levels or actual function.
Protein expression:
Measures actual functional molecules carrying out cellular processes.
Reflects real biological activity and disease state.
More directly linked to phenotype and clinical outcomes.
Technically complex and proteins are less stable and harder to quantify.
Alignment of protein sequences
Protein sequence alignment compares amino acid sequences to identify regions of similarity.
Evolutionary relationships.
Predict protein structure.
Infer function.
Based on the sequence similarity.
Identify relation proteins with similar known structures and functions in the database.
Substitution matrices
A substitution matrix contains values proportional to the probability that amino acid “i” mutated into amino acid “j” for all pairs of amino acids.
Substitution matrices are constructed by assembling a large and diverse sample of verified pairwise alignments (or multiple sequence alignments) of amino acids.
Substitution matrices reflect the true probabilities of mutations occurring through a period of evolution.
The two major types of substitution matrices are PAM and BLOSUM.
PAM matrices
PAMs: point accepted mutations.
A replacement of one amino acid by another is accepted by natural selection.
Derived from global alignments of very similar sequences (at least 85% identity).
Hypothesis: it is not likely that one substitution is from several consecutive mutations.
PAM1
Constructed by analyzing closely related protein sequences
that have diverged by about 1% of accepted mutations per
amino acid position.
Collect homologous proteins with known evolutionary relationships and align them to identify positions where amino acid substitutions occurred.
Count substitution frequencies between amino acids, normalizing by how often each amino acid appears overall, to get probabilities of one amino acid being replaced by another.
Convert probabilities to log-odds scores, forming the PAM1 substitution matrix — where each value reflects how likely a substitution is compared to random chance.
PAM1 gives the probability that another specific amino acid will replace an amino acid after a given evolution interval, in which 1 PAM occurs in 100 amino acids.
PAM# →
Number of PAMs in 100 amino acids.
The number with PAM (PAM40, PAM80) refers to the evolutionary distance.
Large number → large evolutionary distance.
To get PAM80, multiply PAM1 80 times.
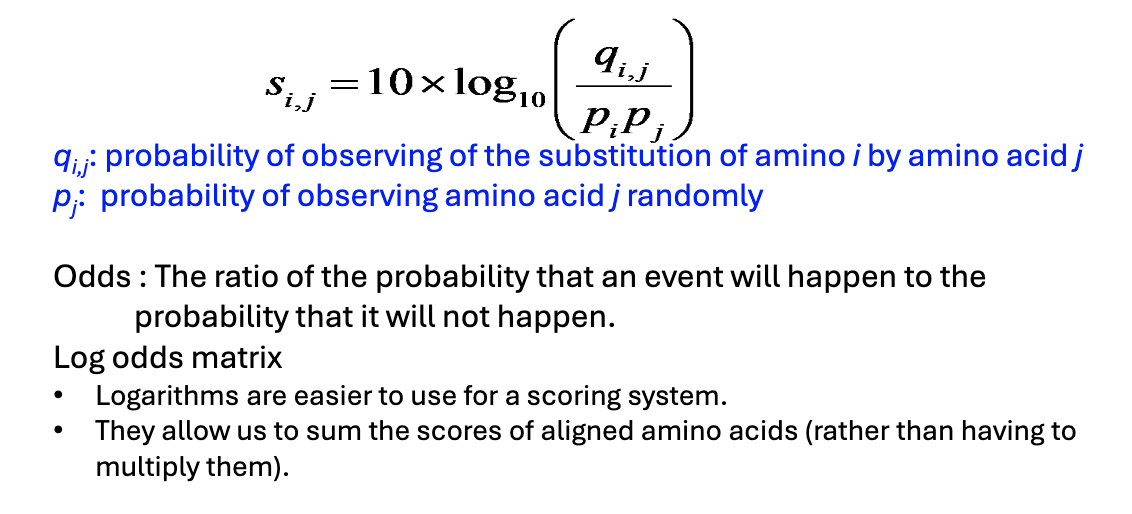
Convert probability matrix to scoring matrix - PAM1
The score of two amino acids i, j. as the log of how likely it is to observe these two amino acids (based on the empirical observation of how often they are aligned in nature) divided by the background probability of finding these amino acids by chance.
A score of +2 indicates that the amino acid substitution occurs 100.2 = 1.58 times as frequency as random substitution.
A score of 0 is neutral.
A score of -10 indicates that the amino acid substitution occurs 10-1 = 1/10 time as frequently as random substitution.
BLOSUM matrices
Block substitution matrix (BLOSUM).
BLOSUM matrices are based on local alignments (blocks).
BLOSUM62:
Sequences that are at least 62% identical are counted as a single sequence.
Scoring is mainly influenced by sequence blocks with less than 62% identity.
All BLOSUM matrices are based on observed alignments; they are not extrapolated from comparisons of closely related proteins.
BLOSUM62 is the default matrix in BLAST 2.0.
Though BLOSUM62 is tailored for comparisons of moderately distant proteins, it performs well in detecting closer relationships.
Choosing a good matrix
PAM1: Matrix calculated from comparison of sequences with no more than 1% divergence.
BLOSUM80: Matrix calculated from comparison of sequences with at most 80% identity in the blocks.
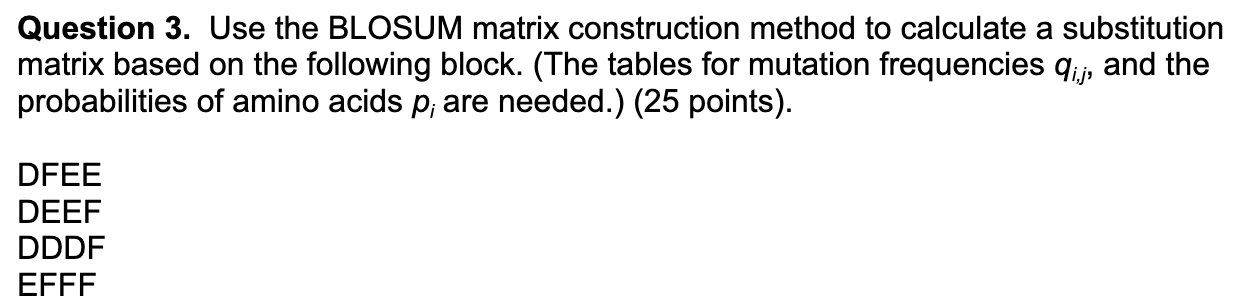
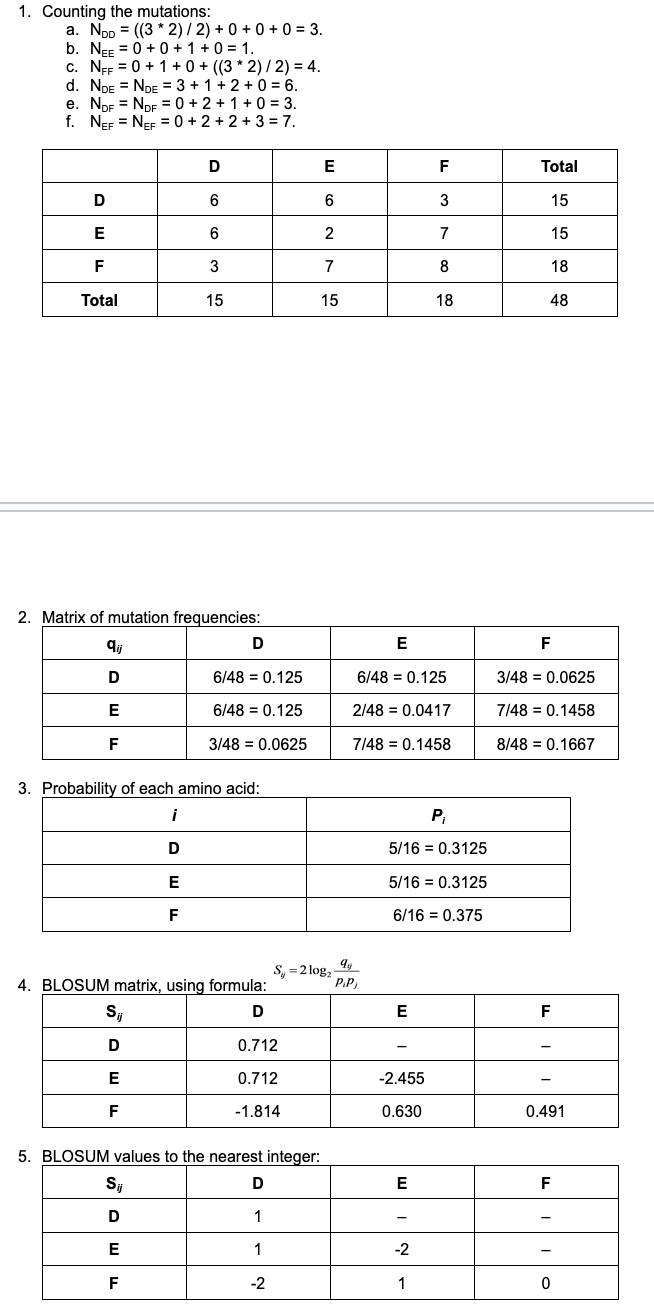
BLOSUM matrix example
Techniques to quantify proteins
Step 1: protein separation.
Step 2: protein quantification.
Step 1: protein separation
Performed by 2D gel electrophoresis.
Proteins are first resolved using isoelectric focusing according to their isoelectric point (pI) on an immobilized pH gradient (IPG) strip.
After placement of the IPG strip with resolved proteins on top of the sodium dodecyl sulfate gel, proteins are separated based on their molecular weight.
Protein spots of interest, such as those with altered staining intensity between samples, may be excised, enzymatically digested into peptides in gel, and subjected to a mass spectrometric analysis.
2D liquid chromatography:
Proteins to be analyzed by 2D-LC are separated based on two specific physicochemical properties: isoelectric point (pI) and hydrophobicity.
Step 2: protein quantification
Targeted: focuses on specific, predefined proteins or peptides (like biomarkers).
Label-free:
Unbiased, global quantification.
Detects and measures all detectable proteins in a sample without labels.
Often used in discovery proteomics → captures novel proteins and isoforms.
Step 2: protein quantification; antibody-based methods
Targeted only.
Detected specific, predefined proteins using antibodies.
Very high specificity.
Traditional antibody methods are generally low-to-medium throughput → < 10 proteins.
Examples: ELISA, Western blot, Luminex, MSD, and OLINK.
OLINK is a next-generation method that uses Promixity Extension Assay (PEA) technology where two antibodies recognize each target protein.
High throughput: up to ~5,000 proteins.
Step 2: protein quantification; mass spectrometry (MS)
Targeted and label-free.
Three components:
Ionizer: breaks proteins into charged fragments.
Mass analyzer: separates ions based on their mass-to-charge ratio (m/z).
Mass = mass(peptide) + mass(proton).
Charge = 1+.
Detector: measures the intensity of separated ions to produce a mass spectrum.
Examples: label-free MS, DIA-MS, TMT, and iTRAQ.
Step 2: protein quantification; aptamer-based methods
Targeted only.
High throughput: up to 7,000 proteins.
Example: SomaScan (SomaLogic).
Widely used in recent studies.
Protein domains
Domains are independently folding, functional units within a protein.
A single protein may contain one or multiple domains.
Each domain often carries a specific function (e.g., DNA-binding, catalytic activity, signaling).
Domains can appear in different proteins, reused like biological “LEGO blocks.”
Examples: SH2 domain (binds phosphorylated tryosines), kinase domain, and Zinc finger domain.
SH2 protein domain
Function: recognizes and binds to proteins that contain phosphotyrosine.
Role in the cell: helps proteins involved in cell signaling find their correct partners, especially in pathways activated by growth factors or immune responses.
Types of protein domains
Modular: can be rearranged in evolution to create new proteins.
One protein can contain multiple domains, each with its own structure and job → swiss army knife.
Conserved: similar sequence and structure across species.
Functional: often responsible for the protein’s main biochemical activity.
Identified by:
Sequence alignment.
Structural analysis.
Databases like Pfam, SMART, and InterPro.
Protein motifs
Motifs are short, conserved sequence patterns.
Usually smaller than domains and may not fold independently.
Often indicate a specific function or interaction.
Examples: NLA (nuclear localization signal), Walker A motif (ATP binding), and helix-turn-helix motif (DNA binding).
Domains vs. motifs
Domains: big, functional building blocks.
Motifs: small, recognizable sequence patterns that guide or support function.
Usually located within domains.
Protein families
A protein family is a group of proteins that share similar sequences, domains/motifs, functions, or evolutionary origins.
Families help classify proteins into meaningful categories.
Examples: g-protein-coupled receptors (GPCRs) → all share a common architecture of seven alpha-helices that span the cell membrane.
Protein databases
Sequence and structure database:
UniProt.
Swiss-Prot.
Protein expression databases:
GEO.
The Human Protein Atlas → tissue- and cell-specificity.
UniProt
A freely accessible database of protein sequence and functional information.
UniProtKB: universal protein resource knowledgebase.
Swiss-Prot: manually annotated and reviewed.
One record per gene, per species.
TrEMBL: automatically annotated and is not reviewed.
One record for 100% identical full-length sequences in one species.
UniParc: a comprehensive and non-redundant database that contains most of the publicly available protein sequences in the world.
One record for 100% identical sequences over the entire length, regardless of species
UniRef: clustered sets of sequences from UniProtKB and selected UniParc records.
One record for 100% identical sequences, regardless of species. Sequence fragments are included.