Chapter 19: The Phillips Curve and Inflation
1/70
There's no tags or description
Looks like no tags are added yet.
Name | Mastery | Learn | Test | Matching | Spaced |
|---|
No study sessions yet.
71 Terms
Three causes of inflation
1. Inflation expectations
2. Demand-pull inflation
3. Supply shocks and cost-push inflation
the rate at which average prices are anticipated to rise next year
inflation expectations
If they expect inflation to be 2% next year, then it’s likely the prices of their key inputs will also rise by 2%
Thus, they’ll raise next year’s prices by 2% to keep up
Inflation expectations
inflation resulting from excess demand
demand-pull inflation
When demand outstrips a business’ productive capacity, it raises prices
demand-pull inflation
When business is booming, it can take over an hour to get a table. In the long run
open new restaurants
When business is booming, it can take over an hour to get a table. In the short run
raise prices
When demand exceeds the economy’s productive capacity, prices rise
scaling up
widespread price increases create
demand-pull inflation
inflation that results from an unexpected rise in production costs
cost-push inflation
The original catalyst for cost-push inflation is a
supply shock
Demand-pull inflation increases the
output gap
Inflation =
expected inflation + Demand-pull inflation + cost-push inflation
Two key factors for setting prices
marginal costs and competitor’s prices
If people expect high inflation, they’ll get
high inflation
If people expect low inflation, they’ll get
low inflation
Inflation expectations lead and actual inflation
follows
The goal of monetary policy is to try to shape
inflation expectations
suggests what investors expect inflation to be over the next 10 years
10-year break-even rate
ongoing survey of professional economists regarding their inflation forecasts
economists’ forecasts
Three ways to track inflation expectations
surveys, economists’ forecasts, financial markets
people who expect recent levels of inflation to continue
adaptive expectations
people who believe the Fed will deliver on its promise to ensure inflation stays around 2%
anchored expectations
people who use all available data to come up with the most accurate forecast possible
rational expectations
people who revisit their views on inflation only irregularly, so they stick with their previous view
sticky expectations
when the quantity demanded at the prevailing price exceeds the quantity supplied
excess demand
can also pull inflation below inflation expectations when demand is unexpectedly weak
demand-pull inflation
when the quantity demanded at the prevailing price is below what’s supplied
insufficient demand
When demand matches the economy’s productive capacity, there’s no
demand-pull inflation, inflation = inflation expectations
Demand-pull inflation is driven by the
output gap
When there’s a positive output gap, there’s
excess demand
When there’s a negative output gap, there’s
insufficient demand
Unexpected inflation =
inflation - inflation expectations
Draw Phillips Curve
y
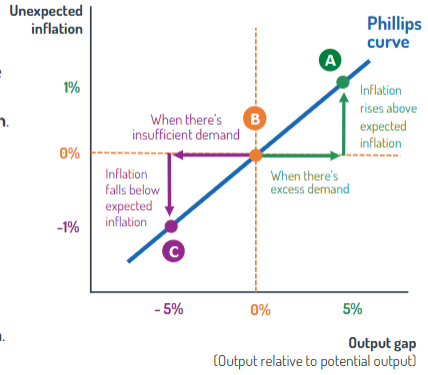
Higher output relative to potential leads to greater
inflationary pressure
predicts how far inflation will diverge from expected inflation
phillips curve
If unexpected inflation is (BLANK) actual inflation equals expected inflation
zero
If unexpected inflation is (BLANK) actual inflation will be less than expected inflation
negative
Negative on the Phillips curve does not mean that actual inflation is
negative
If unexpected inflation is (BLANK) actual inflation will be greater than expected inflation
positive
4%
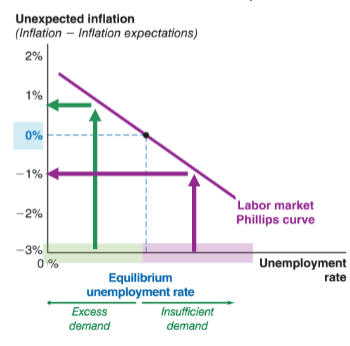
high unemployment means
below potential, low unexpected inflation
low unemployment means
above potential, high unexpected inflation
equilibrium unemployment rate means
at potential, zero unexpected inflation
Draw labor market Phillips curve
y
When an unexpected boost to production costs pushes sellers to raise their prices
cost-push inflation
Any factor that leads to an unexpected rise in production costs will cause the Phillips curve to
shift upward
Any change in production costs that leads suppliers to change the prices they charge at any given level of output
supply shocks
supply shocks shift the
Phillips curve
Three causes of supply shocks that shift the Phillips curve
input prices, productivity, exchange rates
input prices, productivity, and exchange rates all focus on
unexpected changes
Draw rising and falling input prices on the Phillips curve
y
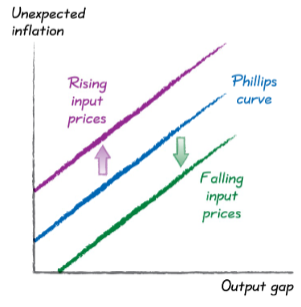
If the prices of your inputs rise it
increases inflation and shifts Phillips curve up
If the prices of your inputs fall it
decreases inflation and shifts Phillips curve down
Important input prices that can spark cost-push inflation
oil and commodity prices, rising wages
a cycle where higher prices lead to higher nominal wages, which leads to higher prices
wage-price spiral
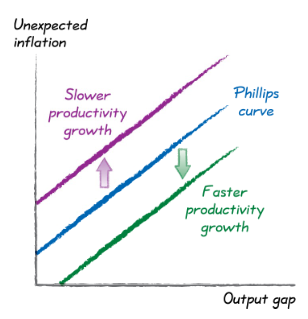
Faster-than-expected productivity growth lowers your
marginal costs
Faster productivity growth causes the Phillips curve to
shift down
Slower productivity growth causes the Phillips curve to
shift up
Draw faster and slower productivity growth on the Phillips curve
y
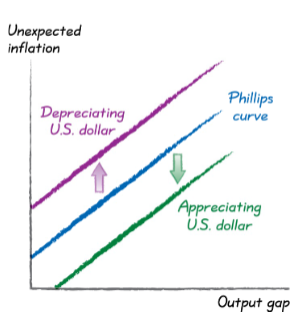
A depreciating U.S. dollar causes the Phillips curve to
shift up
An appreciating U.S. dollar causes the Phillips curve to
shift down
When the the U.S. dollar depreciates, it means the U.S. dollar becomes (BLANK) for foreigners to buy
cheaper
Draw depreciating and appreciating U.S. dollar on Phillips curve
y
When the U.S. dollar depreciates, foreign goods are more expensive for people in the United States
direct effect
More expensive foreign goods lead to higher prices on domestic goods
indirect effect
Demand-pull inflation leads to (BLANK) the Phillips curve
movement along
Cost-push inflation leads to a (BLANK) in the Phillips curve
shift
(BLANK) neither shift nor cause movement along the Phillips curve
inflation expectations
Inflation expectations are a key (BLANK) factor in determining overall inflation
long-run
Phillips curve focuses on the
short run