APHG - Unit 6 (Chapters 11 & 10)
0.0(0)
Card Sorting
1/101
There's no tags or description
Looks like no tags are added yet.
Last updated 1:21 AM on 4/20/23
Name | Mastery | Learn | Test | Matching | Spaced | Call with Kai |
|---|
No analytics yet
Send a link to your students to track their progress
102 Terms
1
New cards
Industrial Revolution
A movement towards new sources of energy (i.e steam, coal, petroleum) that started in Great Britain in the late 1700’s and took hold throughout Europe and the U.S. in the 1800’s.
2
New cards
Cottage Industries
home based family manufacturing had become common in 1500’s and 1600’s (i.e. cotton and wool thread spun at home). Richard Arkwright invented a running-water-powered machine that untangled cotton prior to the spinning process in 1768.
3
New cards
Steam Engine
Engine created in 1769 that could supply power much more efficiently than running water or human and animal power because coal - energy source for the engines - was plentiful in the UK.
4
New cards
Railroads in the Industrial Revolution
Iron manufacturing took off thanks to the steam engine and was able to be mass produced. Because of this, a railroad system - using steam powered locomotives - both derived from industrial revolution advances and diffused the practices throughout Europe.
5
New cards
Infrastructure
The services and facilities needed for an economy to function (i.e. buildings, roads, electricity, water, waste disposal).
6
New cards
Economies of Scale
Increase in efficiency as the number of goods increases, which means that larger companies can produce more cheaply.
7
New cards
Commodity Chain
The series of links connecting the many places of production and distribution that results in a commodity which is sold to a large market.
8
New cards
Locations of 3/4 of the World’s Manufacturing
Europe, North America, and East Asia account for 1/4 each of the world’s manufacturing.
9
New cards
Rhine Valley Manufacturing
Near large coal fields, so iron and steel production stimulated other production. This made it the most important, central industrial area.
10
New cards
First Manufacturing in the US
Manufacturing arrived in the US later than in Europe, but it grew significantly quicker. The first manufacturing was the textile industry, and iron and coal supplies in the US northeast helped industry grow. Industry in the US also spread west thanks to efficient transportation.
11
New cards
New England Manufacturing
The oldest industrial area of the US. Cotton was imported from the southern states, and finished products were shipped to Europe.
12
New cards
Middle Atlantic Manufacturing
The largest U.S, market; its industries need proximity to consumers (i.e. finance, communications, and entertainment)
13
New cards
Pittsburgh Manufacturing
The leading steel producer of the 1800’s due to its proximity to Appalachian iron and coal.
14
New cards
Western Great Lakes Manufacturing
Centered on Chicago to take advantage of convergence of transportation routes (i.e. railroad, water, air, highway) and produced machinery, automobiles, and furniture.
15
New cards
Manufacturing in Japan
became an industrial power in the 1950’s and 60’s selling low cost goods and paying low wages but shifted to high quality and highly skilled technical manufacturing in the 1970’s.
16
New cards
Manufacturing in China
Has the largest supply of low cost labor and is the largest supplier of textiles, clothes, and steel. Opened their labor market to transnational corporations in the 1990s.
17
New cards
High-Tech Corridors
Areas along or near major transportation arteries that are devoted to the research, development and sale of high-technology products (i.e. Silicon Valley)
18
New cards
Technopole
A center of high tech and information technology
19
New cards
Call Centers
Centralized offices used for the purpose of receiving and transmitting a large volume of phone calls. With increased networking, call centers can be anywhere in the U.S. and world, but are located in places with low labor costs (i.e. India)
20
New cards
Maquiladoras
Large American owned factories that produce and assemble goods for export back to the U.S. NAFTA allowed the growth of these.
21
New cards
Least-Cost Theory
Theory of *industrialization* that demonstrates how industries attempt to locate their manufacturing at the place where different costs can be brought as low as possible.
**L:** labor
**A:** agglomeration
**T:** transportation
**L:** labor
**A:** agglomeration
**T:** transportation
22
New cards
Agglomeration
The concentration of many industries and services in one area (many industries and services complement each other).
23
New cards
Situation/Site Factors
**Site Factors:** location factors related to the costs of factors of production inside a plant
**Situation Factors:** location factors relating to the transportation of materials into and from a factory
**Situation Factors:** location factors relating to the transportation of materials into and from a factory
24
New cards
Spatially Variable Costs
Costs that change depending on how close one is to a particular part of industry.
25
New cards
Proximity to Inputs
May be cheaper to locate closer to the inputs when an industry is a bulk reducing industry.
26
New cards
Bulk-Reducing Industry
An industrial process which reduces the bulk of the inputs through the process of manufacturing. (i.e. copper, in which the mining of copper ore eliminates the waste, resulting in fine copper particles; steel mills)
27
New cards
Proximity to Markets
Manufacturing tries to locate close to markets if they are a bulk-gaining industry.
28
New cards
Bulk-Gaining Industry
An industrial process that adds bulk to the inputs through the process of manufacturing. (i.e. fabricated machines plants; beverages and bottling plants)
29
New cards
Just-in-Time Delivery
Parts delivered as close to the time needed as possible (desirable for items that the purchasers don’t want to take up space in inventory). (i.e. car seat manufacturers)
30
New cards
Four Different Transportation Types
**Truck:** for short distances, especially one day delivery
**Train:** many day travel, particularly coast to coast (no driver rest needed)
**Ship:** slow, but very economical for very long distances
**Plane:** most expensive for all distances; speedy delivery of small-bulk, high value goods
**Train:** many day travel, particularly coast to coast (no driver rest needed)
**Ship:** slow, but very economical for very long distances
**Plane:** most expensive for all distances; speedy delivery of small-bulk, high value goods
31
New cards
Containerization
Standardization of shipping into shipping containers that can be shipped via sea, air or rail.
32
New cards
Break-of-Bulk Point
Locations where transfer between transportation modes is possible.
33
New cards
Three Leading Energy Sources Now
**Coal:** as North America and Europe developed rapidly in the late 1800s, coal supplanted wood as the leading energy source in these regions.
**Natural Gas:** originally burned off as a waste product of petroleum drilling, natural gas is now used to heat homes and to produce electricity.
**Petroleum:** first pumped in 1859, petroleum did not become an important source of energy until the diffusion of motor vehicles in the twentieth century.
34
New cards
Fossil Fuels
An energy source formed from the residue of plants and animals buried millions of years ago.
35
New cards
Locations of the Largest Reserves of Fossil Fuels
**Coal:** China produces nearly one-half of the world’s coal, other developing countries one-fourth, and developed countries (primarily the United States) the remaining one-fourth.
**Natural Gas:** One-third of natural gas production is supplied by Russia and Southwest Asia, one-third by other developing regions, and one-third by developed countries (primarily the United States).
**Petroleum:** Russia and Saudi Arabia together supply one-fourth of the world’s petroleum, other developing countries (primarily in Southwest and Central Asia) one-half, and developed countries (primarily the United States) the remaining one-fourth.
36
New cards
Labor Intensive Industry
An industry in which wages to workers are a high percentage of costs.
37
New cards
High Wage Industry
An industry in which wages to workers are higher.
38
New cards
Textile Manufacturing
The textile industry is a labor-intensive industry that has three steps to it.
**Spinning cotton:** has been moved to low-wage countries (i.e. China 2/3 of world’s cotton spinning)
**Textile weaving:** low wage (93% in LDC’s; China - 60%, India - 30%).
**Textile Assembly:** because most consumers in MDC’s, much more assembly manufacturing in MDC’s (i.e. garments, carpets, home products, and industrial items)
39
New cards
Factors - Change in Land/Desirable Sites
Cities used to be the most desirable site for building due to the access to a large market, large labor pool, and rail lines. Factories used to be multi-story to save space. Rural land is now more desirable because it is cheaper and more easily accessed by trucks along city beltway highways, and factories are now built as one heart.
40
New cards
Factors - Environmental
Industry is attracted to low cost energy sources (i.e. hydroelectric power attracts the most energy intensive industries like aluminum)
41
New cards
Factors - Capital
Manufacturers often go where loans can be obtained from banks, and there are different amounts of willingness to offer loans to particular industries in different regions of the country owing to the different values of the people and agglomeration (i.e. Silicon Valley)
42
New cards
US Interregional Shift in Manufacturing
The northeastern U.S. lost 6 million manufacturing jobs between 1950 and 2009, and 2 million manufacturing jobs were added to the South. The South lacked infrastructure before 1950; they had fewer rails, roads, agglomeration, and some parts had lacked electricity.
43
New cards
Ancillary Activities
Activities that support industries such as food service and shipping.
44
New cards
Rural Electrification
The building of new infrastructure in the rural South, and new roads brought new resources.
45
New cards
Unions and Right-to-Work States
RTW laws give states the right to enact a law that prohibits unions from forcing membership or the payment of union dues, and they also protect employees from being excluded from employment or terminated for not joining a union.
46
New cards
Deindustrialization
The decline in industrial activity in a region or economy.
47
New cards
Rust Belt/Steel Belt
After the shift to the South during the late 1900s, the Steel Belt has been referred to as the Rust Belt due to the deindustrialization in the region.
48
New cards
Backwash Effect
A harmful economic effect on one region resulting from economic success in another region.
49
New cards
Deagglomeration
The process of breaking up or dispersing that which has agglomerated, or aggregated, or clustered together.
50
New cards
Postindustrial Economies
The economy after an industrial era, typically service-based (i.e. research and development, marketing, sales, telecommunications). These jobs typically provide a much higher standard of living, but require much more training/education.
51
New cards
Service Industries
Service based economies (high and low skill) have left a vanishing middle class, leaving an abundance of low bar service industries (retail, fast food).
52
New cards
Convergence Regions
A new tide of movement away from Britain and the Rhine where industrialization traditionally had been concentrated to these new areas.
53
New cards
Transnational Industries
Industries that extend/operate across national borders (i.e. Apple, McDonald's, Coca-Cola, Nike, and Amazon).
54
New cards
Outsourcing
Allocating production to low wage countries.
55
New cards
New International Division of Labor (NIDoL)
The selective transfer of some jobs to LDC’s
56
New cards
Vertical Integration
Owning as many parts of the process as possible to cut costs (i.e. inputs, manufacturing, distribution).
57
New cards
Free Trade Zones
Zones without tariffs (i.e. NAFTA/USMCA, EU)
58
New cards
Special Economic Zones (SEZs)
Specific area within a country in which tax and investment incentives are implemented to attract foreign (and domestic) businesses and investment.
59
New cards
Export Processing Zones (EPZs)
A kind of SEZ established by many countries in which they offer favorable tax, regulatory, and trade arrangements to attract business and investment. (labor is cheaper and environmental restrictions are relatively weak)
60
New cards
NIDoL and the Auto Industry
Parts of the auto industry have been moved to different parts of the world
61
New cards
North Atlantic Free Trade Association (NAFTA)/United States Mexico Canada (USMCA)
NAFTA has moved many auto part assembly factories to Mexico.
62
New cards
Proximity to Skilled Labor
In the NIDoL, high skill labor still resides in MDC’s. (i.e. computer manufacturing industry is in the Bay Area of California and the University of Texas at Austin; “high end” clothes are still assembled in the US)
63
New cards
Fordist Production
Mass production lines with one specific task assigned to each worker and had employed more than 100,000 workers needing little education or job skills (i.e. migrants from Europe or the southern US).
64
New cards
Post-Fordist Production
Team members figure out problems for themselves and have a variety of tasks, a problem is solved through consensus of all on the team, and workers and managers are treated much more similarly (less hierarchical).
65
New cards
Footloose Industries
Industries that can operate almost anywhere as inputs are not specific to a few areas because the cost of transporting inputs and outputs is not a large factor (i.e. call centers).
66
New cards
BRIC
**China & India:** world’s largest labor force
**Russia & Brazil:** rich in inputs critical for industry
**Russia & Brazil:** rich in inputs critical for industry
67
New cards
Global Warming
The gradual warming of the Earth due to ozone depletion.
68
New cards
The Greenhouse Effect
Responsible for heating up the Earth by carbon dioxide trapping some of the radiation emitted by the surface.
69
New cards
Sources of Water Pollution
Most often, high energy industries (such as the aluminum industry). Water pollution occurs because it is easy to throw waste in a river and let it flow downstream and become someone else’s problem.
70
New cards
Toxic Waste
Chemical waste material capable of causing death or injury to life. According to the toxics release inventory published by the U.S. Environmental Protection Agency (EPA), 2.2 billion pounds of toxic chemicals were released into the land in 2016.
71
New cards
Radioactive Waste
A hazardous waste that contains radioactive material. Most often coming from nuclear reactors, fuel processing plants, hospitals, and research facilities.
72
New cards
Types of Renewable Energy
Solar energy, wind energy, geothermal energy, hydropower, and bioenergy.
73
New cards
Sustainable Development
Development that meets the needs of the present without compromising the ability of future generations to meet their own needs. The ultimate source for sustainable development is using solar energy.
74
New cards
Biodiversity
The variety of life on Earth at all its levels, from genes to ecosystems, and can encompass the evolutionary, ecological, and cultural processes that sustain life.
75
New cards
First, Second, and Third World Countries
Classifying development by these terms is outdated.
**First World:** industrialized and service based economies with free markets and a good quality of life (i.e. US, Canada, UK)
**Second World:** industrialized but under Soviet style Communist governments and an assumption of a lower quality of life (i.e. U.S.S.R., Cuba., East Germany)
**Third World:** mainly agricultural with a very low quality of life (i.e. Nepal, Haiti)
**Fourth World:** states in a crisis such as a complete economic collapse or war
**Fifth World:** countries with no functioning economy or formal government
76
New cards
Development
Improving the material conditions of people through the diffusion of knowledge and technology
77
New cards
MDCs
__**M**__**ore** __**D**__**eveloped** __**C**__**ountries:** US, UK, Canada
78
New cards
LDCs
__**L**__**ess** __**D**__**eveloped** __**C**__**ountries:** Afghanistan, Haiti, Ethiopia
79
New cards
NICs
__**N**__**ewly** __**I**__**ndustrialized** __**C**__**ountries:** Brazil, Mexico, India
80
New cards
HDI
__**H**__**uman** __**D**__**evelopment** __**I**__**ndex:** three factors: economic factor (GDP per capita), social factors (literacy rate and the amount of education), and demographic factor (life expectancy). The highest - and most perfect score - is a 1.0. the lowest ranking countries are clustered in sub-Saharan Africa.
81
New cards
GDP and GDP Per Capita
GDP stands for “gross domestic product,” which is the value of the total output of goods and services in a country. GDP per capita measures the value of output per person in a country, which indirectly indicates personal income.
82
New cards
Problems with GDP
GDP may not take notice of income by US citizens earning in a foreign land, consider the destruction of natural resources as depletion of capital, or will only notice formal economies.
83
New cards
Formal Economies vs Informal
**Formal Economy:** official economies monitored and taxed by the government
**Informal Economy:** unofficial economies often found in poorer communities
**Informal Economy:** unofficial economies often found in poorer communities
84
New cards
Purchasing Power Parity (PPP)
Details how much of different currencies are needed to buy a staple item.
85
New cards
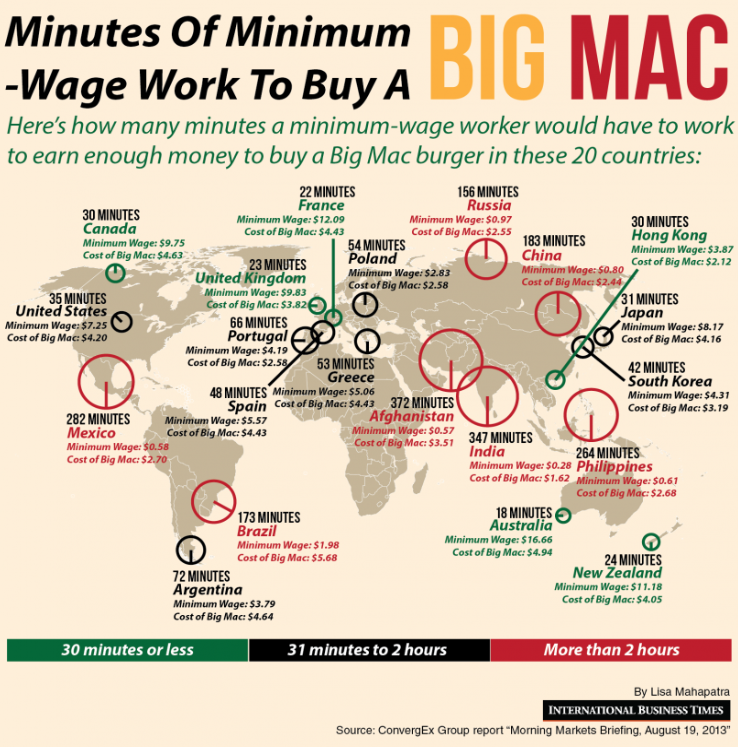
Big Mac Index
Way to measure PPP by determining how long someone must work in a country at minimum wage to buy a big mac.
86
New cards
GNI and GNI Per Capita
Takes into account what is produced at home and abroad by citizens as well as taxes and dividends on investments coming into (and leaving) the country.
87
New cards
GNI Per Capita PPP
Taking into account the purchasing power of the wealth that is produced in that country and making the comparisons more level.
88
New cards
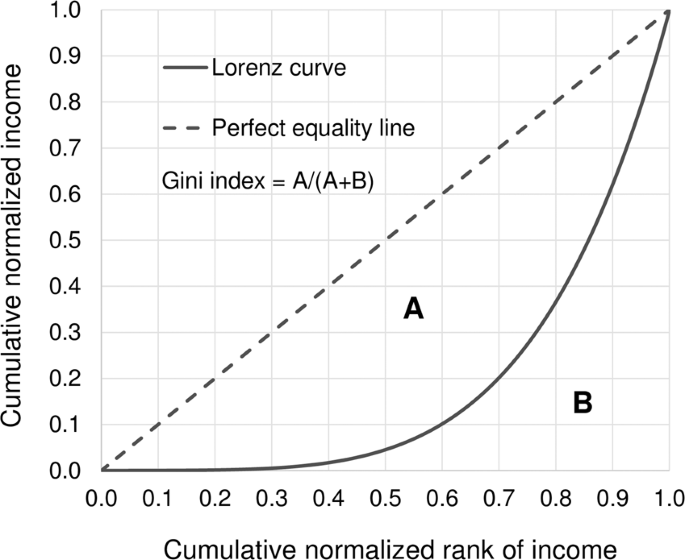
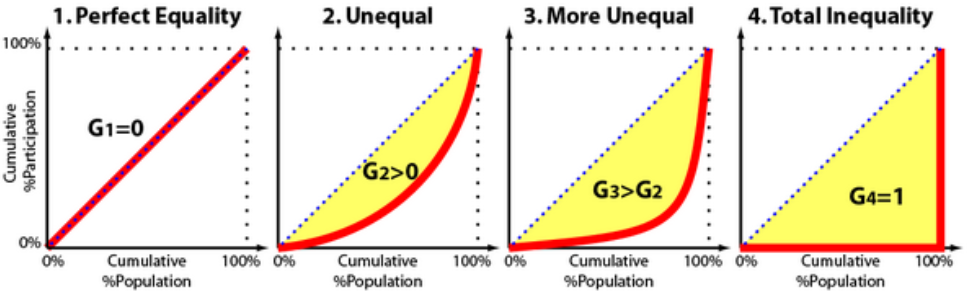
The Gini Coefficient
A/(A+B). Measures the amount of wealth owned by different percentages of the population. 0.0 is perfect inequality, with 1.0 being the worst.
89
New cards
Lorenz Curve
Line on the gini coefficient graph that indicates how unequally wealth is distributed.
90
New cards
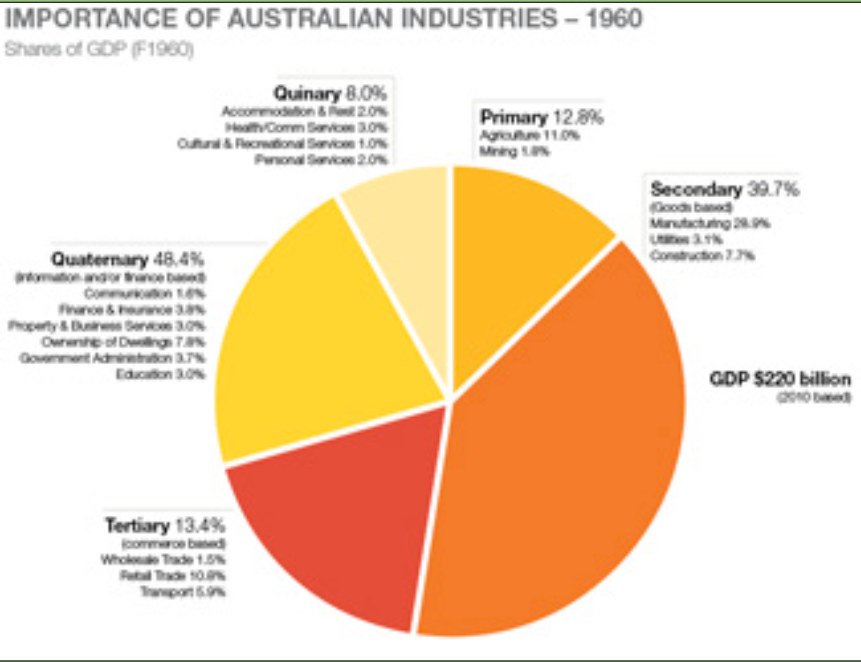
Primary Sector
Directly extract materials from the Earth through agriculture, mining, or fishing.
91
New cards
Secondary Sector
Manufacturers that process, transform, and assemble raw materials into useful products.
92
New cards
Tertiary Sector
Provision of goods and services to people in exchange for payment (i.e. retail, sales, consumer sector).
93
New cards
Quaternary Sector
Knowledge based activities (education, law).
94
New cards
Quinary Sector
Administration and executive occupations.
95
New cards
Sectorization Model
Measures the variety of sectors present to evaluate the economic health of a country
96
New cards
Value Added
Gross value of the product minus the costs of raw materials and energy.
97
New cards
Social Indicators of Development
**Education:** student to teacher ratio (number of students per teacher exceeds 30 in most LDC’s; less than 20 in most MDC’s) and literacy rate (exceeds 98% in most MDC’s; less than 60% in most LDC’s).
**Health & Welfare:** calorie consumption (MDC’s consume a third more calories than needed; in LDC’s there is an average of just enough) and access to healthcare.
**Health & Welfare:** calorie consumption (MDC’s consume a third more calories than needed; in LDC’s there is an average of just enough) and access to healthcare.
98
New cards
Demographic Indicators of Development
**Life Expectancy:** men live 10 years longer, women 13 years longer in MDC’s.
**IMR:** 99.5% survive in MDC’s, 94% in LDC’s (medicine, nutrition to survive dehydration and diarrhea).
**RNI:** 1.5% in LDC’s compared to 0.2 % in MDC’s (large parts of GDP’s in LDC’s allocated to handle growing populations).
**CBR:** 23 per thousand in LDC’s, 12 per thousand in MDC’s.
**IMR:** 99.5% survive in MDC’s, 94% in LDC’s (medicine, nutrition to survive dehydration and diarrhea).
**RNI:** 1.5% in LDC’s compared to 0.2 % in MDC’s (large parts of GDP’s in LDC’s allocated to handle growing populations).
**CBR:** 23 per thousand in LDC’s, 12 per thousand in MDC’s.
99
New cards
North-South Split
Most MDCs are in the north (with Australia and New Zealand being an exception), while most LDCs are in the south.
100
New cards
Brandt Line
The line of division in the north-south split (30°N latitude)