PLCY 460 Final Exam
1/134
There's no tags or description
Looks like no tags are added yet.
Name | Mastery | Learn | Test | Matching | Spaced | Call with Kai |
|---|
No analytics yet
Send a link to your students to track their progress
135 Terms
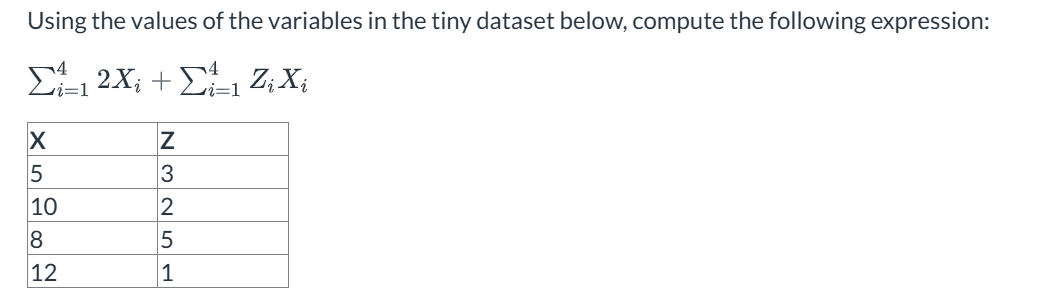
mean, median, and mode
The three common measures of central tendency are the ________
median
The ________ is the middle value in an ordered set of measurements
trimmed mean
The ________ is calculated by dropping the highest and lowest values before averaging the rest
outlier
The term ________ refers to extreme values in a dataset
skewed, mean
If data is ________, the ________ is pulled in the direction of the tail
range
The ________ is the difference between the largest and smallest values.
75th, 25th
The IQR is the difference between the ________ and ________ percentiles
variance, deviations from the mean
The ________ is the sum of squared ________ divided by (n–1)
standard deviation
The ________ is the positive square root of the variance
parameters, statistics
________ describe a population, while ________ describe a sample
discrete, continuous
________ data is quantitative and finite; ________ data is quantitative and not countable
independent, dependent, error term
In the bivariate regression, Xi is the ________ variable, Yi is the ________ variable, and ei is the ________
slope coefficient, one unit
B1 is the ________, measuring the change in Yi when Xi increases by ________
intercept
B0 is the
residual (Ûi)
The ________ is the distance between the predicted value and the actual value
squared residuals
OLS finds coefficients that minimize the sum of ________
means
The OLS regression line goes through the ________ of Xi and Yi
zero
The sum of OLS residuals is
endogenous, error term
An independent variable is ________ if it is correlated with factors in the ________
RCT, uncorrelated
The goal of an ________ is to make the independent variable ________ with the error term
internal, external
________ validity refers to unbiased inference; ________ validity refers to generalizability
unbiased estimator
An ________ produces estimates equal on average to the true parameter
uncorrelated
For OLS to be unbiased, Xi must be ________ with ei
omitted variable bias; correlated
________ occurs when a missing variable affects Yi and is ________ with Xi
multicollinearity, independent
________ is strong correlation among ________ variables
attenuation bias, underestimate
________ occurs when measurement error in Xi causes coefficients to ________ the true effect
mediating, caused
A ________ variable is ________ by Xi and should be avoided to prevent mediator/collider bias
normal distribution
The ________ is the symmetric bell-shaped curve
Central Limit Theorem, normal
The ______ says the sampling distribution of the mean is approximately ________ when n > ~30.
null hypothesis; no effect (B1 = 0)
The ________ (H₀) is the hypothesis of ________
type I error, reject
A ________ is a false positive where we ________ a true null
type II error; accept
A ________ is a false negative where we ________ a false null
significance level
The ________ (α) is the probability of a type I error
p-value; the null hypothesis
The ________ is the probability of observing our coefficient if ________ is true
statistical significance, reject
We have ________ when we ________ the null hypothesis
power
________ is the ability to detect a false null (avoid Type II error)
confidence intervals, parameter values
________ give the range of ________ consistent with the estimate
R², goodness of fit, proportion
________ measures the ___________ and the ________ of variation explained
________ adjusts R² for the number of included variables
adjusted R²
all other variables constant (ceteris paribus)
In multivariate OLS, coefficients reflect one-unit changes in Xi holding ________
irrelevant, less precise
An ________ variable has a coefficient of 0 and makes other estimates ________
F test, multiple
A ________ tests hypotheses about ________ coefficients using restricted vs. unrestricted models.
linear regression, parameters
A ________ model means the ________ are not squared, cubed, or logged
polynomial, power
A ________ model includes Xi (independent variable) and that same variable (Xi) raised to a ________
log transformations, percentage
________ allow interpretation in ________ terms
log-log, elasticity
In a ________ model, β₁ is an estimate of ________
log-linear, percentage amount
In a ________ model, a one-unit increase in Xi changes Yi by a ________
dummy variable, 1, 0
A ____________ is created to equal either ______ or _____ for each observation
difference in the mean of the dependent variable
In a treatment dummy, β₁ estimates the ________ between groups
reference category
When using categories, one must be omitted as the ________
interaction terms, the effect of one variable differs across groups compared to the reference group
________ multiply variables together; they show how ________
Mediators vs intervening variables
Mediators explain the relationship; intervening variables disrupt it
Moderators
Determine whether the relationship between X and Y is positive or negative
Confounders
Create a spurious relationship because both variables depend on a third variable
The apartment units
A researcher records the average weekly electricity bill for each apartment unit. What is the unit of analysis?
Exactly 1
What must the total area under any probability density function (PDF) for a continuous variable equal?
The deviation of each observation from the mean
What key calculation is used to compute both variance and standard deviation?
Approximately 68%
For a normally distributed variable, what percentage of observations fall within one standard deviation of the mean?
-1
A variable follows a normal distribution with μ = 60 and σ = 15. What is the z-score for a value of 45?
The median
Which measure of central tendency is resistant to outliers?
30% of scores are at or below that value
If a test score is at the 30th percentile, what does this mean?
157
A sample is a single subset drawn from a population; a sampling distribution is the distribution of a statistic (e.g., mean) calculated across many repeated samples
What is the difference between a sample and a sampling distribution?
Degrees Fahrenheit
A dataset includes a variable recording daily temperature in Fahrenheit. What is the unit of measurement
Nominal categorical
A variable that records someone’s eye color is what type of variable
When it is correlated with the error term
When is an independent variable considered endogenous in a regression model
True
True or False: In a randomized experiment, the value of the independent variable is assigned using a random process
Causal
Is the question “Does daily meditation improve students’ ability to focus during lectures?” descriptive or causal?
Descriptive
Is the question “What proportion of U.S. counties have a median age under 35?” descriptive or causal?
False — a negative correlation means that as X increases, Y tends to decrease (and vice versa)
True or False: A negative correlation between X and Y means that as X decreases, Y must also decrease
Parental education or involvement
What factor could make the effect of after-school tutoring on high school graduation endogenous?
All other factors that affect the dependent variable but are not included in the model.
What does the error term in a regression represent?
External Validity
A study finds that joining a book club improves life satisfaction. Another researcher wonders whether joining any social club would have the same effect. Which concept is this about?
Internal Validity
A study finds a positive association between hours spent gardening and stress reduction. You wonder whether this relationship may be driven by income, since wealthier people may have both more time to garden and lower stress. What concept are you concerned about?
False — correlation does not adjust for units or intercepts, while OLS does.
True or False: The correlation between X and Y is the same as estimating Y = β₀ + β₁X in a regression model.
True
True or False: Randomly assigning the value of X in an experiment is the clearest strategy for creating an exogenous independent variable.
One confounder could be pre-existing socioeconomic attitudes. People with wealthier backgrounds may prefer premium bottled water and may also be less inclined to share money in experimental games. If wealthier participants were disproportionately represented in the premium-water group, the study might mistakenly attribute lower generosity to the ad exposure rather than to underlying socioeconomic traits. This threatens internal validity.
A news article reports a study claiming that people who drink “premium bottled water” are less generous when playing a sharing game. Participants were shown either a premium-water advertisement or a tap-water advertisement before deciding how much money to share with another person. The study concludes that exposure to premium water cues makes people more selfish.
Based on the study summary, give one possible confounder that could bias the relationship between exposure to premium water ads and generosity. Explain how it could create a misleading result.
The sample may not represent the broader population—for example, if participants were all college students from one university. Their behavior in a laboratory sharing task may not reflect how adults behave in real-world generosity situations. Because the setting is artificial and the sample narrow, the findings may not generalize to the real world, limiting external validity.
A news article reports a study claiming that people who drink “premium bottled water” are less generous when playing a sharing game. Participants were shown either a premium-water advertisement or a tap-water advertisement before deciding how much money to share with another person. The study concludes that exposure to premium water cues makes people more selfish.
Based on the study summary, give one concern about the external validity of the findings. Why might the results not generalize beyond the study?
The coefficient on net_price is -0.782 which means that for every additional $1000 increase in the average net price of attendance, the percentage of graduates who remain in-state to work decreases by roughly 0.782 percentage points.
Interpret the coefficient
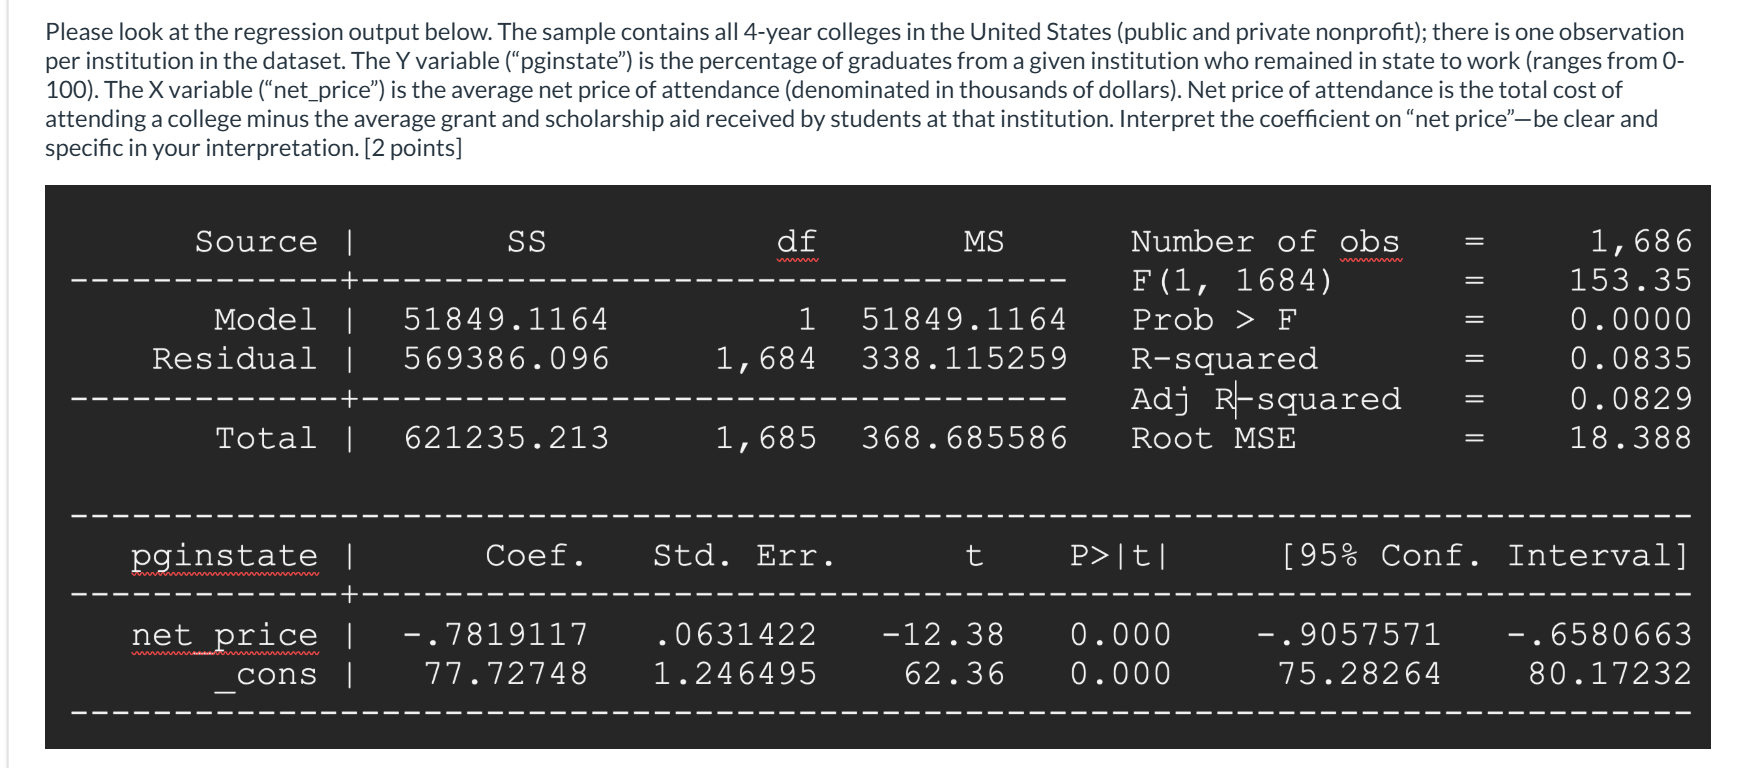
The constant in this regression is roughly 77.7 which means that if the average net price of attendance was 0, the data predicts that roughly 77.7% of graduates would remain in-state to work. This doesn't have a sensible, policy-relavant interpretation since no college in the US has a net price of 0.
how would one interpret the estimate of the constant? Does it have a sensible, policy-relevant interpretation in the context of this analysis? Why or why not?

The residual is the observed value minus the predicted value:
ei = Yi - Y hat i
In a regression model, how is the residual for observation i defined?
False — it passes through the means, not the medians
True or False: The OLS regression line always passes through the medians of X and Y.
False — more variation in X reduces the variance of the slope estimate, making it more precise.
True or False: A larger variance in X leads to a larger variance in the estimated slope coefficient.
Because in small samples, each observation carries more weight, so extreme values distort estimates more severely.
Why are outliers generally more harmful in small samples than large samples?
It is the predicted value of the dependent variable when X = 0.
How do we interpret the constant (intercept) in a simple regression model?
True
True or False: As the sample size increases, coefficient estimates from OLS become more precise.
When X tends to be above its mean at the same time that Y tends to be above its mean—i.e., when X and Y move together.
In OLS, when will the slope estimate β̂₁ be positive?
They are unbiased (their sampling distribution centers around the true population value).
In large samples, what key property do OLS coefficient estimates have?
Across many repeated samples, the average of β̂₁ equals the true β₁ in the population.
What does it mean for an estimate of β₁ to be unbiased?
R-squared
What statistic is commonly used to measure the goodness of fit of a regression model?
When the test statistic is less than the critical value
When do we fail to reject the null hypothesis in hypothesis testing?
False — the coefficient, standard error, and sampling variability all matter for inference.
True or False: In hypothesis testing, the only feature that matters is the size of the coefficient.
Rejecting the null hypothesis when it is actually true (a “false positive”).
What is a Type I error?
Failing to reject the null hypothesis when it is actually false (a “false negative”).
What is a Type II error?
The probability of a Type II error increases.
What happens to the probability of a Type II error when we lower the significance level α?
Stronger evidence against the null hypothesis and in favor of the alternative.
What does a smaller p-value indicate?
When the 95% confidence interval does not include zero.
When can we reject the null hypothesis at the 95% confidence level?
Type II error
A study fails to detect an effect even though a real effect exists in the population. What type of error is this?
When prior theory or evidence suggests the effect can only reasonably go in one direction (strictly positive or strictly negative).
When should a researcher use a one-sided alternative hypothesis instead of a two-sided one?
Power decreases
If we decrease the significance level (α), what happens to the power of the test?