Biology Unit 4 Ecology
1/194
There's no tags or description
Looks like no tags are added yet.
Name | Mastery | Learn | Test | Matching | Spaced | Call with Kai |
|---|
No analytics yet
Send a link to your students to track their progress
195 Terms
What is Ecology?
study of how organisms interact with their environment
Environment includes:
abiotic: physical rather than biological; not derived from living organisms
biotic: relates to living things; and their ecological relations
What is ecology used to understand?
distribution and abundance of organisms
What are the Levels of Ecological Study?
Organisms
Populations
Communities
Ecosystems
Global

What is Organismal Ecology?
explores the morphological, physiological, and behavioral adaptations allowing individuals to live in a particular area
Organismal Ecology Example
Ex. Lizards are ectotherms, their body temps match the environment, can adapt to changes in temp in environment
Conclusion: thermoregulation is flexible in lizards as they can adjust time spent in different light in environments, to compensate for warmer temps
What do Organismal Ecologists measure?
how individuals interact with their physical surroundings and with other organisms in their habitat
What is Population Ecology?
a group of individuals of the same species that live in the same area, at same time and interact
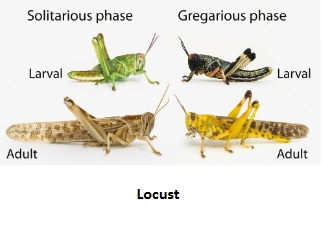
Population Ecology Example
Ex. Locusts, which shift between:
solitarious phase (avoid other locusts, is green, shy)
AND
gregarious phase (social, bright, migrate in groups)
Conclusion: changes in weather affects reproduction of insect, causing ‘boom and bust’ periods that impact humans

What do Population Ecologists measure?
how the number of individuals in a population gradually change
What is Community Ecology?
a biological community consisting of different populations of species that interact with one another in a particular area
(many species together)
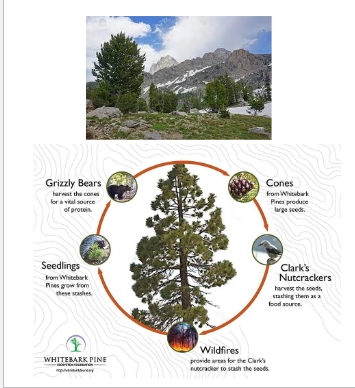
Community Ecology Example
Ex. Whitebark pine live at high elevations and multiple species rely on it, pinecones rely on Clark’s nutcracker to disperse and store seeds
Conclusion: Species that rely on each other are found together, and losing one might disrupt the system
What do Community Ecologists study?
the nature and consequences of interactions among species
ask questions about biotic interactions: responses to predation, parasitism and competition
And abiotic interactions like responses to fire, floods, etc.
What is Ecosystem Ecology?
an ecosystem consists of all organisms in a particular region (community), along with nonliving components
Ecosystem= biotic component + abiotic component
Ecosystem Ecology Example
Ex. Nitrogen is limiting and puts constraints on life. Increases or decreases in nitrogen change species composition and abundance of plants.
Conclusion: excess nitrogen input into ecosystems change complex interactions, affecting ecosystem health and abundance of certain species
What do Ecosystem Ecologists study?
how nutrients and energy move among organisms and between surrounding, air, soil, and water
What is Global Ecology?
encompassed by biosphere; thin zone surrounding Earth where all life exists
combo of all ecosystems and their interactions
Global Ecology Example
Ex. NPP (Net Primary Productivity) is how much CO2 vegetation absorbs during photosynthesis minus how much CO2 plants release during respiration
important for understanding Earth’s global carbon cycle
Conclusion: NPP fluctuates over the season, has North/South patterns, varies year to year
What do Global Ecologists study?
focus on effects of human impacts on biosphere
Biogeography
study of how organisms are distributed geographically
interactions with the abiotic and biotic environments affect where a particular species live
Ex. Location of Lodgepole pine (left) vs Location of Jack pine (right)
What are Abiotic Factors?
Abiotic factors that limit ranges:
Temperature
Wind
Water (availability)
Light
Salinity
pH
What are Biotic Factors?
distribution of species is limited by living factors, or interactions with other organisms
Competition, Mutualism, Parasitism affect species distribution
Why is Earth’s history also a component in Ecology?
continental drift has gradually changed the Earth’s oceans and landforms
As a result:
climate has changed
seas have risen and fallen
glaciers have formed and receded
Example of change in Earth’s History
the land bridge between North and South America formed 15-3 mya
Effects:
land species could disperse between continents
however marine species were faced with a barrier between Pacific Ocean and the Caribbean Sea
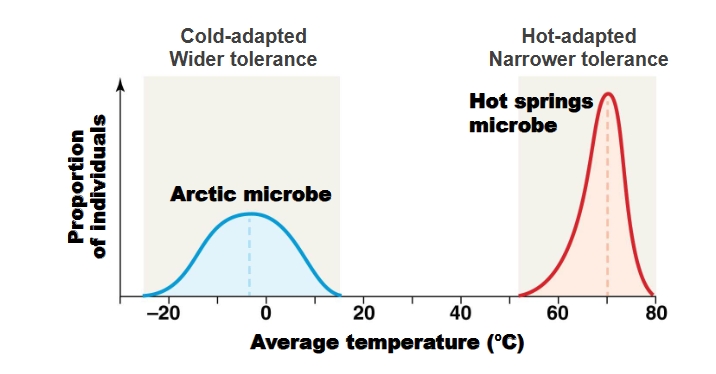
Why is temperature important in species distribution?
high and low temps explain species distribution
a species becomes adapted to a range of temps and if exceeded, they move or die
How does water affect species distribution?
water performs vital functions in all organisms
species are adapted to a range of water conditions, and if exceeded, move or die
What is the difference between Climate and Weather?
Climate is the prevailing long-term weather conditions found in an area
Weather consists of the specific short-term atmospheric conditions of temperature, precipitation, sunlight, and wind
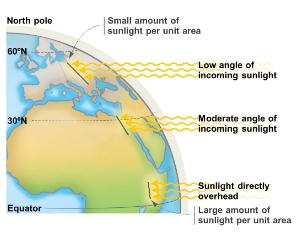
Why is it warmer at the Equator?
At the equator, sunlight strikes the Earth at an angle allowing the maximal amount of solar radiation
warmer areas receive more sunlight per unit area
sunlight arrives at lower angles at the poles, minimizing energy and heat (30 N is moderate sunlight and 60 N, lowest amount)
Why is it wetter at the Equator?
areas along the equator receive the most moisture whereas, area 30 N and 30 S latitude are drier
The Hadley Cell causes this to occur
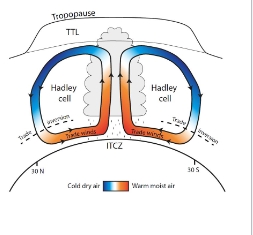
Explain how the Hadley Cell works
air heated at the equator expands and rises, warm air holds moisture
as air rises it cools, holding less water, and precipitation occurs
as more air is heated along equator, the cooler, “older” air above Earth’s surface is pushed toward poles
as air cools, its density increases and it begins to sink
as it sinks, it absorbs solar radiation from Earth’s surface and warms, gaining water-holding capacity
warm air returns to surface at 30 N and 30 S, resulting in low precipitation (desert)
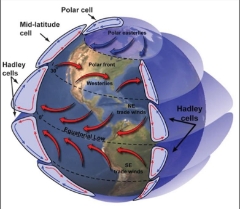
Explain the Coriolis Effect
air within a cell does not move in a straight north-south direction
Coriolis Effect causes air to be deflected in a clockwise pattern around the globe in the Northern Hemisphere
accounts for differences in directions of winds and ocean currents at different latitudes (water is cold in beach at CA)
What Causes Seasonality in Weather?
Seasons: annual fluctuations in temps, precipitation, or both
Seasons are caused by Earth’s 23.5 degree tilt on axis
In December, the Southern Hemisphere is tilted towards the Sun, receiving the largest amount of solar radiation
In March and September, the equator faces the Sun directly, tropics receive more solar radiation
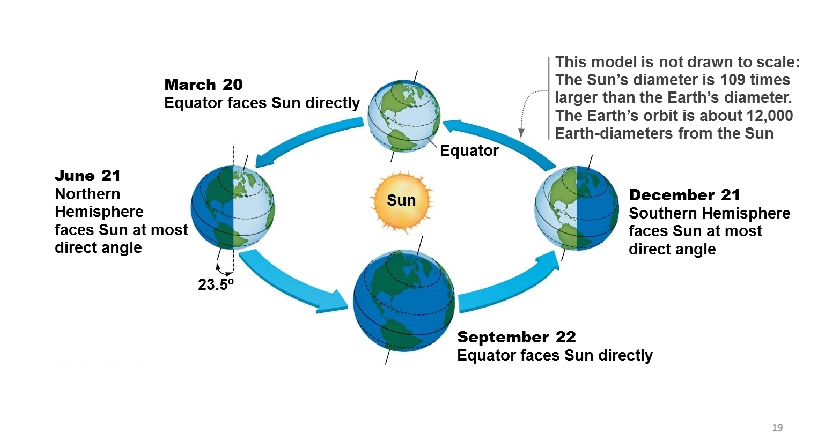
Explain this model
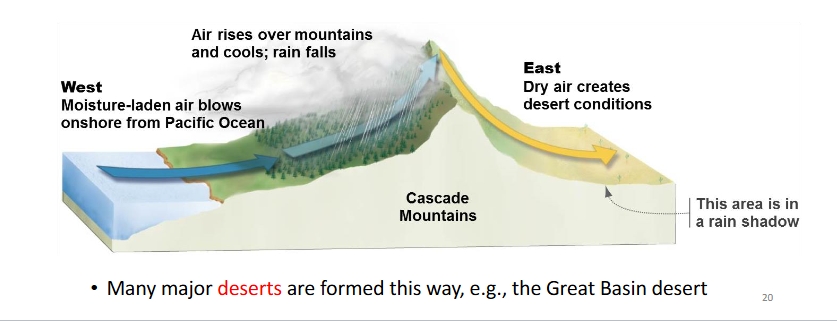
How do Mountains and Oceans affect Climate? Rain shadow
from the west side of the mountain, moisture-laden air blows onshore from Pacific Ocean
then, air rises over mountains and cools; rain falls
on the east side, dry air creates desert conditions (in rain shadow)
major deserts formed like this (Great Basin Desert)
What Regional Effects do Mountains and Oceans have on Climate?
oceans can influence temp because water has a high capacity for storing energy compared to land
water absorbs atmospheric heat in summer and releases it during winter
coastal areas (near oceans) have more moderate climates than inland areas (far from oceans)
known as Maritime effect; where proximity to oceans influence a region’s climate
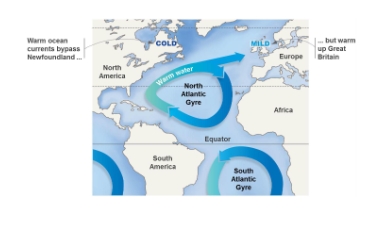
What are Gyres?
Gyres are massive ocean current cycles that transport warm water from equator to colder latitudes, and cold water toward tropics (regulates climate and influences ecosystem in different regions)
Coriolis effect causes:
clockwise gyres in Northern Hemisphere and counterclockwise in Southern Hemisphere
What are Biomes?
regions characterized by distinct abiotic characters and dominant vegetation types
Depends on:
Temperature defines range of species
Moisture is required for life; organisms lose water to evaporation/transpiration
Sunlight needed for photosynthesis
Wind modifies effects of temperature and moisture
Natural Biomes
determined by:
average annual temp and precipitation
annual variation in temp and precipitation
What is NPP?
NPP is the total amount of biomass produced by carbon fixed per year minus the amount of fixed carbon utilized during cellular respiration
NPP refers to total mass of primary producers
Biomass refers to the total mass of organisms
NPP in Nature Biomes
NPP represents organic matter that is available as food for all organisms
In terrestrial environ., NPP is estimated by measuring aboveground biomass
On land, photosynthesis and plant growth are maximized when temps are warm and conditions wet
Arctic Tundra Biome
Description:
in arctic regions of Northern Hemisphere
low productivity, low species diversity, and low aboveground biomass
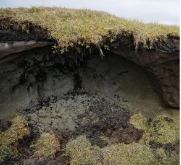
soil can be permafrost
Vegetation:
ground covered by low plants (lichens, woody shrubs), no trees
little animal diversity, higher insect abundance (swarms of biting flies)
short growing seasons
Avg. Precipitation and Temp:
low precipitation and below freezing temps (Alaska)
high annual temp variation
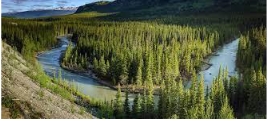
Boreal Forest Biome (Taiga)
Description:
present across Canada, Alaska, Russia, and Northern Europe
low prod. and low species diversity
dominated by cold-tolerant conifers (pines, spruce, fir, and larch trees)
high aboveground biomass, many slow-growing species are long lived
low structural diversity, moisture sufficient for tree growth
Avg. Precipitation and Temp:
very cold winters and cool summers, temp variation extreme
annual precip. low as cold temps minimize evaporation
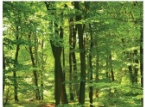
Temperate Forest Biome
Description:
in North America, Europe, and Eastern Asia
moderate prod. and diversity because mean temps (below freezing) do not support photosynthesis year-round
Vegetation:
dominated by deciduous trees (leafless in winter, grow new leaves in spring and summer)
needle-leaved evergreens common
Avg. Precipitation and Temp:
compared with grassland climates, precipitation is moderately high and constant throughout year
temperature mean and variation is moderate
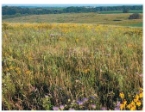
Temperate Grassland Biome
Description:
grasslands soils are more fertile, but productivity is lower in forests
Vegetation:
grasses dominate as conditions are too dry for tree growth (can cause fires)
extremely dense plant life both aboveground and belowground (roots)
plant growth occurs when moisture and warmth are adequate
Avg. Precipitation and Temp:
seasonal temp and rainfall are moderate

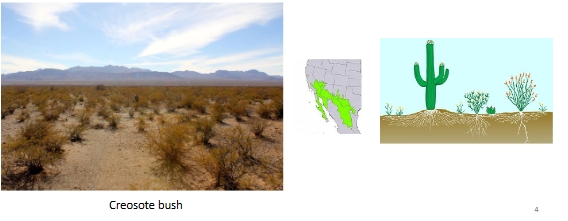
Subtropical Dessert Biome
Description:
present at 30 latitude North and South
has extreme temps, low moisture, and very low productivity
Vegetation:
has cacti, leaves modified as pines (no leaves), or leaves with a thick, waxy coating (reduces water loss)
slow growth year-round, or occurs during rainfall
Avg. Precipitation and Temp:
very low precipitation
mean monthly temps high, greater variation than in tropical wet climates

Tropical Wet Forest Biome (Tropical Rainforest)
Description:
present in equatorial regions
favorable year-round growing conditions produces high aboveground biomass, high species diversity, and high productivity
Vegetation:
high NPP (more species diversity)
plants have broad leaves, are evergreen, and diverse in size and growth
high structural diversity (tall and short trees, vines, shrubs), presents wide array of habitats for animals
Avg. Precipitation and Temp:
highest avg. temp, almost no seasonal variation in temp
highest annual rainfall
Imagine you are in a Biome that exists at 30 degrees South and has very low precipitation. The plants you find are modified with no leaves. What Biome is this?
Desert
Imagine you are in Siberia and the forest has low diversity and is dominated by coniferous trees. What biome is this?
Boreal Forest
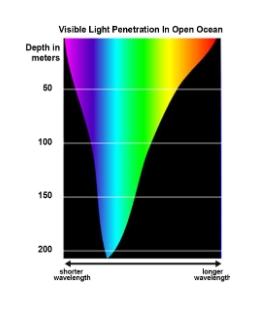
How does Water Depth affect the distribution and abundance of organisms in Aquatic Biomes?
water absorbs and scatters light, the amount and type of wavelengths available to organisms change as water depth increases
turbidity (cloudiness) of water is an important determinant of light penetration
light has a major influence on NPP
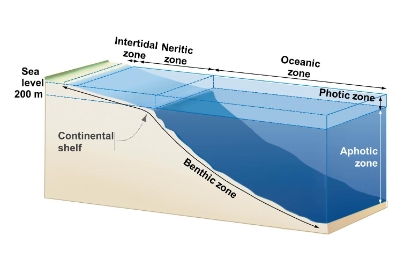
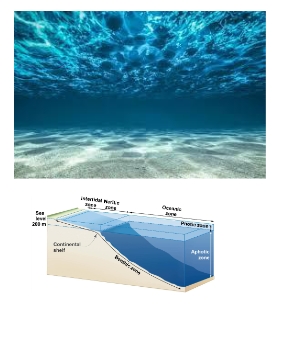
Define the six zones in Ocean habitats
Intertidal Zone: the area where the ocean meets the land between high and low tides
Neritic Zone: the region of shallow water above continental shelf where light penetrates to sea floor
Benthic Zone: region at lowest body of water (lake, ocean)
Oceanic Zone: vast area of ocean beyond continental shelf
Aphotic Zone: area of water that lacks light
Photic Zone: uppermost layer of body of water that receives sunlight for photosynthesis
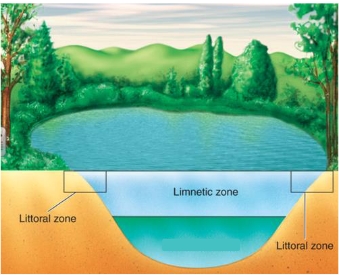
Zonation in Lakes
Littoral Zone: shallow waters along shores, where flowering plants are rooted
Limnetic Zone: offshore and comprises water that receives enough light to support photosynthesis
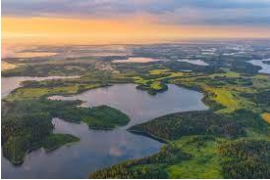
Aquatic Biomes: Lakes and Ponds
found at high latitudes, formed by glaciers
undergoes seasonal turnover driven by wind and temp changes (causes surface water to sink and bottom water to rise, redistributing oxygen and nutrients throughout water)
organisms adapt based on depth and sunlight availability
differ from wetlands because they have deeper water and less emergent vegetation
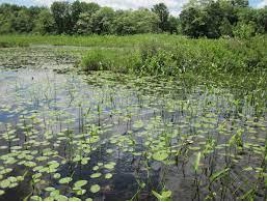
Aquatic Biomes: Freshwater Wetlands
shallow-water habitats where soil is saturated in water for parts of year
Wetlands distinct from lakes and ponds due to:
only having shallow water
has emergent plants that grow above surface of water
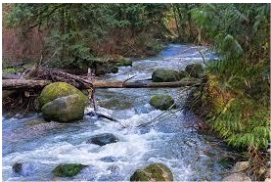
Aquatic Biomes: Streams
streams and rivers move constantly in one direction
streams are shallow enough to allow sunlight to reach bottom
Structure of stream varies along length:
where it originates it is cold, narrow, and fast
at end, it is warmer, wider, and slower
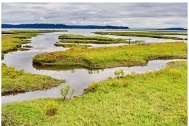
Aquatic Biomes: Estuaries
an estuary forms when a river meets the ocean and freshwater mixes with saltwater
includes saline wetlands and nearby open, brackish (slightly salty) waters
most productive environment on Earth; serve as fish nurseries, has abundant vegetation, invertebrates, and plankton
Aquatic Biomes: Oceans
form a continuous body of salt water
water movement is dominated by different processes at different depths:
the intertidal and neritic zone are most productive (rich in sunlight and nutrients, supports algae)
in neritic zone, upwelling current are most important (brings cold, nutrient-rich water from sea floor to surface)
Imagine you are doing a survey of some land and you find permanent, standing water. It has some surface plants, but the depth is 10-15ft deep in the middle and supports aquatic life below the ice in the winter. This would be a…
Lake/pond
Two big patterns in Biodiversity related to Biomes:
1) Latitudinal Gradient in Biodiversity
2) Species-Area or Biodiversity-Area Curve
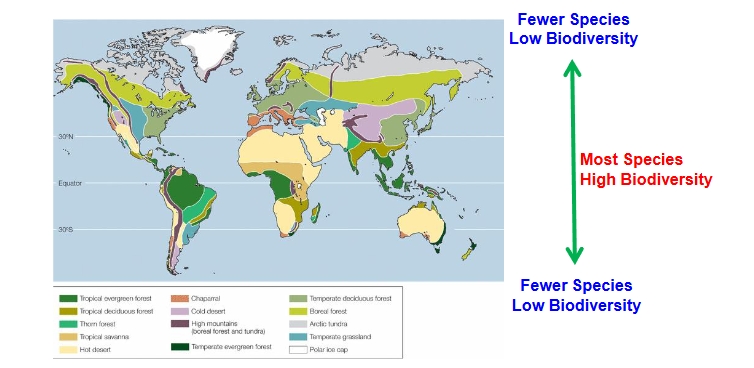
Latitudinal Gradient in Biodiversity
species diversity (richness) often peaks at equator and declines towards poles
Ex 1. higher species of butterflies at equator (79-81) than at poles (3, 9, 13)
Potential Explanation for Latitudinal Gradient
(the Mid-Domain Effect)
latitudinal gradient is a statistical artifact; poles place a bound on species ranges making it more likely to get more species near equator by CHANCE alone

Climate Hypothesis for Latitudinal Gradient in Biodiversity
more productivity causes more species
1) Warmer, wetter climates promote higher NPP
2) Higher NPP supports more individuals
3) More individuals beget more species by evolution
tropics have more species, because they have higher NPP
the poles have fewer species, because they have lower NPP
The Historical Hypothesis for Latitudinal Gradient in Biodiversity
tropics are older and thus have more species
ancient world was warmer, and tropical habitats were global norm
since tropics are older than poles, biodiversity had more time to accumulate species in tropics
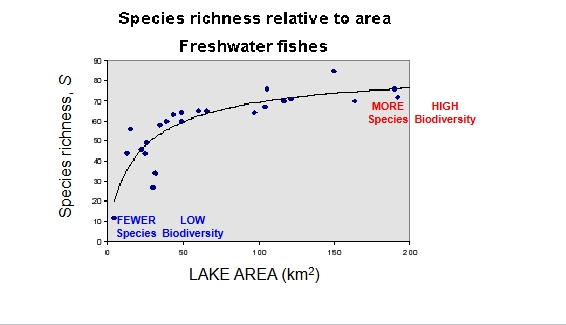
Second Pattern: Species-Area Relationship
larger areas contain more species than smaller areas
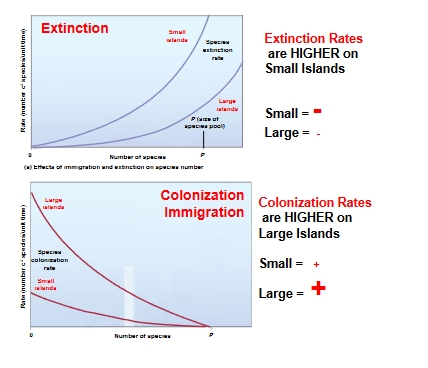
What is the relationship between size of habitat and colonization or extinction of species in that area?
number of species on an island reflects equilibrium, where:
immigration of new species (+ Biodiversity)
extinction of resident species (- Biodiversity)

Extinction and Colonization Rates on Islands
Extinction Rates are higher on Small Islands
Colonization Rates are higher on Large Islands
Why are Larger Islands more important?
larger ‘islands’ are needed to preserve species, more connectivity
Define Population Density. Example?
is the number of individuals of a species per unit area (abundance)
Ex.
the number of oak trees per square kilometer in a forest
the number of isopods per cubic meter in soil
the number of Daphnia per liter in a pond
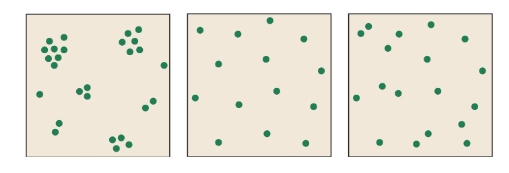
Distribution within a population may be:
Clumped (underdispersed)- grouped in patches
(school of fish)
Uniform (overdispersed)- individuals equally spaced in environ. (penguins)
Random- individuals are spaced in an unpredictable way
(flowers)
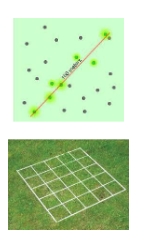
Calculating Population Size for Sedentary Species
counted via:
lines of known length called transects
plots of known size called quadrats
counts used to estimate population size and document trends over time
Calculating Population Size for Mobile Species:
harder to count as numbers along transect can change as individuals move
if individuals can be captured and tagged, size of population can be estimated using mark-recapture method
Mark-Recapture Method Example
Mark 100 Individuals
Randomly capture 30 individuals (15 marked)
Population size is 200
N= # of marked in first catch * total number of second catch/Number of marked in second catch
Demography
study of birth rates, death rates, age distributions, and size of popul.
Number of individuals present in popul. depends on:
Birth
Death
Immigration (In)
Emigration (Out)
How does a population fluctuate considering the four processes?
(Birth, Death, Immigration, Emigration)
Population Growth (increases) with Birth or Immigration
Population Declines (decreases) with Death and Emigration
What are the Two Major Factors in Demography?
Age-specific survivorship (lx)
Age-specific fecundity (mx)
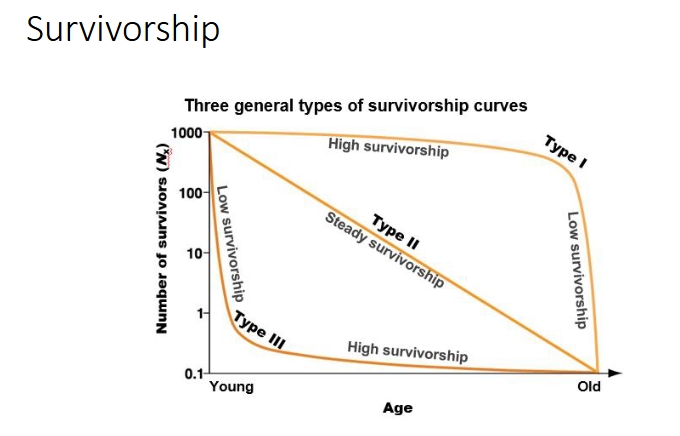
Define Survivorship
the proportion of offspring produced that survive, on average, to a particular age
plots logarithm of # of survivors vs age
Types of Survivorship Curves and Examples
Type I curve: high survivorship throughout, most individuals approach maximum life span
(Ex. orangs, elephants, whales, wolves, chimpanzees)
Type II curve: constant rate of survivorship over time (turtles)
Type III curve: high death rates early in life but high survivorship after maturity (fish and rats)
not all individuals of a species follow the same survivorship curve; females also tend to have higher survivorship than males
Fecundity and Age-Specific Fecundity
Fecundity is the number of female offspring produced by each female in the population
Age-specific fecundity: average number of female offspring produced by females in each age class
uses survivorship curves and has variation

Life Tables
summarize probability that an individual will survive and reproduce at any interval over its lifetime
uses age-specific values for fecundity (mx) and cumulative values for survivorship (lx)
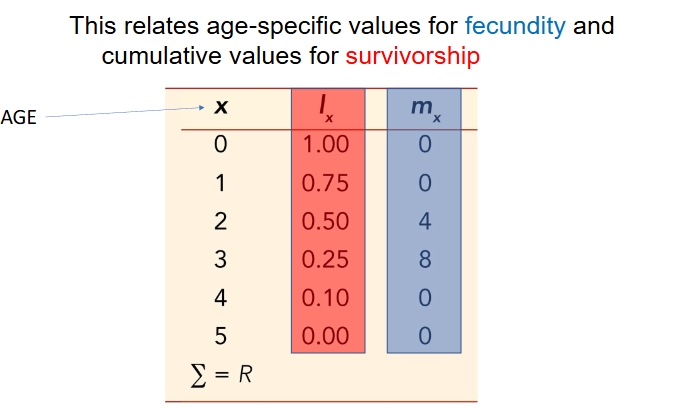
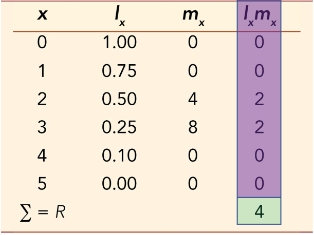
What does ‘lxmx’ represent on a Life Table? R?
lxmx represents the offspring produced at each age per female
R is the total number of offspring produced per individual
What is the Reproductive Rate Equation?
Nt+1=NtR
Nt+1= population size at next gen
Nt= population now
R= Net Reproductive Rate (indicates whether population is increasing or decreasing)
Life history
the pattern of survival and reproduction events during the life of an organism
studied to observe how life tables vary among populations with different abiotic and biotic components
Ex. The study on beavers identified that there is a high mortality when juvenile beavers first start leaving the den
What are Fitness Trade-Offs?
Fitness Trade-offs occur because every individual has a restricted amount of time and energy at its disposal (has limited resources)
Ex. if a female devotes a lot of energy to producing many offspring, she cannot devote same energy to growth
Female maximizes fecundity, maximize survival/growth, or find a balance between the two
What does an organism’s life history describe?
how an individual allocates resources (includes survivorship, age-specific fecundity, age at first reproduction, growth rate)
life history is shaped to maximize individual’s fitness in its environment
Explain the Life-History Patterns (Survivorship and Fecundity)
High Fecundity and Low Survivorship:
many, small offspring
early maturity
small body
low disease and predator resistance
short life
Low Fecundity and High Survivorship:
few, large offspring
late maturity
large body
high disease and predator resistance
long life
Sequence of Counts in Population
N0, N1, N2, N3, N4, N5…
Nt= Population Size at Time/Generation t
For Example:
N0=8, N1=191, N2=201, N3=161, N4=156, N5=137
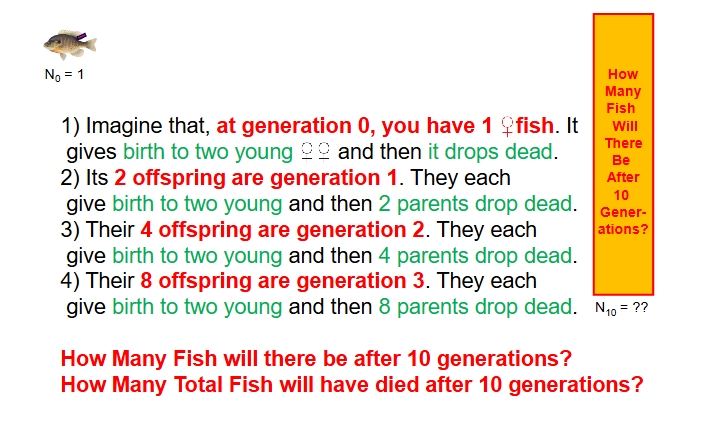
How many fish will there be after 10 generations?
How many total fish will have died after 10 generations?
Sequence of counts= Nt=N10
Nt=btN0 where b is the birth rate of daughters
Answer:
t=10
b=2
N0=1
N10= (210)(1)= 1,024 alive
N10 (dead)=(Nt-1)—>1,0124-1=1,023 dead
Model of Population Growth
Nt=btN0
t= number of generations
b= birth rate
N0= initial population size at generation 0
Model of Population Growth with a Death Rate, d
Nt=(1+b-d)t N0
t= generations
b= birth rate
d= death rate
N0= initial population size at generation 0
Population’s Overall Growth Rate (change in population size per unit in time)
ΔN/Δt= Births - Deaths + Immigrants - Emigrants
What is the Population Growth Equation when no immigration or emigration is occurring?
ΔN/Δt= B - D
Ex. A population of 1,000 rabbits
over 1 year, there was 100 births and 50 deaths
=50 rabbits a year
Population Growth Equation expressed per individual in population in reference to
(ΔN/Δt= B - D)
ΔN/Δt= bN-dN
Per capita birth rate (b)= 100/1,000=0.10
Per capita death rate (d)= 50/1000=0.05
ΔNΔt= (0.10×1000) - (0.05×1000)
Exponential Growth Equation
used to calculate per capita growth rate at a given moment in time (present, instantaneous)
dN/dt=rN
where r simplifies b and d
r>0, growing
r<0, declining
r=0, stays the same (at equilibrium)
R=rN=(ΔN/Δt) = Population Growth Rate
r= per capita growth rate, when is r is known, ask: how many individuals, N, are in popul.? (N needed for rN= Population Growth Rate
R= population growth rate (if you know R, you know Population Growth Rate
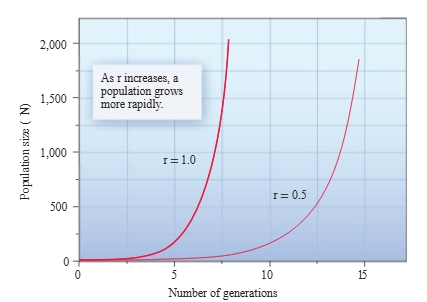
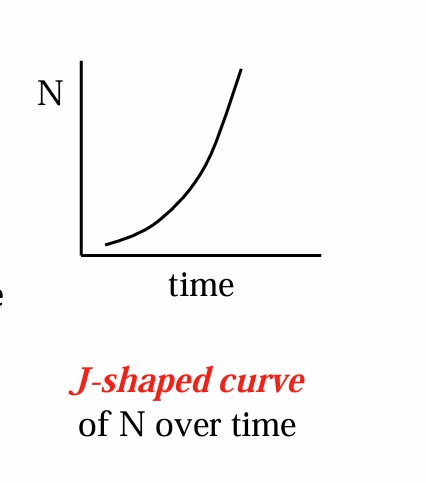
Exponential Population Growth Model
when growth with r>0 is plotted graphically, a J-shaped curve is shown (as the r becomes larger, the slope of the curve becomes steeper, r is also constant)
Equation: dN/dt = rN
When does Exponential Growth occur?
occurs when resources are not limiting
does not depend on density (density-independent)
Basic Equation for Exponential Growth
R=rN=ΔN/Δt
what one individual adds = per capita population increase = r
what all N individuals add = total population growth = R
Ex: Per capita birth rate (b) = 100/1,000 = 0.10
Per capita death rate (d) = 50/1,000 = 0.05
where r simplifies b and d
ΔN/Δt = (0.10 x 1000) – (0.05 x 1,000)
= (0.10 – 0.05)1,000 = 50 per year
Per Capita Growth Rate Equation
Divide R (Population Growth Rate) by N to get r, the “per capita” Growth Rate
r= ΔN/Δt=R/N= Per Capita Growth Rate
(1/N means “per capita” or “per individual”)
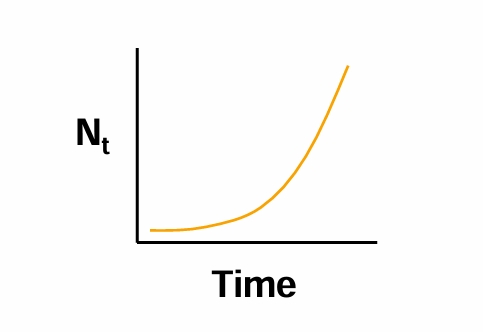
1st way of Graphing Exponential Growth
Plot population size, N, against t, time
Population Size increases with time and makes a J-shaped Curve of exponential growth
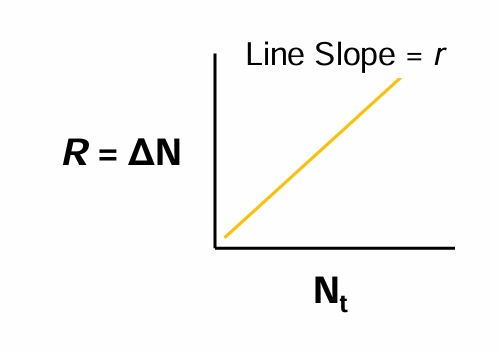
2nd way of Graphing Exponential Growth
Plot R= ΔN against Nt
Population Growth Rate, R, is proportional to Population size or Density
(more individual = more growth)
Example from rabbits:
0.05 x 1000 = 50 per year
0.05 x 2000 = 100 per year
0.05 x 3000 = 150 per year
0.05 x 4000 = 200 per year
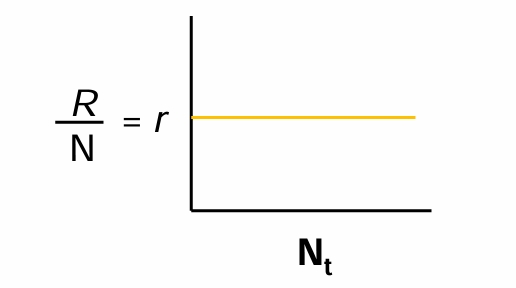
3rd way of Graphing Exponential Growth
Plot R/Nt or ‘r’ against Nt
Population Growth Rate per capita, R/N, is constant as population size or density changes. Density, N, does not affect the birth or death rate.
Assumptions of the Exponential Growth Model
Per capita rate of increase, r, is constant
(birth and death rates are constant)
No emigration or immigration
Either no age structure, or a stable age structure
No genetic variation in growth rate
shows J-shaped curve of Population (N) over time