Perception -problem solving + intelligence
1/95
Earn XP
Description and Tags
last 3 prob solving
Name | Mastery | Learn | Test | Matching | Spaced | Call with Kai |
|---|
No analytics yet
Send a link to your students to track their progress
96 Terms
decision making vs problem solving and reasoning
Unlike problem solving (finding a path to a goal) or reasoning (deriving new conclusions from known premises), decision making requires acting despite uncertainty.
Judgement and Expected Value
Decision making requires judgment—assigning value to outcomes.
Expected Value (EV)
A normative rule: sum of all possible outcomes × their probability.
Example used in lecture:
Would you pay $4 to flip a coin for a chance to win $10?
EV(yes) = 10×0.50 – 4×1 = $1
EV(no) = 0×1 = 0
Therefore, EV suggests: yes, you should play.
This illustrates why uncertainty enters immediately:
once probabilities are involved, outcomes can no longer be known in advance.
Fundamental Problem — Uncertainty
Non-trivial decisions almost always involve uncertainty. People generally:
Dislike uncertainty
Prefer certain outcomes even when the uncertain option has a higher EV
Discount uncertain payoffs systematically
This leads into probability discounting and future discounting
probability discounting: the subjective value of a reward decreases as the probability of receiving it goes down. For example, a 50% chance of winning $100 is worth less to most people than $50 received for certain
future discounting: devalue future rewards in favor of immediate ones
Probability Discounting
(Green et al., 1999)
People accept below-EV offers when outcomes are uncertain.
This discounting follows a hyperbolic function:
Greatest discounting occurs at moderate–high probabilities
For very low probabilities, people sometimes inflate the value (e.g., lottery behaviour)
Tutorial eg
In the class demonstration:
For a 95% chance of $1000, the EV is $950
→ But students valued it around $800.For a 50% chance of $50,000, EV = $25,000
→ Students were willing to accept about $10,000.
This demonstrates:
We discount uncertain outcomes relative to their EV
Discounting is steeper for larger amounts
For extremely low probabilities, people may value uncertain rewards more, explaining lotteries
The hyperbolic pattern = steep discounting at high certainty, then flatter as probabilities become small.
Future Discounting research
Green, Fry & Myerson (1994) showed:
Discounting is hyperbolic:
biggest drop between the present and immediate future
smaller differences far into the futureYoung adults and children discount more than older adults.
Older adults in affluent societies have learned that future rewards are generally reliable → lower discounting.
This reveals another form of uncertainty sensitivity:
the further into the future, the less people value the same objective amount.
Expected Utility Theory
People choose the option that maximises expected utility, not necessarily expected value.
Utility = subjective satisfaction or desirability of an outcome (not identical to money).
Bernoulli (1738): Utility is non-linear
The relationship between money and utility is curved:
The first $100 increases utility more when you have nothing
The same $100 means far less when you already have a lot
This explains why risk preferences vary by wealth and why people may refuse objectively positive EV gambles.
Evaluating Expected Utility
Expected utility is a normative theory of what people should do under ideal assumptions.
But:
Real behaviour often violates utility maximisation
Example from Thaler (2015): Taxi drivers work less on busy/rainy days (when fares are abundant) and work longer on slow days — the opposite of utility maximisation.
Drivers use a daily income target (a mental account) rather than maximising expected returns.
Therefore:
Expected utility helps evaluate decisions
But it does not describe how decisions are actually made
Outcome Bias
People often judge the quality of a decision by its outcome, not the process.
But:
A good decision can lead to a bad outcome
A bad decision can, by luck, produce a great outcome
Example from another episode:
Contestant with $1 and $1,000,000 left Rejected a ~$400k offer → ended with $1
Thus, good luck ≠ good decision making, and bad luck ≠ poor reasoning.
Evaluating decisions requires examining the process, including how the person handles uncertainty, not the result.
bounded rationality + satisficing
Herbert Simon (1955):
People operate under bounded rationality:
limited memory, information, time, and cognitive capacity.Instead of optimising, they satisfice:
choose an option that is “good enough” given constraints.
Decision making involves navigating uncertainty with imperfect information and limited capacity.
Heuristics
Heuristics = mental shortcuts or “rules of thumb.” They exist because the world is complex and information is incomplete. They allow people to “leap over” gaps in information by relying on cues that are easily accessible, emotionally salient, or cognitively simple.
They:
Compensate for limited info or cognitive capacity
Are used
when probabilities are unknown,
outcomes are unclear,
and options cannot be evaluated precisely.
Allow fast, reasonably effective judgments
Work across many contexts
Often substitute an easy question for a hard one
(e.g., instead of calculating EV, the contestant might ask “How many big numbers are left?”)
BUT:
Heuristics are not always correct
They produce plausible, not guaranteed, conclusions
Heuristics help because they usually work, but they introduce biases.
Biases in Judgement -4 types
Biases = systematic distortions in judgment.
1. Overconfidence: People are more confident in predictions than justified.
Study example (Kahneman, 2011): CFOs predicted S&P 500 index for years -11,600 forecasts -Zero correlation with actual index values --They also gave “90% confidence intervals” → but 67% of outcomes fell outside their predicted range → massive overconfidence
2. Loss aversion: People weigh losses more than gains.
In Deal or No Deal: Focusing on what you could lose (“$102,500 could vanish!”) pushes people to take a deal early.
3. Framing effects: How information is presented influences choice.
Dean’s comment: “To me it was just numbers on a board.”
→ By mentally reframing high-stakes money as abstract numbers, he reduced emotional loss aversion.
4. Influence of dubious information: People are affected by irrelevant cues (“What does Box 23 think he has?”). Shows how uncertain decision environments invite superstitions and noise.
Adaptive value of biases
Despite appearing irrational, many biases are adaptive on average:
Overconfidence encourages action and persistence
Loss aversion protects from catastrophic losses
Framing allows efficient processing
Sensitivity to information—even dubious—may help when environmental cues are unreliable
Why We Use Heuristics and Biases
Because information gaps and cognitive limitations make optimisation impossible.
Humans evolved to make satisficing, not perfect, decisions.
Heuristics and biases often increase survival and efficiency, even if they can mislead in modern or artificial situations.
Availability Heuristic
The availability heuristic involves judging the frequency, likelihood, or importance of an event based on how easily examples come to mind.
relies on a general cognitive assumption: Events encountered often or deeply are strengthened in memory and therefore retrieved more easily.
Why availability is often useful
More common events are typically more familiar
Highly rehearsed information is retrieved faster
Ease of recall often correlates with real-world frequency
Thus, availability is often a valid cue.
When Availability Fails: Media distortion of frequency judgments
Slovic, Fischhoff & Lichtenstein (1979) showed that the availability heuristic can lead to severe misjudgements about causes of death.
Participants judged: Plane crashes, Shark attacks, Other dramatic events - as more likely than mundane causes such as: Falls from ladders, Asthma, Diabetes
—> Reality is the opposite.
Media coverage is the main cause:
Dramatic events → heavy coverage → strong memories → inflated perceived probability
Common but non-dramatic events → little coverage → weak memory → underestimated probability
Consequences
Fear of flying despite flying being far safer than driving
Conspiracy theories, which “feed” on selective recall:
people remember evidence that fits their belief, strengthening the illusion that such evidence is abundant
Representativeness Heuristic
involves judging how likely something is by assessing how similar it is to the typical member of a category.
We ask: “How much does X resemble Y?” rather than “What is the probability of X given Y?”
It draws on a basic cognitive operation: similarity assessment.
The Steve Example (Tversky & Kahneman)
Steve is shy, orderly, withdrawn, and detail-oriented. —Is he more likely a salesperson or a librarian? Most people choose librarian because he fits the stereotype.
But the base rate is:
Hundreds of times more salespeople than librarians
Even if his personality fits the librarian stereotype, mathematically he is more likely to be a salesperson
Key Problem: Base Rate Neglect
The representativeness heuristic leads people to ignore prior probabilities, or base rates, focusing instead on similarity of description.
Overconfidence definition
A systematic tendency to be more certain than justified.
Why overconfidence persists
Confidence increases with more information—even dubious information
Overconfidence may be adaptive:
without it, underconfidence could paralyse decision makingPeople routinely attempt ambitious tasks (“If I’d known how hard this book would be, I never would have started.”) → overconfidence enables action
Endowment Effect
(Kahneman, Knetsch & Thaler, 1990). The endowment effect shows that ownership itself increases perceived value.
Setup:
Sellers receive a mug and state minimum selling price
Choosers state how much money they would accept instead of the mug
Same object, same economic value, but:
Sellers median price = $7.12
Choosers median price = $3.12
Why? Sellers face a loss of the mug, choosers face a gain of the mug.
Losses loom larger than gains → endowment effect, a direct result of loss aversion.
Loss Aversion
in Gambling Decisions
People reject a sure 50–50 gamble:
+$200 gain vs –$100 loss
even though EV is positive.
Loss aversion weights losses roughly twice as strongly as equivalent gains.
Loss Aversion in Real Markets (Odean, 1998)
Investors prefer to sell winning stocks
And hold losing stocks
This systematically reduces their financial returns
→ They cling to losers to avoid “realising the loss”
Status Quo Bias
Because giving up what we already have feels like a loss, people prefer to maintain the current state (the status quo), even when alternatives are objectively equivalent or better.
Example:
Participants were given money split between two categories (e.g., stocks vs property).
They were told they could freely switch to the other allocation.
Most participants kept the existing allocation, regardless of which version they initially received.
The content is identical; only the initial framing changed.
Status quo bias = endowment effect applied to general states of affairs.
Prospect Theory
Prospect theory (Kahneman & Tversky, 1979) formalises how people evaluate risky prospects.
Key Features
Value function is concave for gains
Diminishing sensitivity: each additional gain matters less.
Convex for losses
Losses feel steeper and hurt more than equivalent gains feel good.
Losses loom larger than gains
Explains the endowment effect, status quo bias, Deal-or-No-Deal behaviours.
Reference point matters
Whether an outcome is a “gain” or a “loss” depends on context and representation.
Moving the reference point shifts the entire interpretation of the same outcome.
Prospect theory therefore emphasises representation, not objective value, in determining decisions.
Framing Effects
— When Equivalent Outcomes Feel Different
Framing = the representation of options.
judgments are not simply about objective value but about the context within which options are understood.
Tversky & Kahneman’s Coin-Toss Framing Task
Participants were given two versions of a scenario, which were mathematically identical but conceptually framed as: 1.A gain frame 2.A loss frame
Gain frame:
“Imagine you are $1000 richer.” Then choose:
Sure gain of $500
50% chance of gaining $1000 (or nothing)
→ 81% take the sure gain.
Loss frame:
“Imagine you started $2000 richer.” Then choose:
Sure loss of $500
50% chance of losing $1000 (or nothing)
→ Only 55% take the sure option; 44% gamble.
Interpretation
When framed as gains, people prefer certainty (risk aversion).
When framed as losses, people prefer the gamble (risk seeking).
Yet the underlying outcomes are the same in both versions.
This illustrates that the representation, not the actual payoff structure, drives behaviour.
Choice Architecture — Irrelevant Options Influence Preferences
Expected utility theory assumes you evaluate each option independently.
But people do not: the set of surrounding options changes how they value an item.
Simonson & Tversky (1992): Pen and Cash Study
Two-option condition:
$6
Nice pen
→ 36% choose pen
→ 64% choose cash
Three-option condition:
$6
Nice pen
Cheap pen (clearly inferior)
Almost no one chooses the cheap pen (2%), but:
Nice pen jumps to 46%
Cash drops to 52%
Interpretation
The presence of a clearly inferior “decoy” option:
Makes the nice pen look comparatively more attractive
Shifts valuation through contrast
Alters judgments even though the real options haven’t changed
Marketers exploit this constantly.
Anchoring
occurs when people’s judgments are influenced by an arbitrary starting point.
In most real-life scenarios, initial numbers do contain information (e.g., negotiation starting prices). Therefore humans are biased to treat initial numbers as meaningful—even when they are not.
This bias can override expertise.
Classic Demonstration (Tversky & Kahneman, 1974)
Question: “What percentage of UN member states are African?”
Before answering, participants spin a wheel rigged to show 10 or 65.
Results:
If wheel = 10 → estimates average 25%
If wheel = 65 → estimates average 45%
Even though participants know the wheel is random, it still shifts their judgement.
Hindsight Bias
— “I Knew It All Along”
arises when, after learning an outcome, people struggle to imagine alternative possibilities.
Features
We overestimate how predictable the event had been
We forget our prior uncertainty
We reinterpret ambiguous evidence as having clearly pointed to the actual outcome
Implications
Strengthens outcome bias
Makes good outcomes seem like proof of good decisions
Makes bad outcomes seem like proof of bad decisions
Prevents accurate learning from experience
Feeds confirmation bias and conspiracy thinking
Evidence is reframed as having “always pointed to this”
Competing explanations are ignored
Promotes nostalgia
When looking back, we forget the possible negative outcomes that didn’t occur
Past seems safer and better than the present, where potential threats still exist
Hindsight bias therefore distorts memory, reasoning, and emotional judgments.
Emotion as an Essential Component of Decision Making
Damasio (1994): The Case of Elliott
Tumour removed from orbitofrontal cortex, IQ unchanged, but Emotional responsiveness drastically reduced
Consequences
Elliott: Could no longer make ordinary decisions, Became paralysed even by trivial choices (e.g., lunch), Lost job, Divorced, Bankrupted, Required parental support
Interpretation
Emotions serve as markers of:
Preference
Value
Judgement
Without emotional signals, no option feels better or worse, making decisions impossible.
Emotion does not replace reasoning— but without it, reasoning lacks direction.
Implicit Theories of Intelligence
Implicit theories are the personal beliefs, assumptions, and intuitive ideas individuals have about the nature of intelligence.
Characteristics of implicit theories:
Subjective and untestable:
People cannot easily prove their beliefs right or wrong.Highly variable:
Different people rely on different cues (e.g., cleverness, success, speed of thought, adaptability).Resistant to challenge:
Because they aren’t tied to data, they persist even when contradicted by evidence.
construct validity vs criterion-related validity
Construct evidence
Does a test relate to other measures of the same construct in a meaningful way?
Criterion evidence
the degree to which a test or measurement correlates with a specific, real-world outcome or "criterion"
Can intelligence test scores predict meaningful outcomes (e.g., academic success)?
Explicit Theories of Intelligence
Explicit theories use systematic data collected from people performing tasks requiring intelligent cognition. They aim to:
Operationalise intelligence through observable behaviours
Measure those behaviours through tests
Construct testable predictions
Evaluate theories using construct validity and criterion-related validity
Key point:
Explicit theories can be proven wrong, unlike implicit theories.
Limitations
Many explicit theories exist; none captures everything.
What counts as “intelligence” depends on how you define and measure it.
Historical Foundations of Intelligence Testing -3 sorry individuals and 1 critique
Samuel George Morton (1830s–1850s): measured skull volume to “validate” preconceived group differences in intelligence.
he Ignored gender and stature differences, Biased measurement (packed mustard seeds differently depending on the racial group)
Paul Broca (1824–1880): replicate and expand Morton’s findings using “more precise” anatomical measurements: cranial index (length–width ratio), brain weight where possible. —> Le Bon (1879) women’s brains being “closer in size to gorillas”
Eugenics and William Shockley (1985): Claimed low-IQ Black Americans were causing “backward evolution.” Attributed group differences to inherited racial differences, not socioeconomic inequality. Proposed paying people with IQ < 100 to undergo voluntary sterilisation.
Stephen Jay Gould’s Critique: The Mismeasure of Man (1981/1996) provides a detailed, critical history of biased intelligence measurement and the misuse of science to justify inequality.
Emergence of Modern Intelligence Testing -Alfred Binet (Early 1900s)
Motivation
Binet wanted an objective method for identifying schoolchildren who required additional support—not to rank innate worth.
Problems with Prior Methods
Broca’s anatomical measurements had no external validity.
The assumption that skull size = intelligence was fundamentally flawed.
Binet’s Solution
Develop a set of behavioural tasks that required reasoning, problem-solving, and learning.
Legacy
His work formed the basis of the Stanford–Binet Intelligence Scale, a major foundation for modern IQ testing.
The Stanford–Binet Test
Structure
A battery of separate tests arranged roughly by difficulty.
Items are intermixed to prevent boredom.
Some tests cover the entire age range; others target specific developmental levels.
Administration
30–90 minutes
Conducted by a trained psychologist
Adaptations exist for:
blind individuals,
motor-impaired individuals,
deaf individuals,
culturally appropriate translations.
This was the first scalable attempt to measure intelligence objectively.
Why Relative Scores Matter
A single raw score (e.g., 8/10) has no interpretation unless compared to a standardization sample.
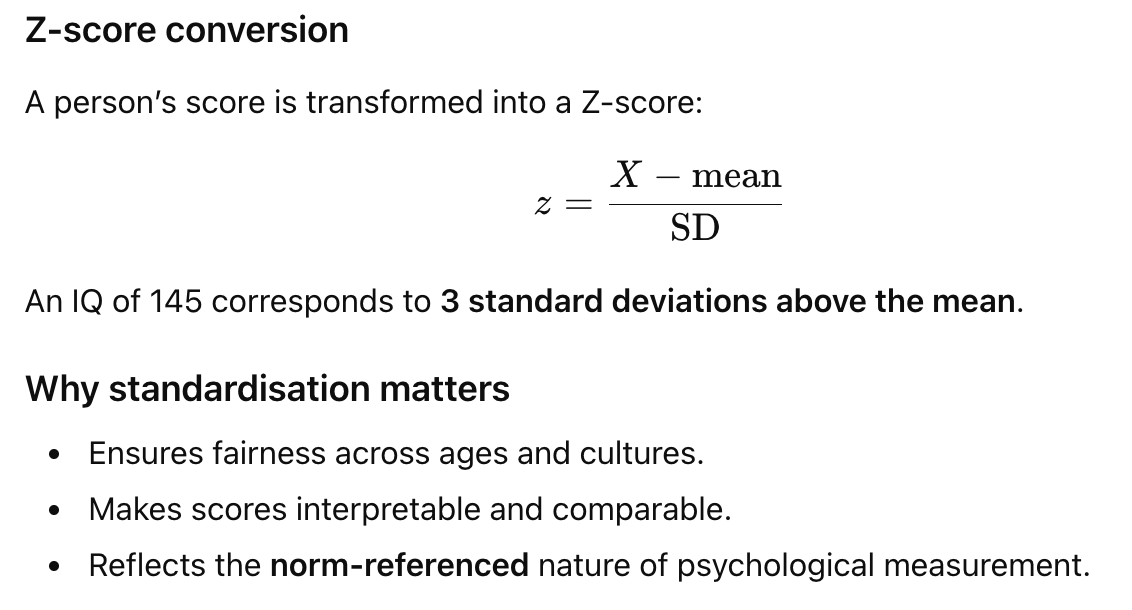
Deviation IQ (Wechsler)
IQ reflects how far a person deviates from their group’s mean performance.
Standard conventions
Mean IQ = 100
Standard deviation = 15
What Do Experts and the Public Believe Intelligence Is?
Sternberg (1981) Study
Consensus Themes
Verbal intelligence
good vocabulary, articulate speech.
Problem-solving ability
reasoning, planning ahead, abstract thinking.
Practical intelligence
adapting to life demands, achieving goals, common sense.
Implication
Current IQ tests capture verbal and problem-solving abilities well—but often miss practical intelligence.
Positive Manifold
is The Core Evidence for ‘g’
Spearman noticed that any set of cognitive tasks—no matter the content—tends to produce positive correlations between every pair of tasks. Examples include:
memory ↔ reasoning
verbal ↔ spatial
In every dataset:
all correlations were positive, although not equally large.
This held even when tasks seemed unrelated in surface content.
⭐ The Law of Positive Manifold
All cognitive tests correlate positively with one another.
It suggests that diverse tasks share something in common—leading Spearman to propose a common underlying factor.
Spearman’s Two-Factor Theory
Spearman proposed that performance on any task reflects:
1. A general factor: g
The part of performance shared across all mental tasks.
A statistical abstraction representing common variance.
2. A specific factor: s
Unique to each task (e.g., vocabulary knowledge, arithmetic skill, musical ability).
Explains why correlations are positive but not perfect.
3. Error (E)
Random influences (sleep, motivation, noise, chance item matches).
Ensures scores fluctuate slightly from occasion to occasion.
What Does g Represent?
According to Spearman:
not a single skill,
not a specific cognitive process,
but “mental energy” or a general reasoning capacity.
In practice, g is simply the shared variance among tasks—whatever processes explain why doing well on one cognitive task predicts doing well on another.
Different tasks “load” on g to different degrees:
tasks like classics or math may load strongly,
tasks like music may load more weakly.
Thus:
👉 g is not located in a skill; it’s located in the overlap among skills.
Biological Interpretation:
Arthur Jensen
g is a biological property of the brain
not a learned skill or behaviour,
but a biological capacity that produces positive manifold.
IQ is a phenotype
your test score is an observable expression,
driven by underlying biological differences.
g is stable and highly replicable
factor-analytic structure is remarkably consistent,
so evidence against its existence is extremely unlikely.
g is not itself a cognitive ability
you cannot practise or “train” g directly,
but g influences all cognitive tasks.
Jensen emphasised that IQ/g correlates with:
academic outcomes,
occupational success,
economic performance,
various life outcomes.
He also argued that:
no sex differences appear in g,
group differences (e.g., ancestry in North American samples) appear primarily on tasks with high g loadings.
Complexity Interpretation -how word ‘intelligence’ is unhelpful and what g represents
Linda Gottfredson
“intelligence” (the word) is unhelpful
Researchers attach the term to countless unrelated skills (practical intelligence, creative intelligence, emotional intelligence, etc.).
No expert consensus can override public beliefs or cultural connotations.
Thus:
👉 The only scientifically stable concept is g, not “intelligence.”
What g Represents
g is a recurrent dimension of human variation,
emerging from the brain working as an integrated system,
and reflected in a person’s ability to make sense of their environment, catch on quickly, and figure out what to do.
It is:
cognitive, not emotional or social,
stable, not easily shifted by mood or motivation.
⭐ Complexity is what cognitive tasks share, and therefore complexity is what g measures.
complexity interpretation -high-g vs low-g individuals and evidence
⭐ Complexity is what cognitive tasks share, and therefore complexity is what g measures.
High-g individuals have an advantage when tasks are:
instrumental → accuracy matters
complex → require managing multiple ideas
independent → require self-directed problem solving
information-heavy → demand abstraction and reasoning
Low-g individuals face increasing difficulty navigating:
modern bureaucratic systems,
technological environments,
cognitively demanding workplaces.
Evidence From Jobs
Occupations vary in complexity (e.g., lawyer > systems analyst > machine operator > packer).
More complex jobs tend to be occupied by individuals with higher average g.
Gottfredson interprets this as:
g predicts performance best when complexity is high,
complexity amplifies the functional relevance of g,
modern workplaces reward individuals who can learn, adapt, and integrate large amounts of information.
Thus:
👉 Complexity, not “intelligence,” is the key ingredient linking g to real-world outcomes.
Challenges and Alternative Explanations of g
1.“g is a Statistical Artifact”
tasks look correlated simply because they all require basic shared processes (attention, working memory, being conscious and motivated),
or because they share measurement formats,
not because an underlying general ability exists.
👉 g exists because tests are structured similarly—not because minds are structured similarly.
2.The Predictive Weakness Argument
Although g correlates with outcomes like grades and job performance, the effect sizes are: ~0.3 to 0.4 correlations, meaning g explains 9–16% of variance — leaving 80–90% unexplained.
Critics argue: this hardly justifies calling g the “most important” psychological construct, at the individual level, prediction is weak.
3.Sampling Theory
every task “samples” from multiple underlying cognitive processes (memory, processing speed, reasoning, attention),
tasks differ only in how much they draw from each process,
therefore positive manifold emerges because tasks share overlapping cognitive demands.
Problem for this theory
Weird mismatches occur:
tasks that seem similar (e.g., digit span vs backward digit span) don’t always correlate strongly,
tasks that seem dissimilar (e.g., simple visual processing vs matrices) sometimes correlate highly.
These anomalies weaken the sampling explanation.
4.Mutualism Theory
early in life, cognitive abilities (memory, reasoning, vocabulary, etc.) are uncorrelated,
but over development they become correlated because cognitive skills help each other grow.
Example:
good memory → better learning → better reasoning → better comprehension → richer vocabulary → even better reasoning, and so on.
A virtuous (or vicious) cycle:
👉 strengths amplify other strengths; weaknesses amplify weaknesses.
Thus, positive manifold is a developmental product, not an inborn property of the mind or brain.
Sternberg’s Core Philosophy: What Counts as “Intelligence”?
Sternberg argues that the term intelligence has become overloaded with meanings. Instead of forcing the field to agree on a single definition, he reframes intelligence around:
👉 What allows a person to achieve success in their own sociocultural context.
This leads him to analyse:
the processes underlying cognitive performance (information-processing approach),
the environments people must adapt to, and
the role of prior experience in shaping skill development.
His approach is component-based: he examines the specific cognitive operations involved in problem solving.
The Triarchic Theory of Successful Intelligence
Sternberg proposes three distinct but interacting forms of intelligence, each tied to a different “world”:
Analytic intelligence → the internal world
Practical intelligence → the external world
Creative intelligence → the world of experience
These three abilities together determine whether a person achieves successful intelligence
The ability to achieve success in life (according to one’s personal standards and sociocultural context) through balancing analytic, creative, and practical strengths, while compensating for weaknesses, by adapting to, shaping, or selecting environments.
The definition highlights:
personal goals
sociocultural norms
adaptation + self-awareness
environmental fit
This immediately creates a tension with standardisation: if success is idiosyncratic, how do we measure individual differences objectively?
Analytic Intelligence (Academic Intelligence)
the domain traditional IQ tests already capture
concerns the cognitive processes used to solve problems inside one’s head, such as those tested by matrices, verbal reasoning, or abstract puzzles.
Sternberg breaks these processes into three components:
Metacomponents: govern executive control —Planning how to solve a problem, Monitoring strategy effectiveness, Evaluating whether the answer is adequate
Knowledge-Acquisition Components: support learning and comprehension —Selective encoding (identifying relevant information), combination (integrating information), comparison (comparing new and known information)
Performance Components: the “workhorse” processes applied during tasks like matrices —Perceiving patterns, Inferring relationships, Executing cognitive operations
Practical Intelligence
Practical intelligence concerns how effectively people deal with real-world environments—especially unstructured or socially complex situations.
Practical intelligence is assessed using tacit knowledge tasks.
Three Ways People Maximise Person–Environment Fit; strategic forms of adaptation
1. Adaptation: Change yourself
Modify behaviour to fit the environment
e.g., staying quiet in a workplace culture that discourages outspoken discussion
2. Shaping: Change the environment
Alter the environment to better match your strengths
e.g., restructuring your job tasks, switching lecture format to online delivery, redesigning workflows
3. Selection: Change environments entirely
Choose contexts that suit your abilities
e.g., choosing a trade instead of university, selecting a job aligned with your strengths
These are central to “success,” but difficult to incorporate into standardised assessment.
What is Tacit Knowledge?
Tacit knowledge is:
not explicitly taught,
acquired with little social support,
highly context-specific,
instrumental for achieving personal goals.
Examples include:
workplace norms,
intuitions about how to handle interpersonal dynamics.
Tacit knowledge helps individuals perform effectively even without explicit instruction.
How Tacit Knowledge Tests Work + predictive validity
Tests typically use scenario-based judgement tasks.
Example (managerial tacit knowledge test):
“Rate the importance of the following priorities when choosing a project…”
(Options: pleasing the supervisor, gaining visibility, minimising risk, networking with executives, personal interest)
Scoring Methods
Consensus scoring
Points based on how many test-takers choose each option.
Expert scoring
Points based on how many experts choose each option.
There is no single correct answer → the score reflects how well individuals’ judgements align with typical or expert reasoning.
Predictive Validity
Tacit knowledge correlates moderately with real-world outcomes:
r = .34 with company-level success
r = .46 with salary
(higher than many correlations observed for g in workplace settings)
Sternberg argues that once people meet a minimum threshold of analytic ability, practical intelligence differentiates success far more strongly.
Creative Intelligence
Where analytic intelligence excels at solving structured problems, creative intelligence enables individuals to:
handle tasks that are novel,
generate new approaches,
reinvent or reframe problems,
and develop automated expertise through practice.
Sternberg calls this the experiential subsystem, involving:
Two Key Processes
Dealing with novelty
confronting unfamiliar problems without pre-existing routines
generating new strategies before automation is possible
Automatization
transforming effortful processes into automatic ones through experience
The novelty→automation pathway captures how people become experts.
What Is Creativity? and 3 levels of conceptualisation
Creativity =
👉 producing work that is both novel and appropriate. (Sternberg & Lubart, 1995)
Creativity is conceptualised at multiple levels:
Big-C → eminent creativity (artists, inventors, groundbreaking scientists)
Little-c → everyday creativity (new solutions to workplace or personal problems)
Mini-c → personal, developmental creativity (new insights, personal learning moments)
Convergent vs Divergent Production
earliest influential model (Guilford) distinguished:
Convergent Production
Producing one correct answer
Typically aligned with analytic intelligence, not creativity
Divergent Production
Generating many possible answers from a single stimulus
Core of creative thinking
Classic task:
“How many uses can you think of for a fork / paperclip / brick / tyre?”
Scoring Divergent Thinking
1. Ideational Fluency
Number of ideas generated
Easy to measure (e.g., 16 uses for a fork)
2. Flexibility
Number of different categories of ideas
e.g., clothing, gardening, art/craft, weapons, insulation, sports
3. Originality
Statistical infrequency of responses
Rare/unusual ideas receive higher scores
4. Other scoring considerations
Appropriateness of ideas
(But this is subjective → difficult to operationalise)
Types of Divergent Thinking Tasks
Unusual uses (common objects)
Instances of common concepts (“things that are loud”)
Consequences of hypothetical events (“what if humans no longer needed sleep?”)
Similarities between concepts (milk vs meat)
Scientific divergent thinking (generating multiple hypotheses from results)
Limitations of Divergent Thinking Measures
1. Originality confounded with fluency
The more ideas you generate, the more likely some will be statistically rare.
2. Statistical rarity ≠ true creativity
An idea may be rare because it is nonsensical, not creative.
3. Speeded tests
Creativity in real life is slow, iterative, and developmental.
Timed tasks reward fast thinkers, not necessarily creative ones.
4. Low reliability across stimuli
Creativity scores change depending on the object used (paperclip vs fork vs tyre).
5. Weak correlation with real-world creative achievement
Artists or creative professionals do not consistently score higher on divergent thinking tasks.
Thus, divergent thinking is only a proxy for creativity, not a full measure.
5 ways Sternberg Differs From Spearman
Multidimensionality
Sternberg argues that intelligence = analytic + practical + creative
Spearman: intelligence = one general factor
Context-dependence
Sternberg emphasises fit between person and environment; Spearman does not.
Process-based vs variance-based
Sternberg focuses on cognitive processes underlying tasks.
Spearman focuses on statistical covariance among tasks.
Definition of success
Sternberg ties intelligence to personal goal attainment.
Spearman does not define “success” at all—only shared variance.
Measurability
Sternberg’s theory is harder to standardise because success is idiosyncratic.
Spearman’s theory is highly standardisable.
Cool vs Hot Intelligences
ool intelligence—emotionless, abstract, rational problem-solving measured by traditional cognitive tests.
hot intelligences: forms of intelligence involving emotions, feelings, interpersonal understanding, and self-regulation.
4 Historical thoughts on Social & Emotional Intelligence
Thorndike (1920): Social Intelligence
His definition of social intelligence: “The ability to understand and manage men and women, boys and girls — to act wisely in human relations.”
This emphasises interpersonal understanding, emotional sensitivity, and effective social behaviour.
Moss & Hunt (1927); Vernon (1933)
Extended Thorndike’s view: social intelligence = ability to get along with others. Requires judging others’ feelings, moods, motivations. Supports successful behaviour at work and home.
Kihlstrom & Cantor (2000)
Shifted toward social knowledge: Understanding scripts, norms, and schemas of social life, Social behaviour viewed as intelligent because it draws on expertise about the social world. Children learn emotional/social norms similarly to learning academic content
Wechsler (1958)
Wechsler argued social intelligence is not distinct: Social intelligence = general intelligence applied to social situations.
Challenges to Recognising Hot Intelligences
1.Overlap with Verbal Ability
Many EI (emotional intelligence) tests require reading emotion words or interpreting emotion-laden scenarios.
High EI scores often correlate with: Vocabulary, Verbal reasoning, Language comprehension
👉 Are EI tests measuring emotional skill, or simply verbal intelligence?
2.Limited Incremental Prediction
EI predicts outcomes above IQ, but the increments are often small:
EI adds only a few extra percentage points in prediction
Some critics argue this makes EI unnecessary as a construct
Still, even small increments can be meaningful (e.g., in workplace performance)
3.Scoring Difficulties (Veridical Scoring Problem)
Traditional intelligence tests have one correct answer.
Emotional/social tasks often involve subjective judgments:
“What emotion is this face showing?”
“Which response is most effective?”
We cannot objectively prove a response is incorrect, only that most people disagree.
Schneider et al. (2016) argue that EI can still be considered an intelligence if: It predicts theoretically relevant outcomes, It shows psychometric distinctness, It behaves similarly to established cognitive abilities
Two major hot intelligences:
1.Emotional Intelligence (EI): The ability to reason validly with emotions and emotion-related information, and to use emotions to enhance thought. This definition frames EI as a mental ability, not personality or disposition.
2.Personal Intelligence (PI): The ability to reason about personality — understanding motives, emotions, thoughts, and behavioural tendencies in oneself and others. PI is structurally similar to EI but focuses on personality-related reasoning, not emotions.
Two Theoretical Models of Emotional Intelligence
1.Ability Models: EI = a set of cognitive abilities for processing emotional information.
four branches:
Perceiving emotions
Using emotions
Understanding emotions
Managing emotions
This model considers EI analogous to traditional cognitive abilities and must therefore:
develop with age,
correlate with other abilities,
predict real-world performance,
show clear discriminant validity from personality.
2.Mixed Models: EI = a mixture of: emotion-related skills, personality traits, motivations, beliefs, social competencies, coping tendencies, stress tolerance, life satisfaction.
Issues with mixed models
Overlap heavily with personality (especially neuroticism, agreeableness, extraversion)
Hard to call an “intelligence” if it is really a personality questionnaire
High reliability comes from repeating similar self-report items, not cognitive skill measurement
Very easy to fake good
Two Measurement Models of EI
1. Measurement Type 1: Rating Scales (Typical Performance)
Self-report: “I can control my anger.”
Measures typical behaviour, not maximum ability
Quick, easy, cheap
High reliability
BUT:
Highly correlated with personality
Easily faked
Does not measure ability directly
Often conceptually inconsistent with EI theory
2 Measurement Type 2: Ability Scales (Maximum Performance)
These attempt to function like cognitive tests:
Identify emotions in faces
Choose the most effective emotional strategy
Understand transitions between emotions
Generate or suppress emotions when needed
Scoring uses:
Consensus scoring
Expert scoring
Strengths:
Not easily faked
Related to cognitive ability
Better aligned with EI theory
Weaknesses:
Few instruments exist
Time-consuming (≈1 hour)
Lower reliability
Relies partly on verbal comprehension
The Three EI Streams
Crossing theory × measurement produces:
Stream 1: Ability Model × Ability Measurement
The only stream that truly matches EI theory.
Includes Mayer–Salovey–Caruso Emotional Intelligence Test (MSCEIT).
Stream 2: Ability Model × Rating Measurement
Theoretically contradictory.
Asking people to self-rate emotional skills they may lack awareness of.
Stream 3: Mixed Model × Rating Measurement
Most widely used (e.g., EQ-i; Goleman-type EI).
Overlaps heavily with personality.
The Four-Branch (Hierarchical) Ability Model
Now the core of EI as a cognitive ability.
Branch 1: Perceiving Emotions
Ability to identify emotions from: faces, voices, body language, environmental cues.
Includes recognising subtle or mixed emotions.
Measured by tasks like identifying feelings from 100ms facial flashes.
Branch 2: Using Emotions (Emotional Facilitation)
Ability to: generate emotions to support thinking, shift mood to enhance decision-making, use feelings to guide attention, creativity, or memory
Example task: “Imagine an event that makes you feel mildly embarrassed. Describe how you feel.” (Scored by consensus similarity.)
Branch 3: Understanding Emotions
Ability to: label precise emotions, distinguish similar emotions, understand emotion blends (e.g., anxiety + excitement), predict transitions (“sad → frustrated,” “anxious → overwhelmed”)
Branch 3 correlates most strongly with verbal intelligence, highlighting overlap.
Branch 4: Managing Emotions
Strategic regulation of: one’s own emotions, others’ emotions
Measured through situational judgement tasks:
“Your friend shares good news. Rate the effectiveness of each response.”
This branch relates strongly to coping and social functioning.
Experiential vs Strategic Levels
Branches 1 & 2 → experiential (perceptual + immediate emotional processes)
Branches 3 & 4 → strategic (deliberate, meaning-based regulation)
Does EI Meet Psychometric Criteria?
1 Convergent Validity
Stream 1 correlates with g and with other EI ability branches
Shows developmental progression (older = higher EI)
2 Discriminant Validity
Stream 1 is distinct from personality
Mixed models fail this criterion
3 Incremental Predictive Validity
Even small increments matter:
Job performance: EI explains ~7%
= ≈4 extra weeks of productivity per yearCoping with stress: EI explains 10–15%
Eudaimonic well-being: EI explains ~29%
Academic achievement: small but reliable prediction (~.12–.25 depending on test)
Differences Across Jobs
Some jobs rely heavily on emotional labour (e.g., counselling, leadership, customer service) → EI much more predictive.
EI as a Causal System (Conceptual Integration)
Rather than viewing EI as a single entity, some theorists propose a causal chain among the four branches:
Perceiving emotions →
Understanding emotions →
Managing emotions →
Using emotions to facilitate thought
EI becomes a network of processes, not just a trait.
Another perspective:
EI may depend on and interact with cool cognitive abilities (processing speed, working memory, reasoning).
Emotion regulation may recruit cognitive control; emotion understanding may draw on language comprehension.
Thus, the hot–cool divide may be less distinct than earlier theorists believed.
empirical patterns challenging a purely “g-centric” view of ability
1 Intelligence only moderately predicts academic performance
IQ–GPA correlations rarely exceed .50, meaning 75% of GPA variance is unexplained by intelligence.
2 Ageing patterns contradict raw cognitive decline
Adults’ performance on fluid-type tests declines from mid-20s onward, yet their daily functioning remains high—suggesting knowledge/expertise compensates for reduced processing speed.
3 Over- and under-achievement
Teachers consistently observe:
Over-achievers → modest “ability” but exceptional performance
Under-achievers → high ability but poor performance
Pure ability theories cannot explain these discrepancies.
Conclusion:👉 Expertise and knowledge are not just by-products of intelligence. They require additional mechanisms.
Ackerman’s PPIK Theory of Adult Intelligence
Ackerman proposes that adult intellect is best understood as PPIK:
Intelligence-as-Process (raw cognitive functioning)
Personality (conative traits that influence motivation)
Interests (direction of cognitive investment)
Intelligence-as-Knowledge (accumulated expertise)
Intelligence-as-Process (P)
Equivalent to maximal performance: reasoning, processing speed, memory.
Key points:
Child vs adult difference:
Some tasks are “fluid” for children but become knowledge-based for adults due to learned strategies.Intelligence tests strip away knowledge, meaning they sample broad, content-free problem-solving rather than actual domain knowledge.
Without applying cognitive effort toward knowledge acquisition, high ability alone does not translate into expertise.
Personality (P)
Personality is weakly related to raw intellectual performance, but strongly related to knowledge acquisition.
Two traits matter most:
1. Openness to Experience
High scorers are:
intellectually curious
imaginative
flexible
motivated to explore ideas
These individuals naturally expose themselves to more learning opportunities.
2. Need for Cognition
Motivation to:
engage in complex thinking
solve difficult problems
enjoy cognitive effort
This motivates continued learning and deeper knowledge acquisition.
Interests (I)
Interests guide where individuals invest their cognitive effort.
Ackerman adopts a six-category model:
Realistic — hands-on, mechanical, physical work
Investigative — scientific, analytical thinking
Artistic — creative, aesthetic domains
Social — helping, teaching, interpersonal work
Enterprising — persuasion, leadership, business
Conventional — structured, rule-based, administrative tasks
People often span multiple interest domains (not exclusive categories).
Interests narrow across development:
early childhood → broad hobbies
adolescence → elective subjects
adulthood → field, company, team, role
👉 Expertise becomes increasingly specialised.
Intelligence-as-Knowledge (K)
A broader, richer construct than crystallised intelligence. Includes:
acquired academic knowledge
occupational expertise
avocational knowledge (skills in hobbies)
procedural knowledge
specialised long-term learning
Knowledge develops through:
👉 investment of process ability (fluid intelligence) + motivation (personality) + direction (interests).
PPIK components correlate not because they are the same thing, but because they interact dynamically to produce expertise.
Developmental Pathway Linking Abilities → Interests → Knowledge
Ackerman proposes a developmental model:
Ability level
Determines probability of success in a domain.Personality + interests
Determine motivation to pursue that domain.Success increases interest → increases practice → increases knowledge.
Failure reduces interest → reduces practice → less expertise.
This creates self-reinforcing spirals:
high ability + high interest → rapid expertise growth
high ability + low interest → low knowledge
low ability + high interest → frustration → disengagement
As common educational experiences diverge, individual differences widen.
Evidence for PPIK Theory
1 — Trait Complexes: Clusters of personality, ability, and interests tend to co-occur.
Examples:
Social/Enterprising Complex: Enterprising + Social interests, Higher extraversion, Higher wellbeing, Strong interpersonal competencies
Conventional/Clerical Complex: High processing speed, Traditional, conscientious, orderly traits
Science/Math Complex: High numerical reasoning, Visual–spatial abilities, Investigative traits
Intellectual/Cultural Complex: High crystallised intelligence, Openness to ideas, Artistic absorption, Ideational fluency
Trait complexes illustrate how the PPIK components cluster into functional profiles.
2 — Associations Between Abilities, Interests, Knowledge
Correlations show:
Fluid ability (Gf) → interest in math/science → domain knowledge in physical sciences
Crystallised ability (Gc) → intellectual/cultural curiosity → social sciences + humanities knowledge
Negative paths exist too: High conventional thinking can reduce likelihood of high humanities or physical science knowledge.
This shows that skills + interests shape domain-specific expertise, not general intelligence alone.
Ackerman’s 3 Conclusions
Middle-aged adults possess more domain knowledge than young adults, consistent with lifelong cumulative learning.
Declines in Gf do not prevent expertise growth, because knowledge is retained and continues to develop.
Gc predicts knowledge better than Gf, but even Gc is too broad; expertise is highly domain-specific.
Sternberg’s Objection to PPIK
Sternberg’s Objection
If knowledge depends on motivation + interests, then anyone could become an expert with enough investment.
Ackerman’s Response
Raw ability still constrains expertise:
Hard work is not enough
Low-ability individuals benefit from realistic goals, not endless effort
Talent still matters
The theory balances:
👉 Both ability and motivation are necessary for expertise.
Ericsson’s Theory of Deliberate Practice
Where Ackerman explains how adults choose what to become good at, Ericsson explains how they get good at it.
Core Idea
Expert performance is driven by deliberate practice:
structured
effortful
goal-directed
designed to exceed current ability
requires full concentration
produces consistent, measurable improvement
Expertise reflects the development of complex, modifiable mental representations—not biological limits.
Evidence for Deliberate Practice
Memory span training
Typical digit span: ~7–10 items
After 50 hours: ~20 items
After 200–400 hours: ~80 digits
Improvements reflect:learned encoding strategies
long-term memory support
expanded “functional” working memory
Physical performance
Push-up examples:
Typical adult: 8–32
1966 record: 6,000
1993 record: 46,001 in 24 hours
Shows massive improvability via practice.
what distinguishes an expert from a novice
Ericsson uses think-aloud protocols to compare novices vs experts.
Experts show:
Superior action selection
more sophisticated planning, reasoning, anticipation
Rapid encoding and storage
richer schemas make patterns recognisable at a glance
faster retrieval and manipulation of representations
Examples:
Chess experts mentally track game positions far more effectively
Expert drivers perform automated routines with minimal conscious effort
Stages of Learning → Expertise
Stage 1: Cognitive Stage
Understanding instructions
Avoiding major mistakes
High cognitive load
Stage 2: Associative (Middle) Stage
Gross errors drop
More efficient routines appear
Performance becomes smoother
Stage 3: Autonomous Stage
Skills become automated
Low cognitive effort
Highly efficient performance
BUT:
👉 Automation leads to Arrested Development
Once tasks feel easy and automatic, improvement stops.
Arrested Development
Expertise stops improving when:
tasks become too easy
errors no longer occur
performers stop receiving challenge signals
motivation declines
no deliberate practice is applied
To continue improving:
👉 Tasks must increase in difficulty to push performance beyond its current level.
This explains:
why most people “plateau” in skills like driving
why experts continually self-challenge
why world-class performers maintain difficult, structured training plans
The 10,000 Hour Misinterpretation
Gladwell popularised the idea that 10,000 hours = expertise.
Ericsson clarifies:
It is not a fixed number; expertise varies across domains.
The core principle is sustained, structured, progressive overload, not the hour count.
Early start + high practice → fastest trajectory
Late start + low practice → slowest trajectory
Late start + high practice → improvement but unlikely to reach early-start experts
Ericsson vs Other Theories
Ericsson argues:
Expert performance mechanisms are acquired, not innate.
Novices’ working memory limitations are irrelevant once expertise develops.
Experts rely on task-specific memory structures and long-term working memory, not general mental capacity.
Expertise is highly domain-specific, not domain-general.
Thus:
👉 Expertise ≠ high g
👉 Expertise = highly specialised, heavily practised, cognitively structured skill
two fundamentally different research traditions in intelligence:
1 Explanatory Approach (Experimental Cognitive Psychology)
Goal: identify basic cognitive processes (attention, working memory, inhibition, perception)
Uses experiments to identify mechanisms
Seeks causal explanations of behaviour
This approach asks:
👉 What processes explain intelligent behaviour?
2 Descriptive Approach (Individual Differences Psychology)
Goal: map the structure of human abilities
Uses correlations between tests to infer latent abilities
Produces taxonomies (e.g., g, broad abilities, narrow abilities)
Not primarily concerned with causal mechanisms
This approach asks:
👉 How are different mental abilities related?
👉 How should they be grouped?
👉 Where does each task “belong” in the hierarchy?
The CHC model — is a descriptive model based on large-scale factor-analytic evidence.
Gf–Gc Investment Theory
(Cattell & Horn)
1 Core distinction
(fluid intelligence) Gf = ability to solve novel problems
(crystallised intelligence) Gc = acquired knowledge and culturally-valued skills
2 Investment Theory
Gf → invested → becomes Gc
Fluid reasoning capabilities allow individuals to acquire culturally important knowledge.
This investment process explains developmental patterns:
Young adults: high Gf → rapid learning
Older adults: lower Gf → but high accumulated Gc
This sets the stage for CHC by showing two major broad abilities.
Why CHC Theory Emerged
Horn & Cattell:
Intelligence can be summarised with two broad abilities (Gf, Gc).
Further slicing becomes too narrow and loses psychological meaning.
Carroll (the “troublemaker,” as the lecturer says):
Expand the model with more broad abilities, because:
G (the general factor) becomes more meaningful when derived from a larger, more diverse set of abilities.
A general factor defined by 10–12 broad abilities is more robust than one defined by only 2.
Hence, CHC = Cattell–Horn–Carroll:
A merger of Horn–Cattell’s Gf–Gc model with Carroll’s expanded hierarchical structure.
CHC Model of Intelligence
Stratum III — General Intelligence (g)
The most abstract level
Represents what is common across ALL abilities
Stratum II — Broad Abilities
CHC recognises 8–12 broad abilities, including:
Gf – fluid reasoning
Gc – crystallised knowledge
Gv – visual processing
Gsm – short-term memory
Gs – processing speed
Glr – long-term storage/retrieval
Ga – auditory processing
Gt – (sometimes) decision/reaction time
(Not all models list the same number; CHC is flexible.)
Stratum I — Narrow Abilities
Each broad ability contains dozens of specific skills (e.g., “visualisation,” “mental rotation,” “phonetic coding,” “verbal closure”).
CHC essentially slices the “pie” of intelligence into:
many broad dimensions,
composed of even more specific narrow abilities,
all contributing to an overarching g.
CHC Broad Ability: Fluid Intelligence (Gf)
Narrow (first-order) Gf abilities include:
Induction
Sequential reasoning
Quantitative reasoning
Temporal reasoning
Figural (abstract) reasoning
These are measured with tasks like:
Matrices
Series completion
Abstract analogies
All measure the shared reasoning component = Gf.
CHC Broad Ability: Crystallised Intelligence (Gc)
CHC emphasises:
Gc cannot be culture-free
Every culture values different knowledge
Gc is theoretically much broader than any cognitive test battery can capture
Narrow (first-order) Gc abilities include:
Verbal comprehension
Semantic relationships
General information
Reading comprehension
Spelling
Verbal closure
Foreign language aptitude
Gc remains highly stable and increases into older adulthood.
Developmental Differences in Gf vs Gc
A major piece of validation for the Gf–Gc distinction:
Gf increases to adulthood → then declines with age
Gc increases across the lifespan → plateaus later → does not drop as sharply
This divergent developmental pattern shows that the two are psychologically separable.
Visual Processing (Gv)
Carroll adds Gv as a new broad ability, arguing it is distinct from Gf.
Gv abilities include:
Visualisation
Mental manipulation
Mental rotation
Example: Visualisation Task
Given front + side + top views → identify the correct 3D block.
Previously considered a Gf task, but CHC separates it as Gv because:
It involves spatial transformations
It can be influenced by cultural experience (e.g., LEGO exposure caused historical gender differences)
This illustrates why tasks cannot be assumed to be “culture free.”
Processing Speed (Gs)
Processing speed refers to:
👉 ability to perform simple, overlearned cognitive operations quickly and efficiently.
Key Gs Narrow Ability: Mental Speed
Measured with:
simple reaction tasks (light → button)
choice reaction-time tasks (multiple buttons)
Why does this relate to intelligence?
More choices → more cognitive load
Jensen (1982) showed higher correlations with g as choice complexity increases
Correlations are negative (faster RT = better ability)
Even simple tasks require:
sustained attention
inhibition
decision-making
response selection
Thus they reflect elementary aspects of cognition.
Inspection Time (IT): A High-g-Loading Speed Task
Inspection Time involves:
50–200 ms stimulus (two lines of different lengths)
Immediately backward-masked
Participant indicates which line was longer
Key points:
Does not require motor speed (response occurs after the mask)
Measures speed of information intake rather than reaction speed
Correlation with IQ ≈ –.30
After corrections (attenuation + range restriction): ≈ –.51
(One of the strongest relationships in elementary cognitive tasks.)
Auditory versions show similar patterns.
What Factor Analysis Actually Extracts
Using the Gv example:
Administer multiple Gv tasks: visualisation, mental rotation, spatial matching, paper fold
Factor analysis extracts shared variance → defines the broad ability (Gv)
Replace tasks → you change what “Gv” is
Correlation of Gv with Gf reflects overlap in processes
Two interpretations:
Tests share cognitive processes → overlap
Tests are impure (e.g., Ravens requires both Gf + Gv) → entanglement
This is why CHC is a descriptive rather than a causal model.
Summary of CHC’s Contribution
CHC provides:
A comprehensive hierarchical map of human cognitive abilities
A framework for designing broad, modern test batteries (e.g., WJ-IV, WAIS adaptations)
Clear separation between:
general ability (g)
broad abilities (Gf, Gc, Gv, Gs, etc.)
narrow abilities within each broad factor
It is the dominant psychometric model of intelligence in contemporary assessment.