Looks like no one added any tags here yet for you.
Database
A repository of data (what researchers access to retrieve data).
Dataset
A set of variables and cases that researchers use for analysis.
Often derived from a larger database.
Could be the same as a "database" if an entire database is included in the dataset.
Can also have a dataset that you create/develop with no database (like most examples we use in class).
Database ex
Income information for all people in NC who received Medicaid services from 19995-2017 (housed on a government server in Raleigh).
Dataset ex
income information for 100 people in Pitt County who received Medicaid services in 2017 (in an Excel spreadsheet on a researchers computer at ECU).
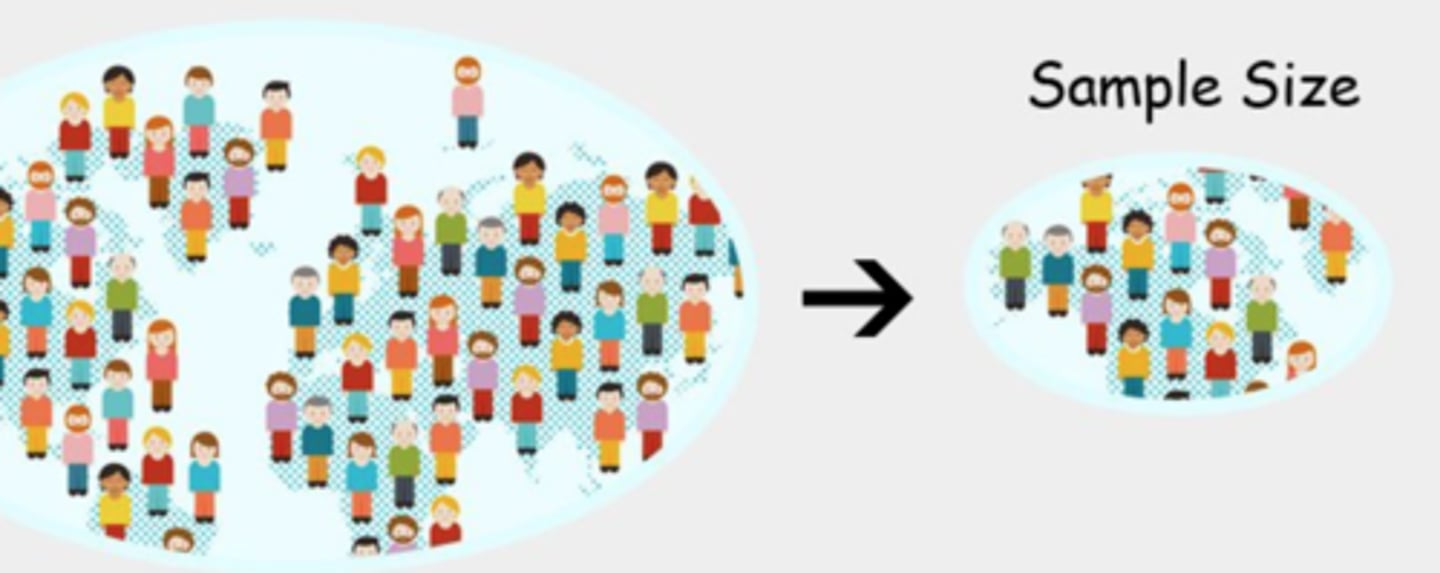
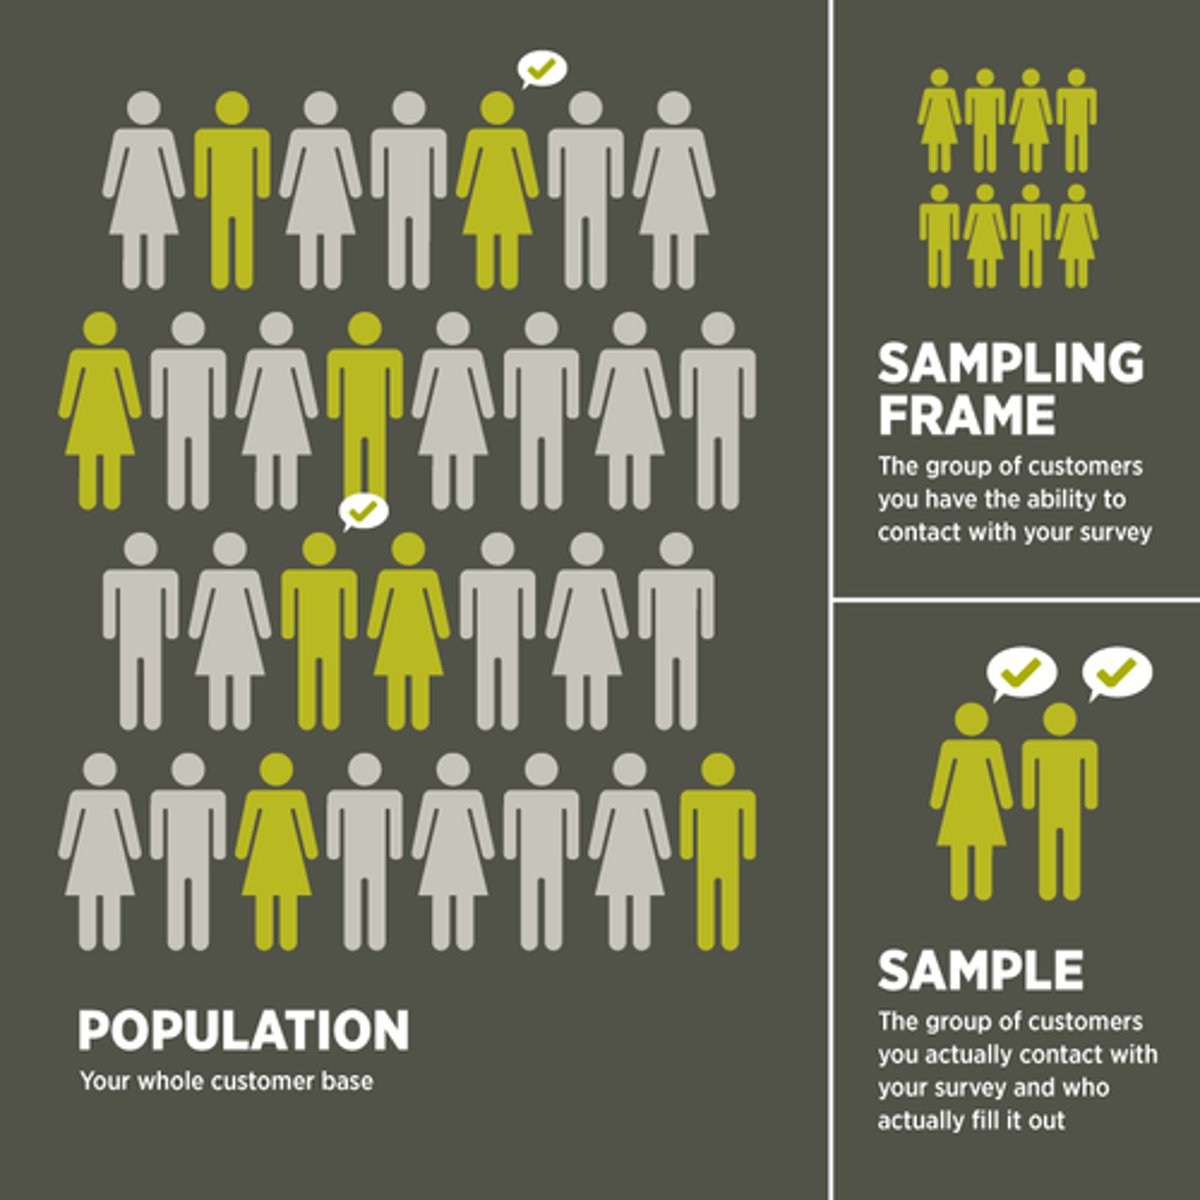
Sample Size (Sample)
A subset of a population that is used to study the population as a whole.
Sampling Frame
A list of all elements or other units containing the elements in a population.
A listing of the accessible population from which you'll draw your sample.
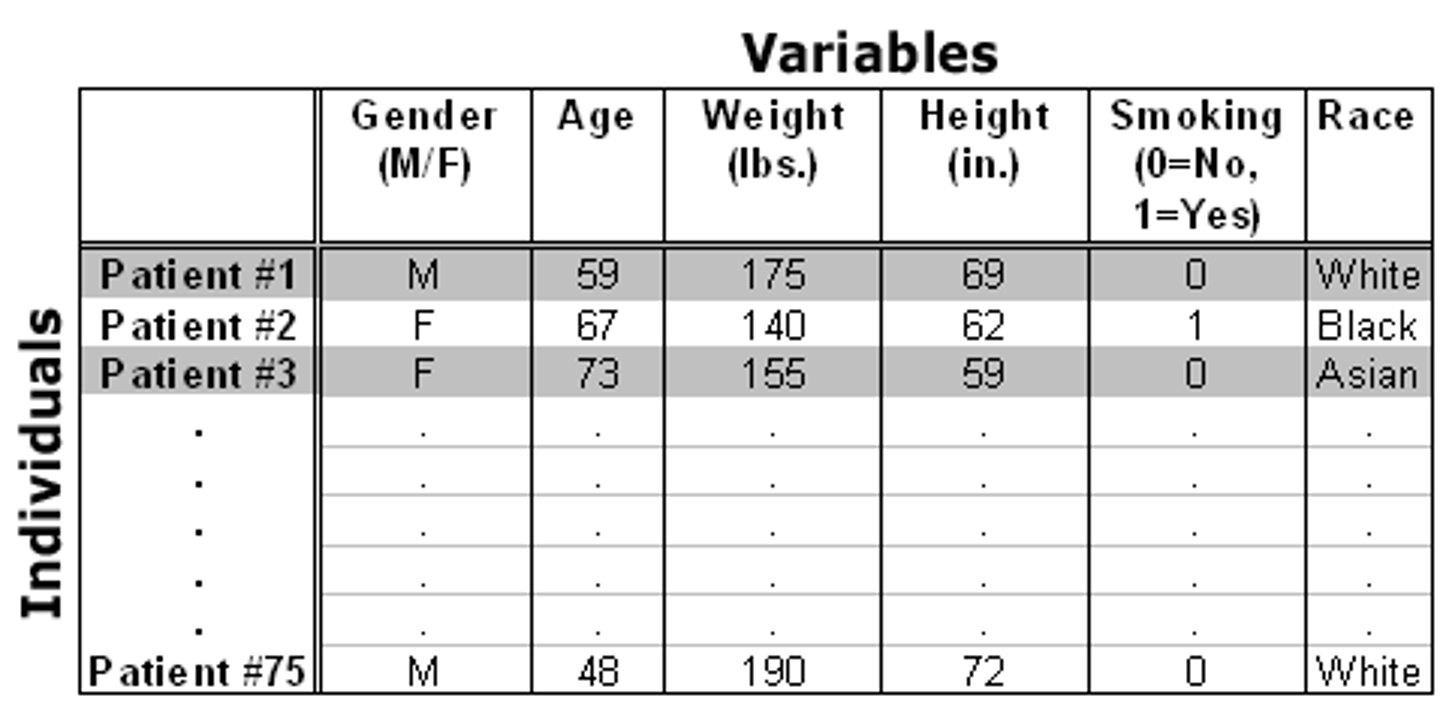
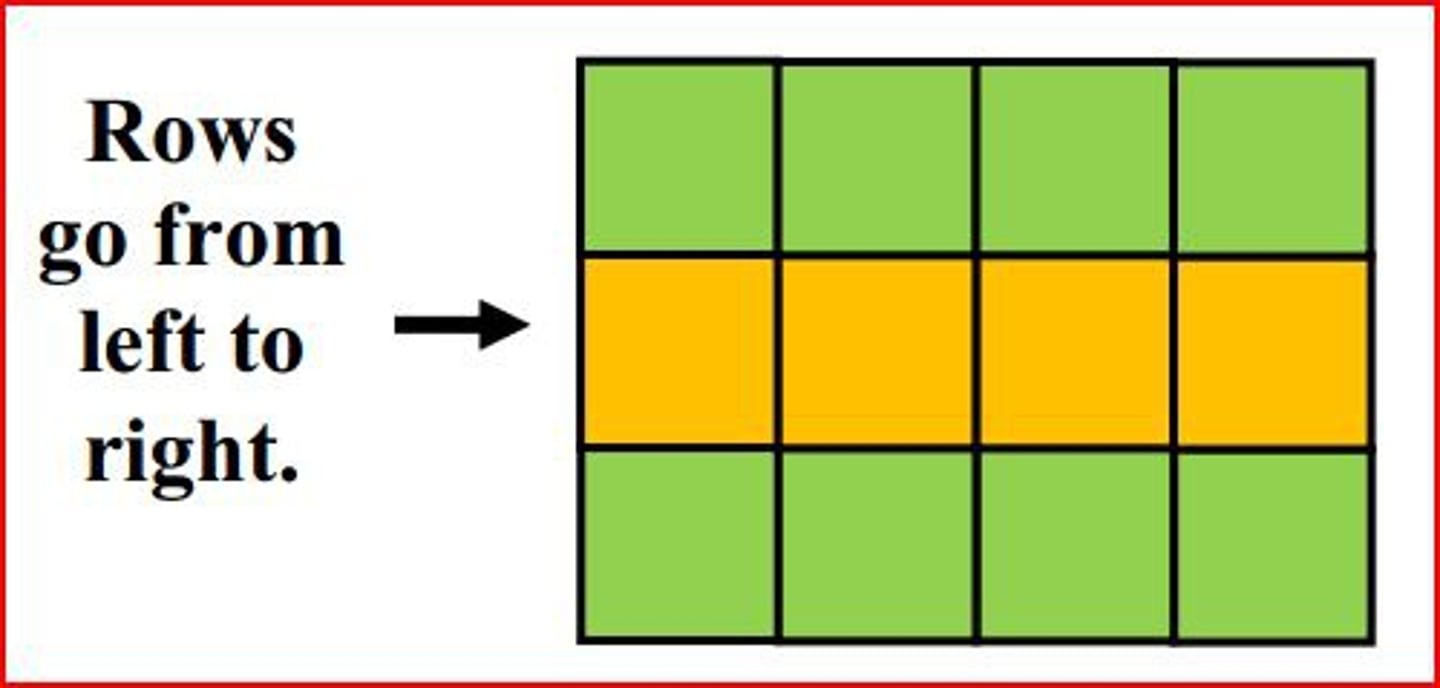
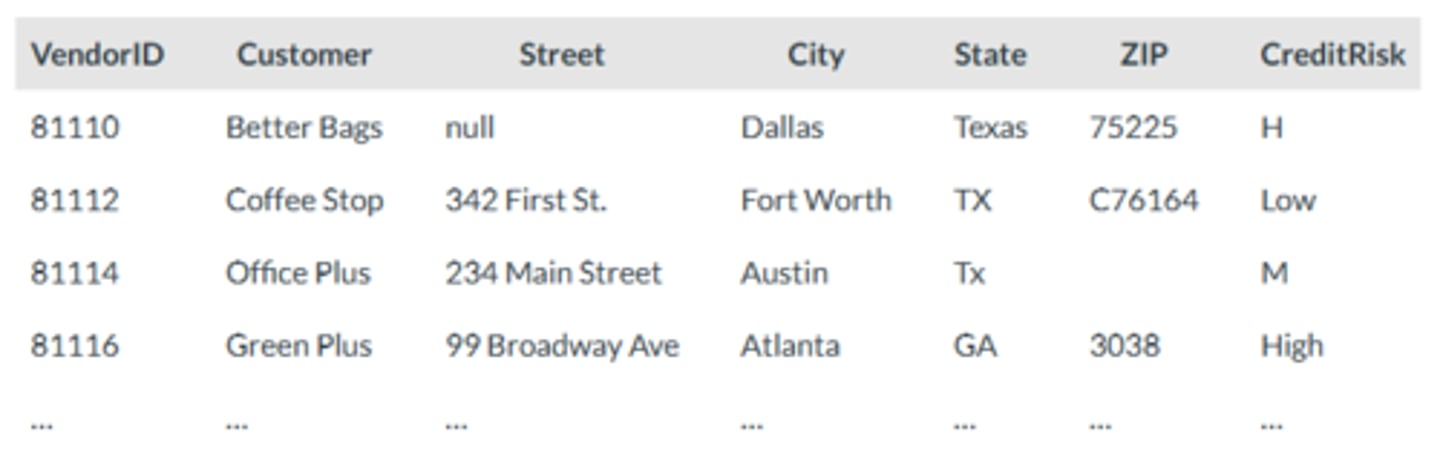
Rows
Cases or observations (indicate the Units of Analysis)
Columns
Variables (quantitative or qualitative)
Units of Analysis
What is being studied.
Is often people (children, adults, etc.)
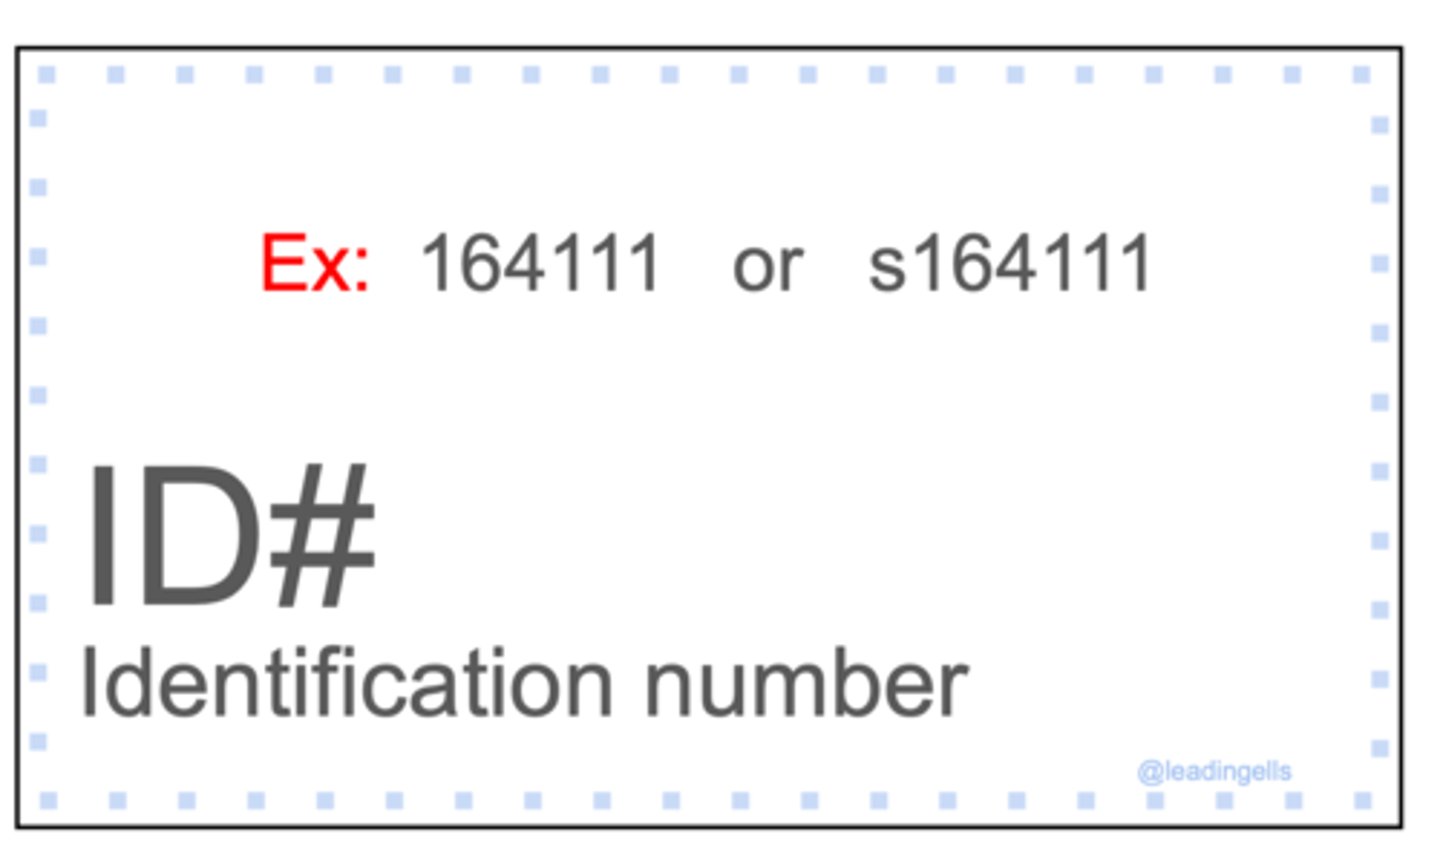
Identification (ID) Variable
Typically, the first column in a dataset.
A unique value for each unit of analysis (can not have the same value for different cases).
Examples: case numbers, name (if all unique), Medicaid ID, etc.
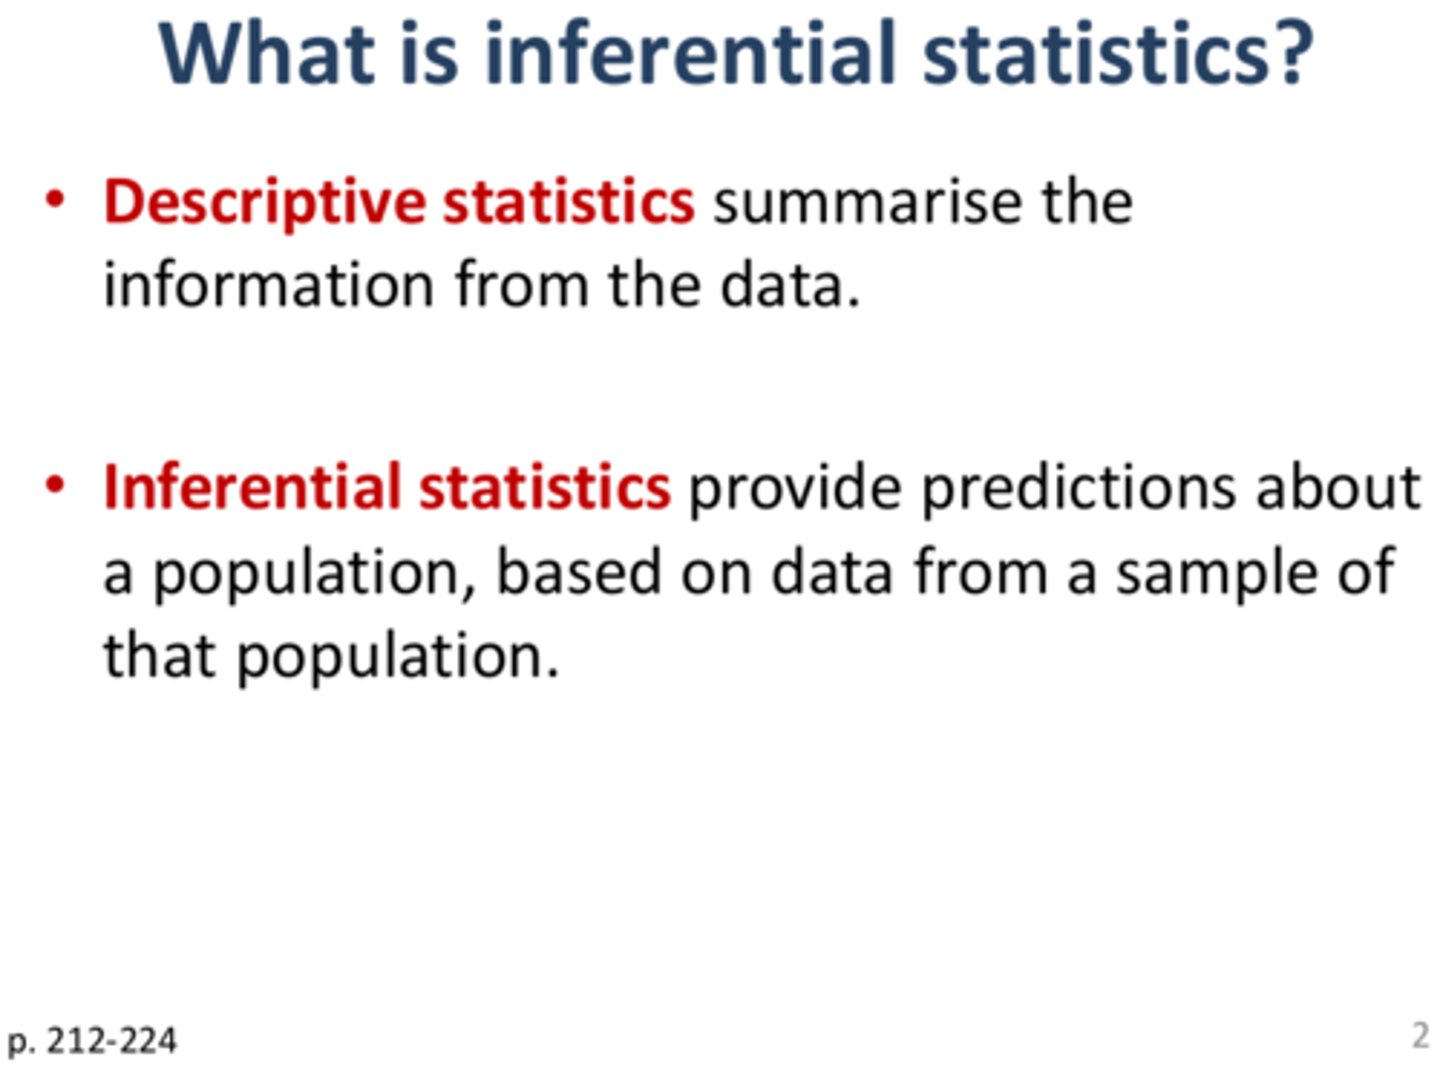
Descriptive Statistics
Statistics used to describe the distribution of and relationship among variables.
The analysis of data that helps describe, show, or summarize data.
Two main ways: central tendency and standard deviation
Central Tendency
The most common value (for variables measured at the nominal level) or the value around which cases tend to center (for a qualitative variable).
The typical or central value for a variable (mean, median, and mode - the most common measure)
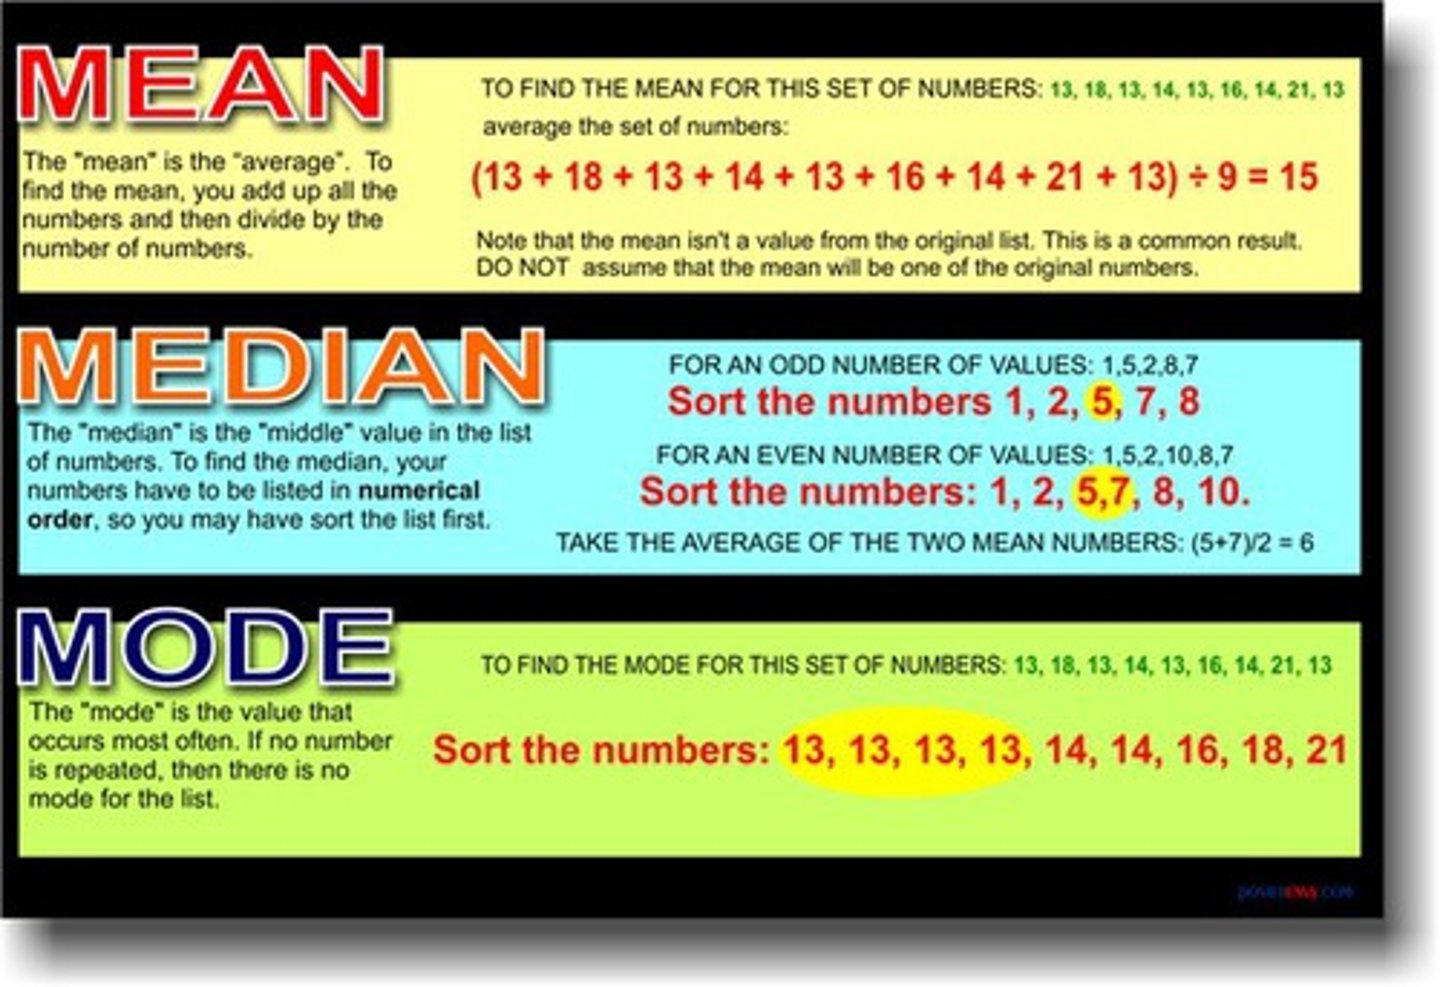
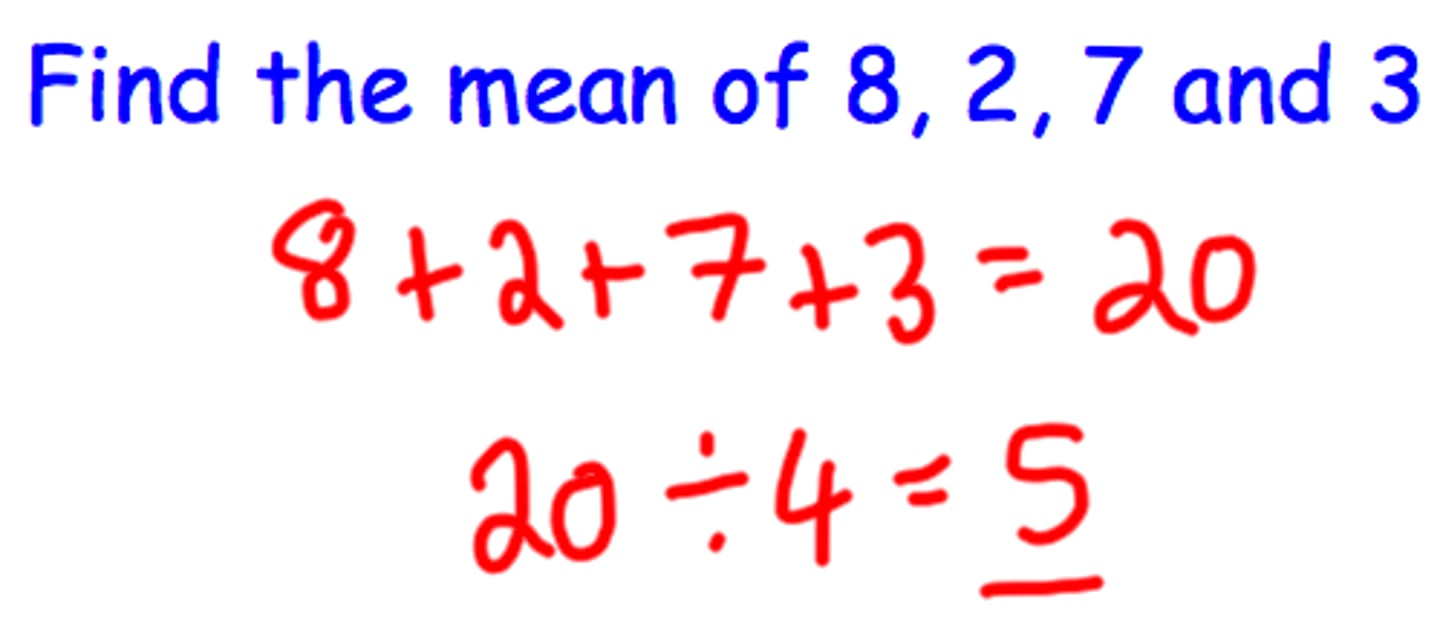
Mean
The arithmetic or weighted average of a set of numbers is computed by adding up the values of all the cases and dividing by the number of cases.
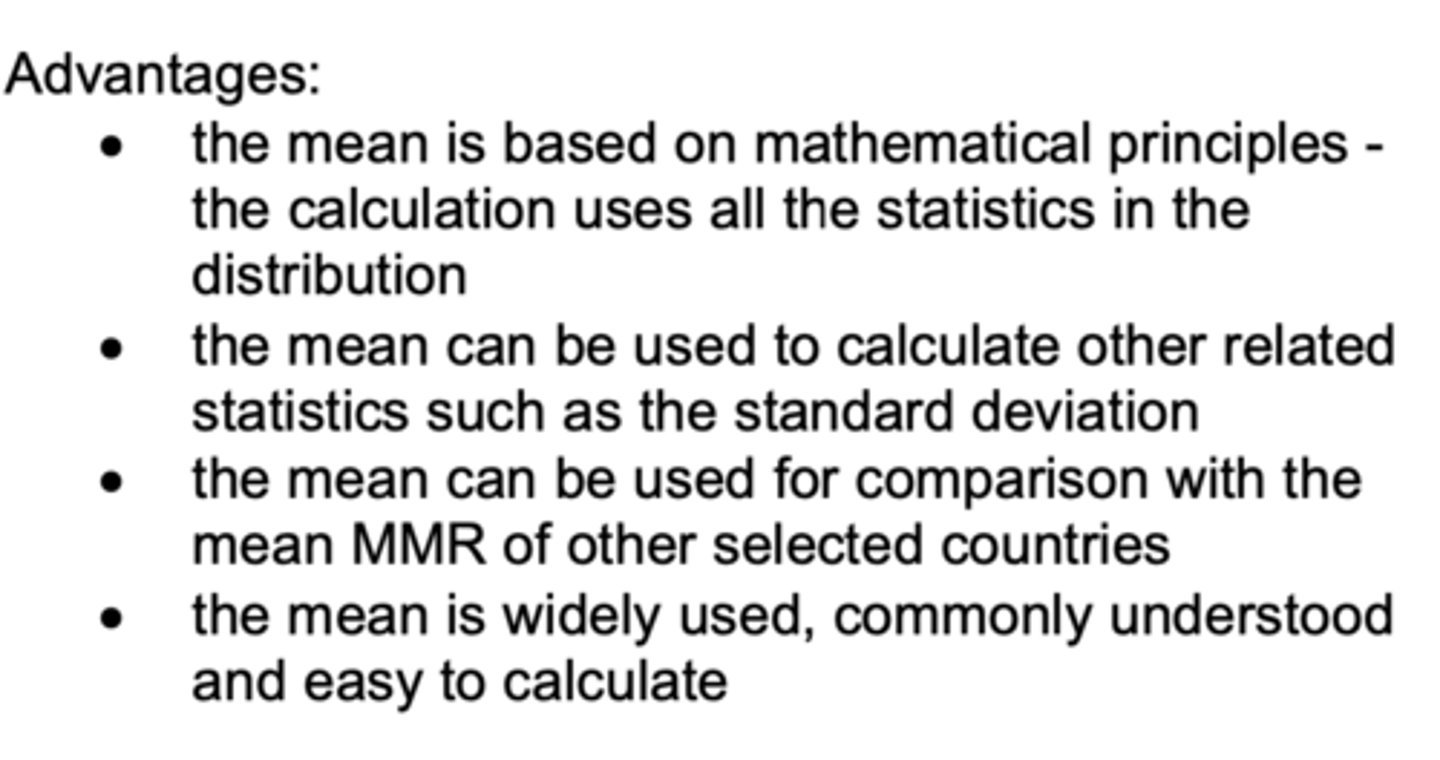
Advantages to using the Mean
Everyone understands and is commonly used (most reliable)
A good indication of the central tendency of a distribution
Takes into account all scores
Good for interval & ration data
Disadvantages to using the Mean
Can be skewed by extreme scores (best when there are no extremes).
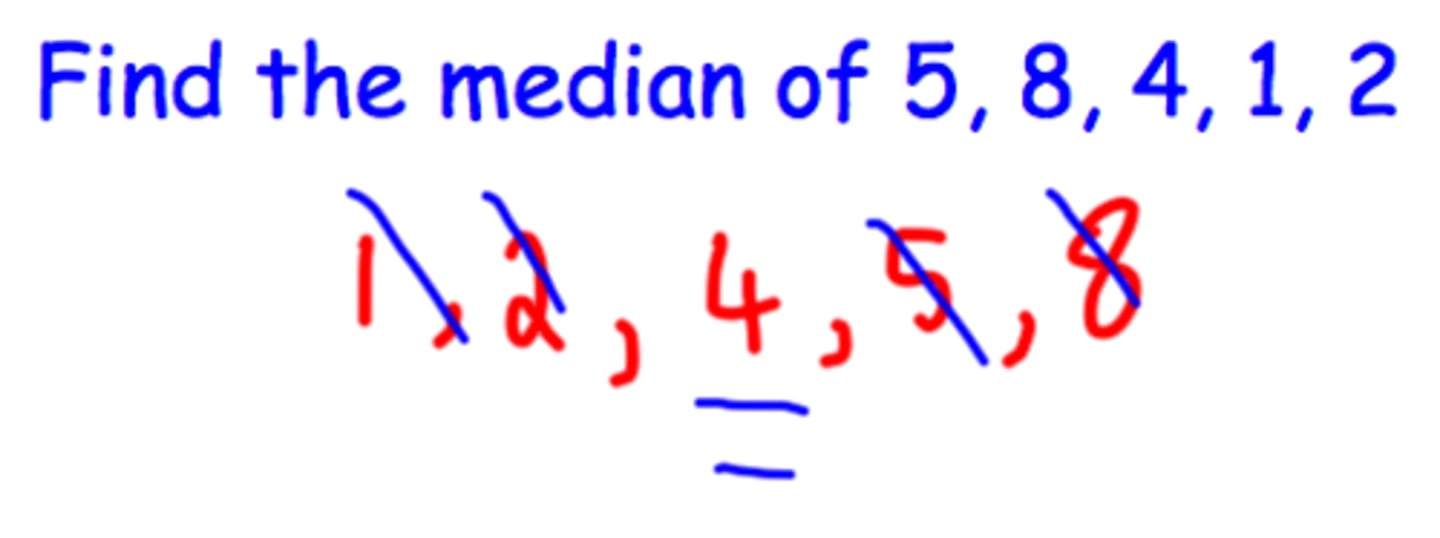
Median
The point that divides a distribution in half; the middle value in a sequence.
Organize the set of numbers from lowest to highest -> locate the middle number.
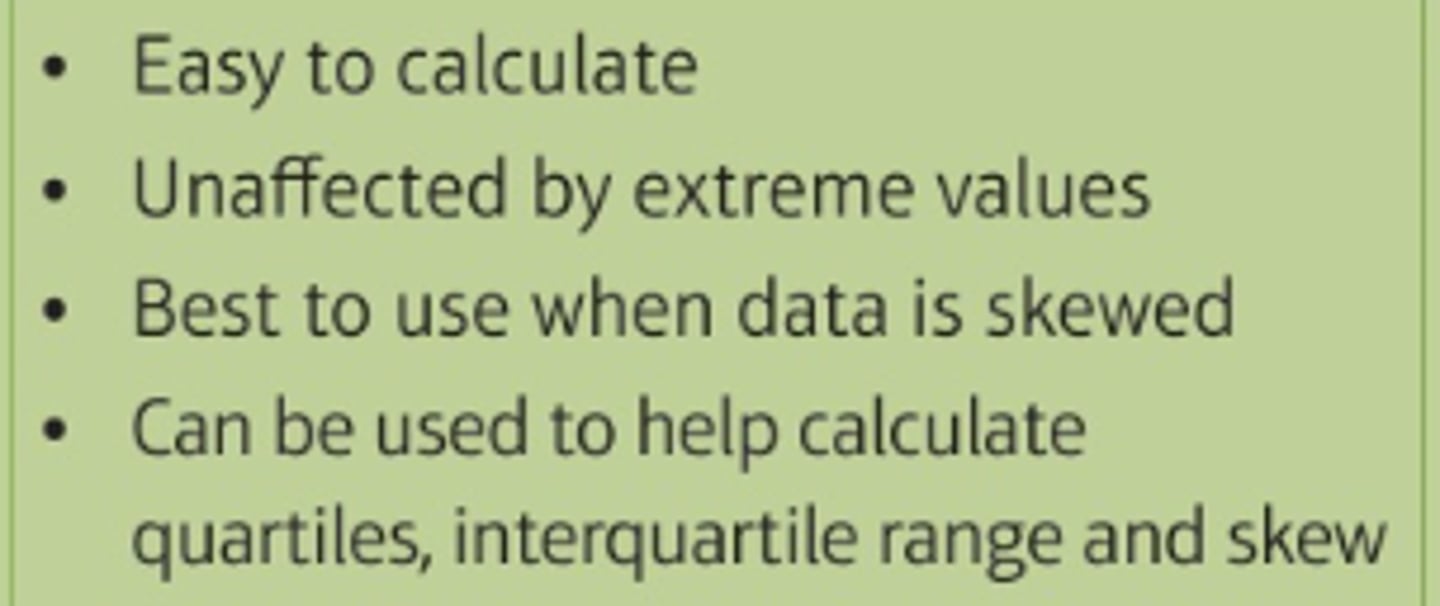
Advantages to using the Median
Easy to calculate
Is not skewed by extreme scores
Useful when needing a "middle value" (e.g., housing values)
Works for interval and ratio data
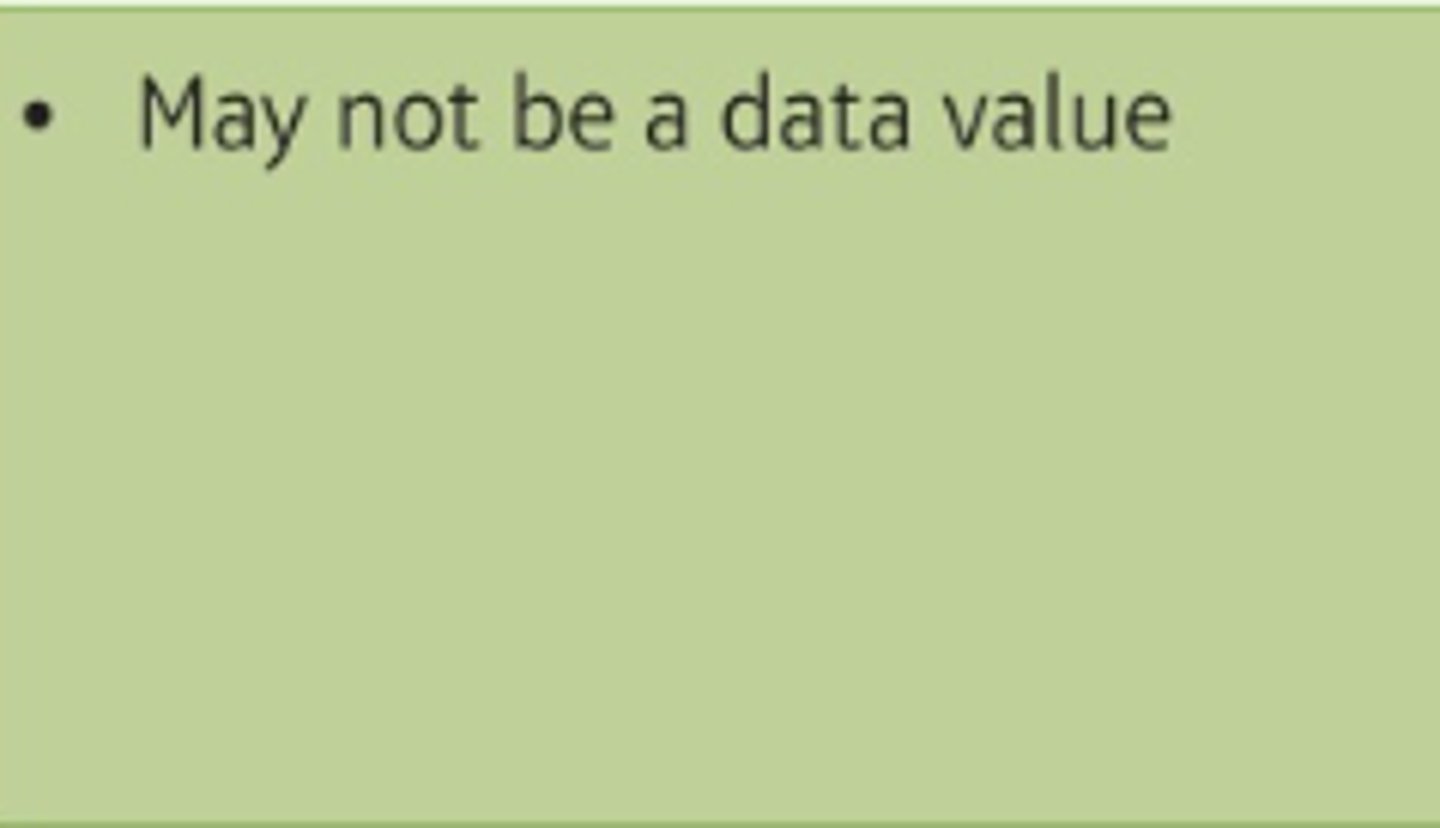
Disadvantages to using the Median
No information provided by more extreme scores
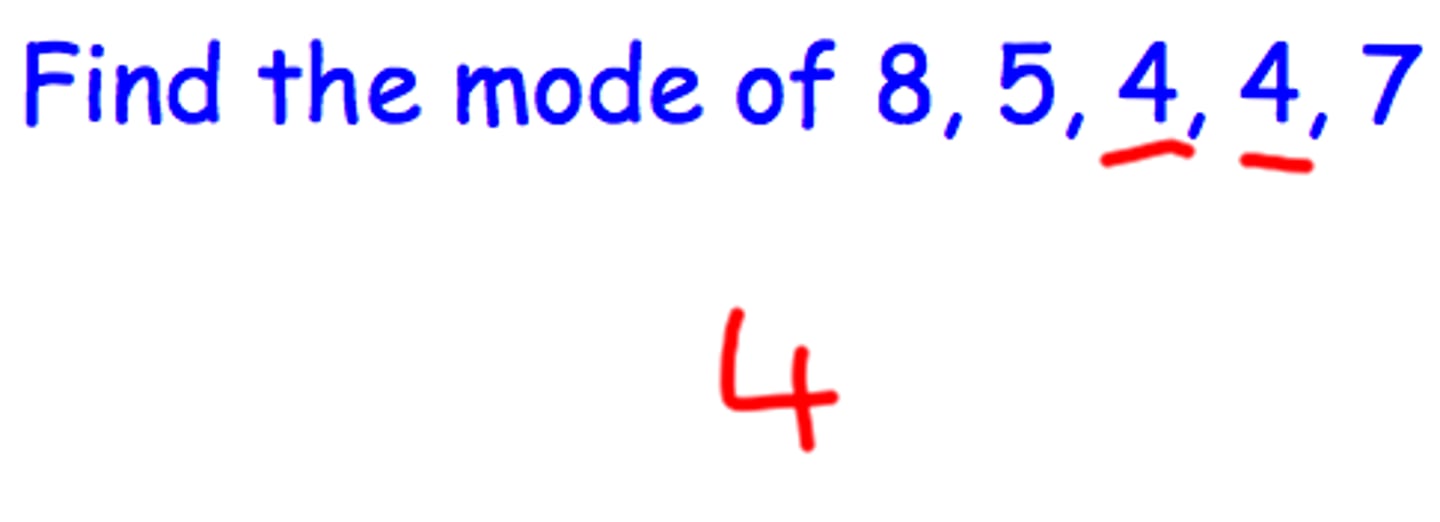
Mode
The most frequently occurring value in the distribution.
Organize the set of numbers from smallest to largest
Locate the number that appears in the list most often.
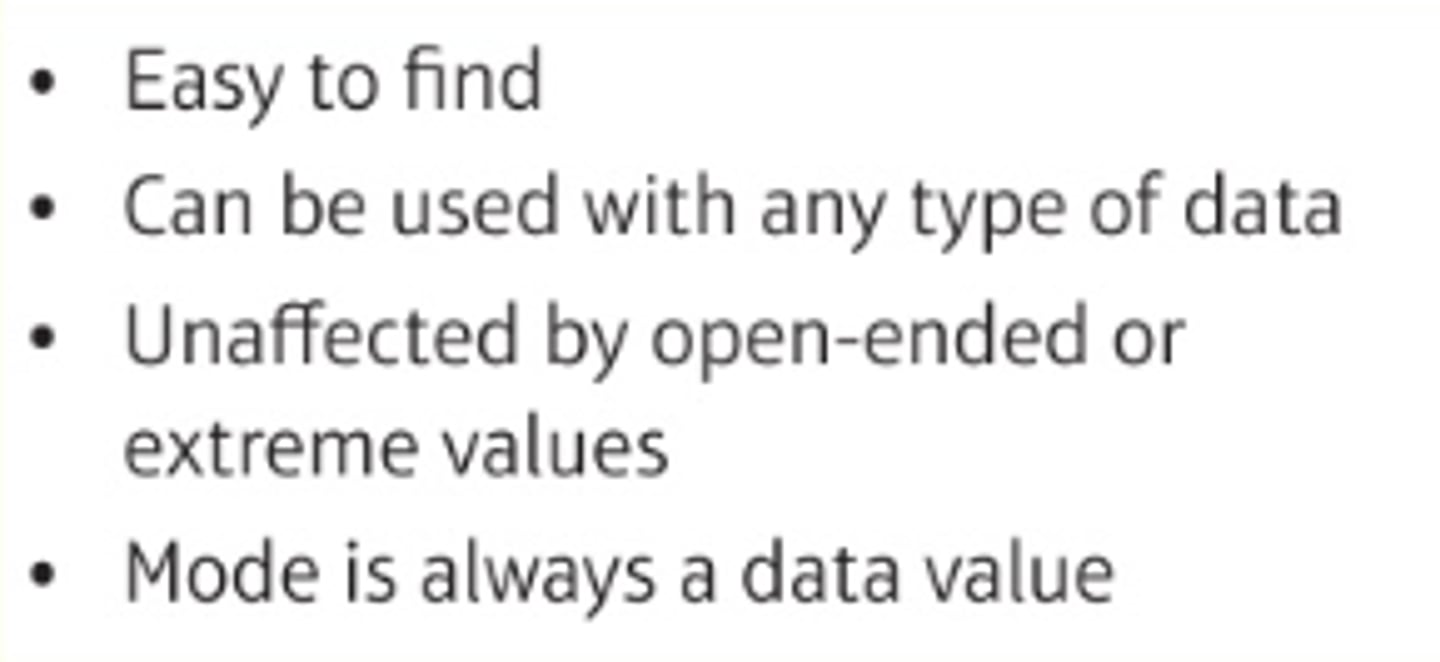
Advantages to using the Mode
East to calculate
Is not skewed by extreme scores
Useful to determine what occurred the "most" (e.g., the # of children in the home)/
Can use with counts of nominal data (e.g., most common major at ECU)
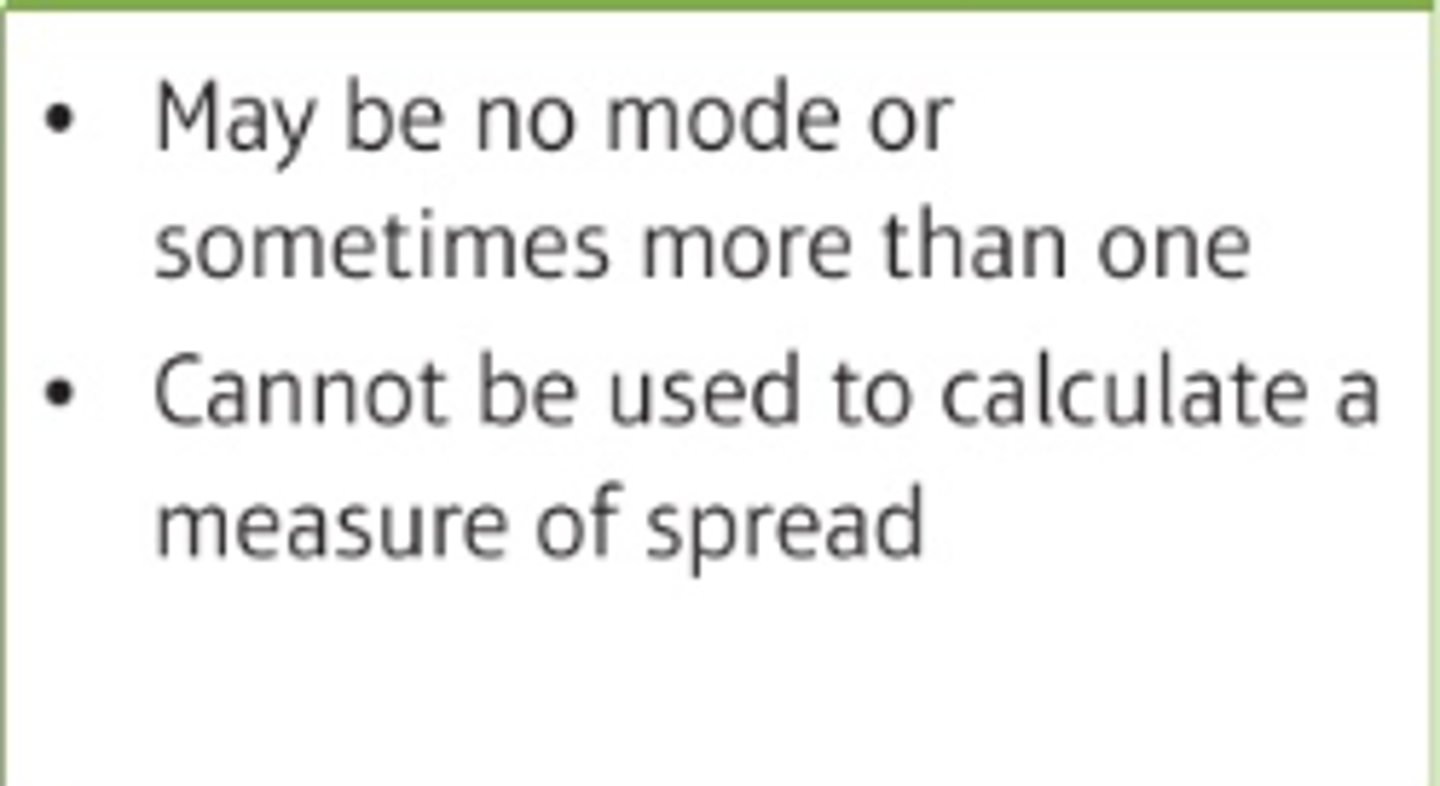
Disadvantages to using the Mode
Information is obtained about only one response value.
Cannot be used of all the scores are different & might be several modes.
The most frequent score may not actually be "in the middle" of the distribution.
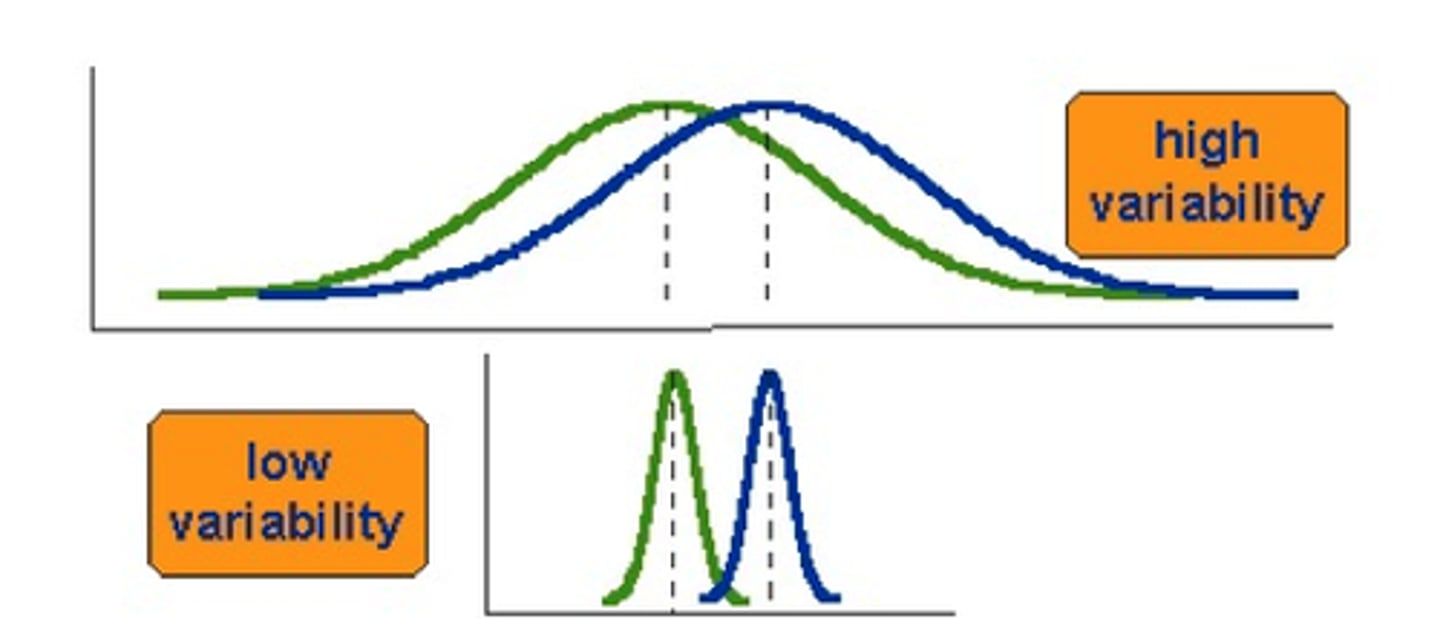
Variability (or Spread)
The extent to which cases are spread out through the distribution or clustered in just one location.
The dispersion of scores for a variable (range and SD)
The greater the difference between scores, the more spread out the distribution is.
The more tightly the scores group together, the less variability there is in the distribution.
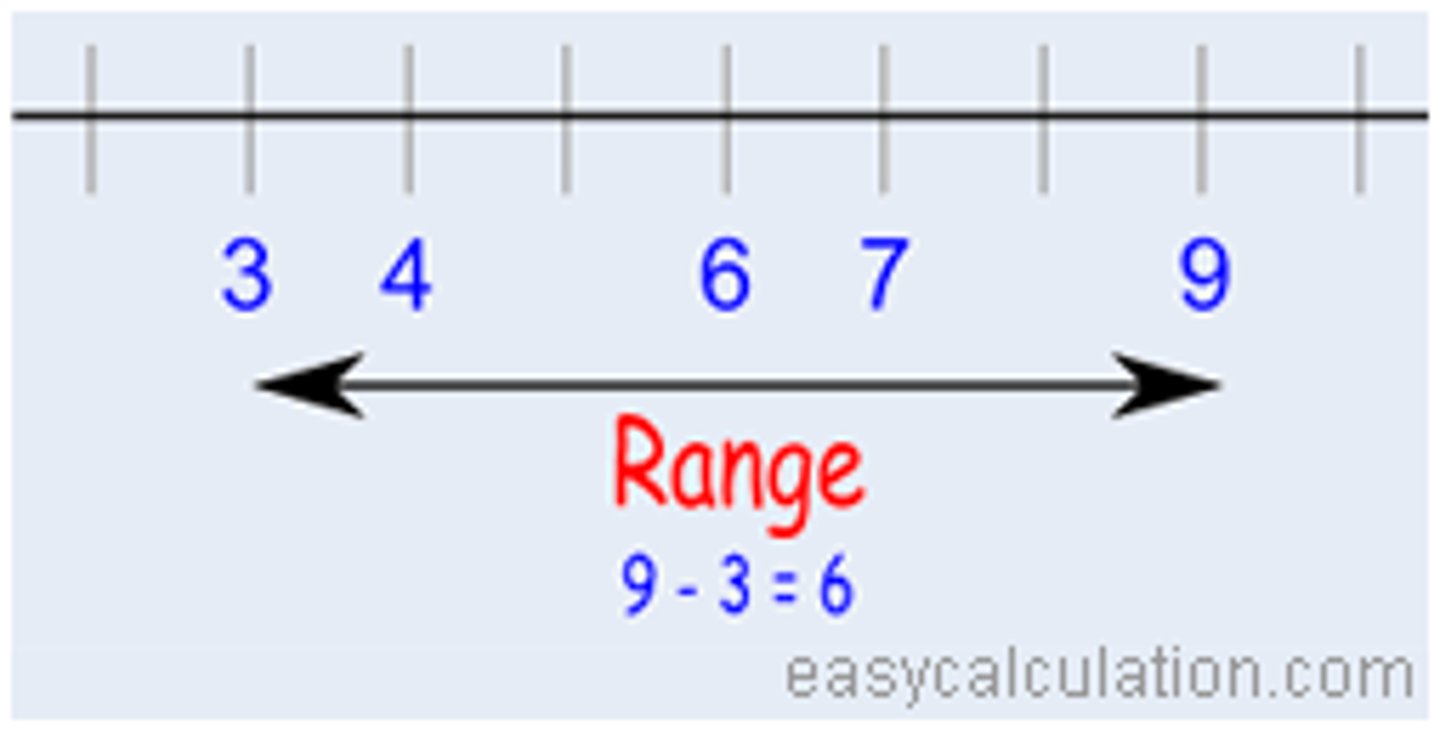
Range
The true upper limit in a distribution minus the true lower limit (or the highest rounded value minus the lowest rounded value).
The difference between the highest & and lowest scores -> tells us something about the variation of the scores.
(The simplest way)
Can be drastically altered by just on exceptionally high or low value.
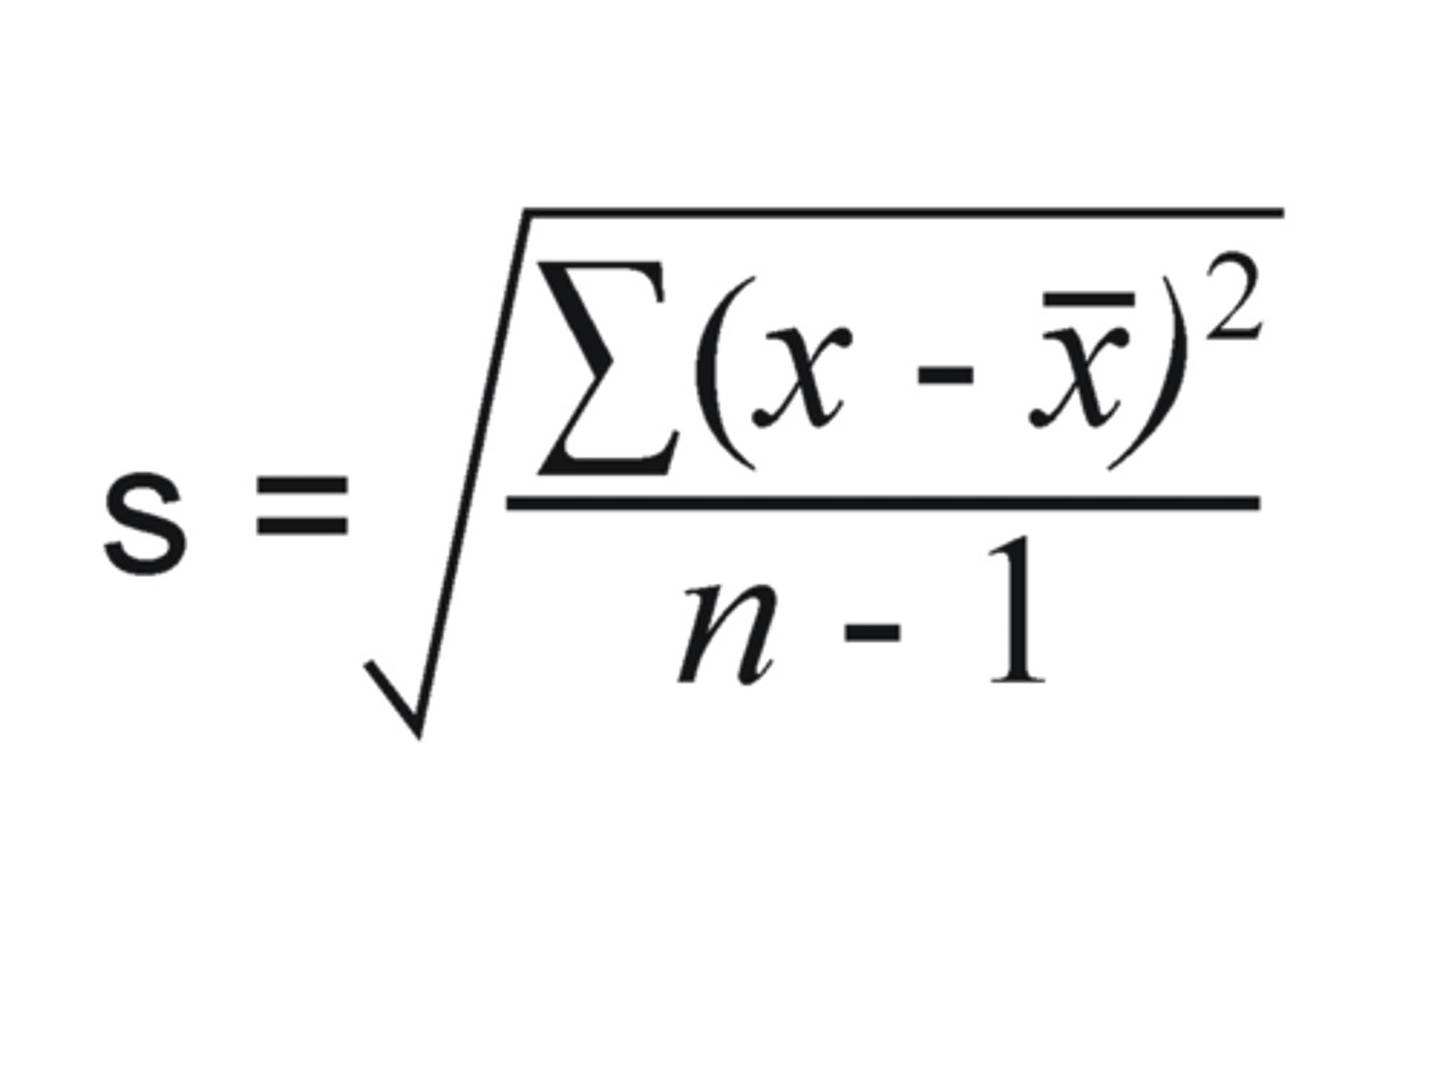
Standard Deviation
The square root of the average squared deviation of each case from the mean.
A statistic that indicate how far scores in a sample (or population) are spread out from the mean.
Provides a measure of the overall variation In a dataset.
Standard Deviation Example
Small SD indicates a small amount of variability for a given data set; there will be a lot of values closer to the mean (less spread out).
Univariate Analysis: Qualitative Variable (nominal; ordinal)
Mode
Univariate Analysis: Quantitative Variable (interval; ratio)
Mean
Median
Mode
Range
Standard Deviation
What are Univariate Tables
Often used with qualitative (nominal/ordinal) values.
If quantitative (interval/ratio_ variables, need to group them into categories first.
Shows frequencies, percentages, or proportions of values for one variable.
Very commonly used in research.
Bar Charts
Used with qualitative (nominal/ordinal) data
Shows the frequencies, percentage, or proportions of values for one variable
The variable distribution is displayed with solid bars separated by spaces.
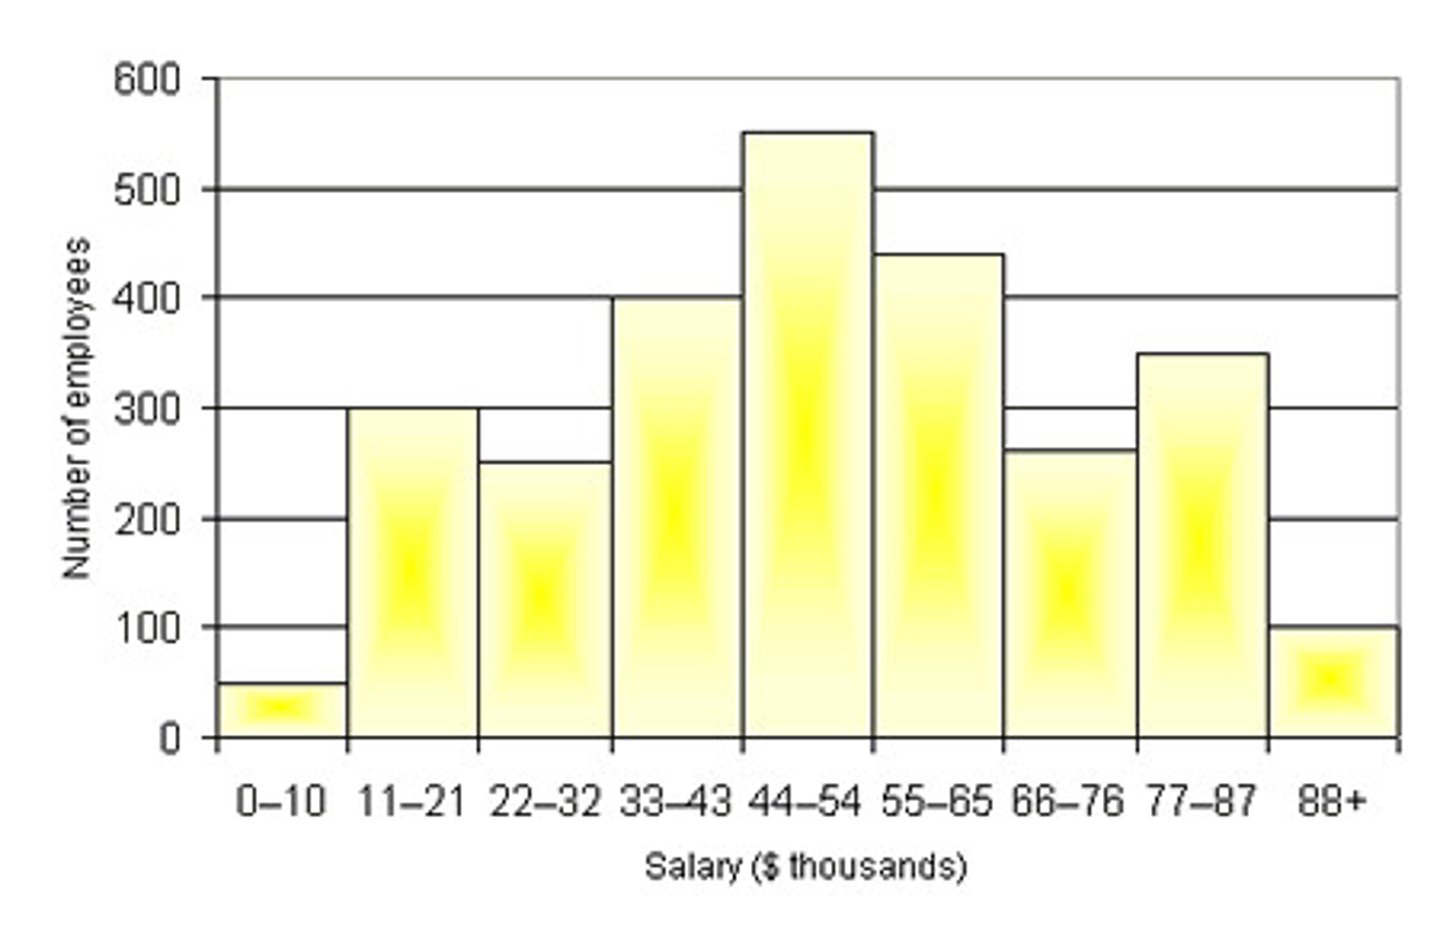
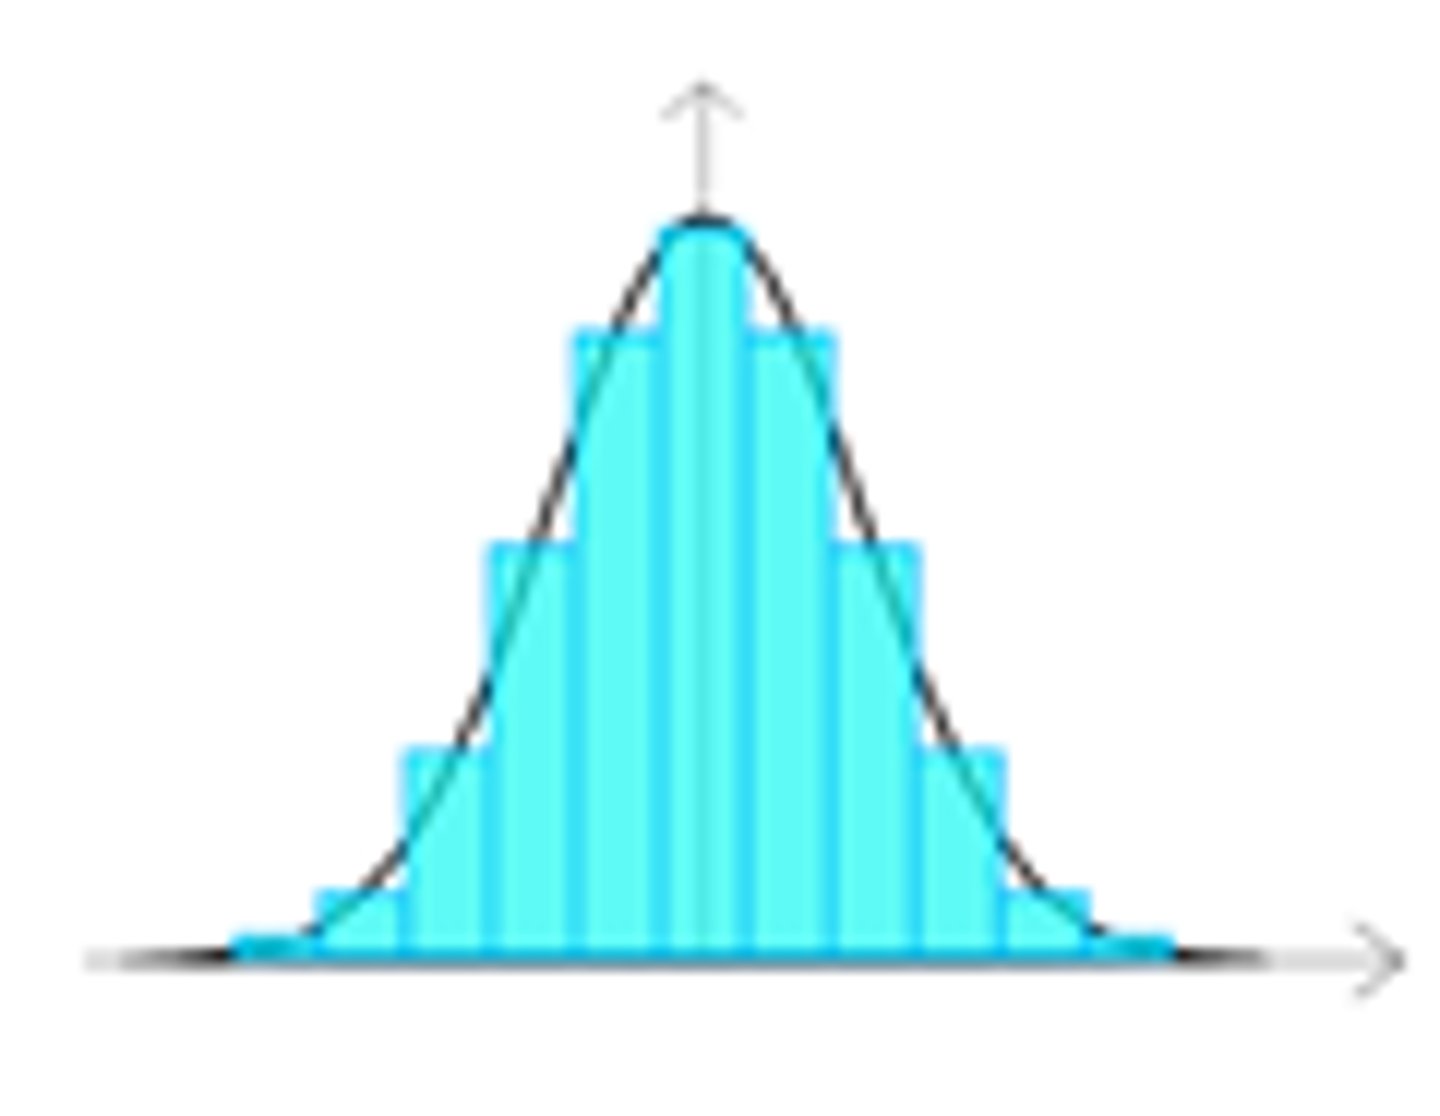
Histograms
Used with quantitative (interval/ratio) data.
Shows frequencies, percentages, or proportions of values for one variable.
Good at showing how data is achieved.
The variable distribution is displayed with adjacent bars NOT separated to indicate that the variable is continuous.
Bar Chart Qualities
Mutually exclusive categories
Exhaustive categories
Count, percent, or proportion on y-axis
Qualitative variables (nominal/ordinal)
Space between bars
Histogram Qualities
Mutually exclusive categories
Exhaustive categories
Count, percent, or proportion on y-axis
Quantitative variables (interval/ratio)
No space between bars
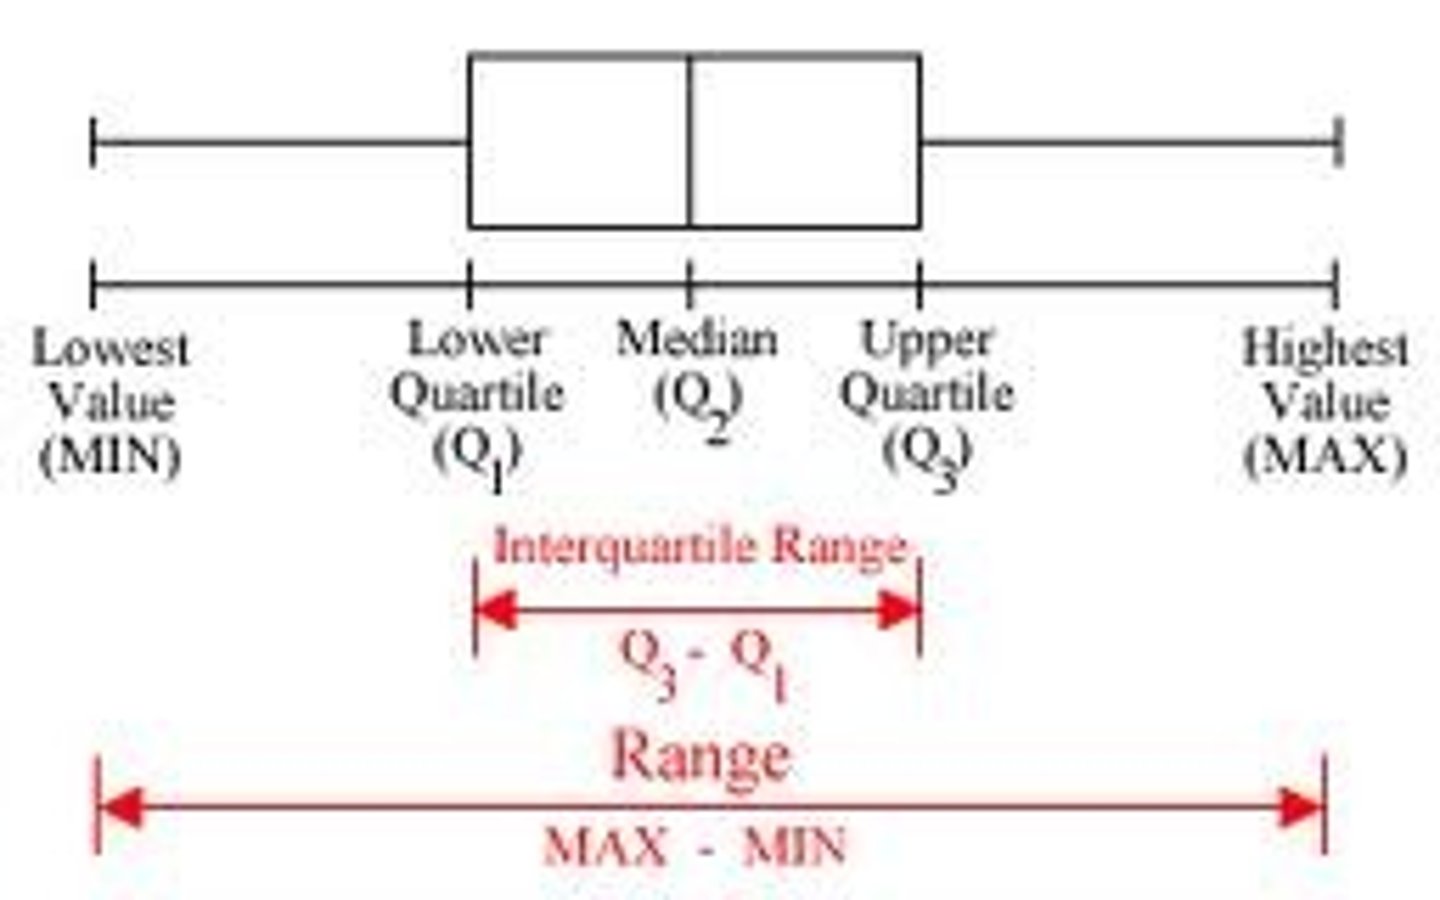
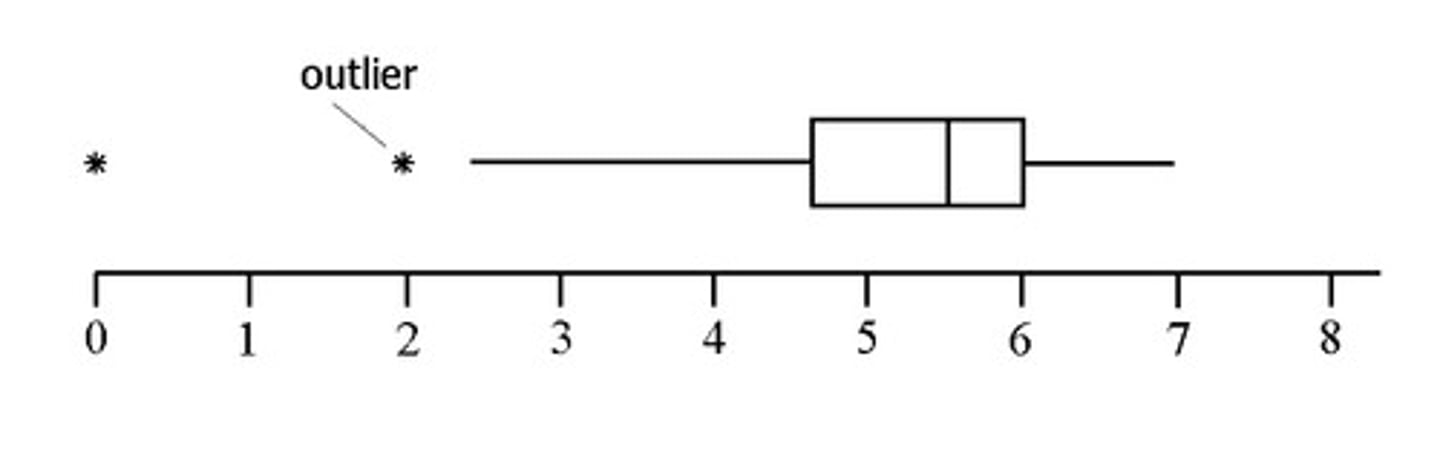
Boxplots
For quantitative (interval/ratio) data
Shows/summarizes the distribution of a variable (i.e., the relative number, percent, or proportion of times that each possible score or value occurred).
Useful for comparing distributions between groups.
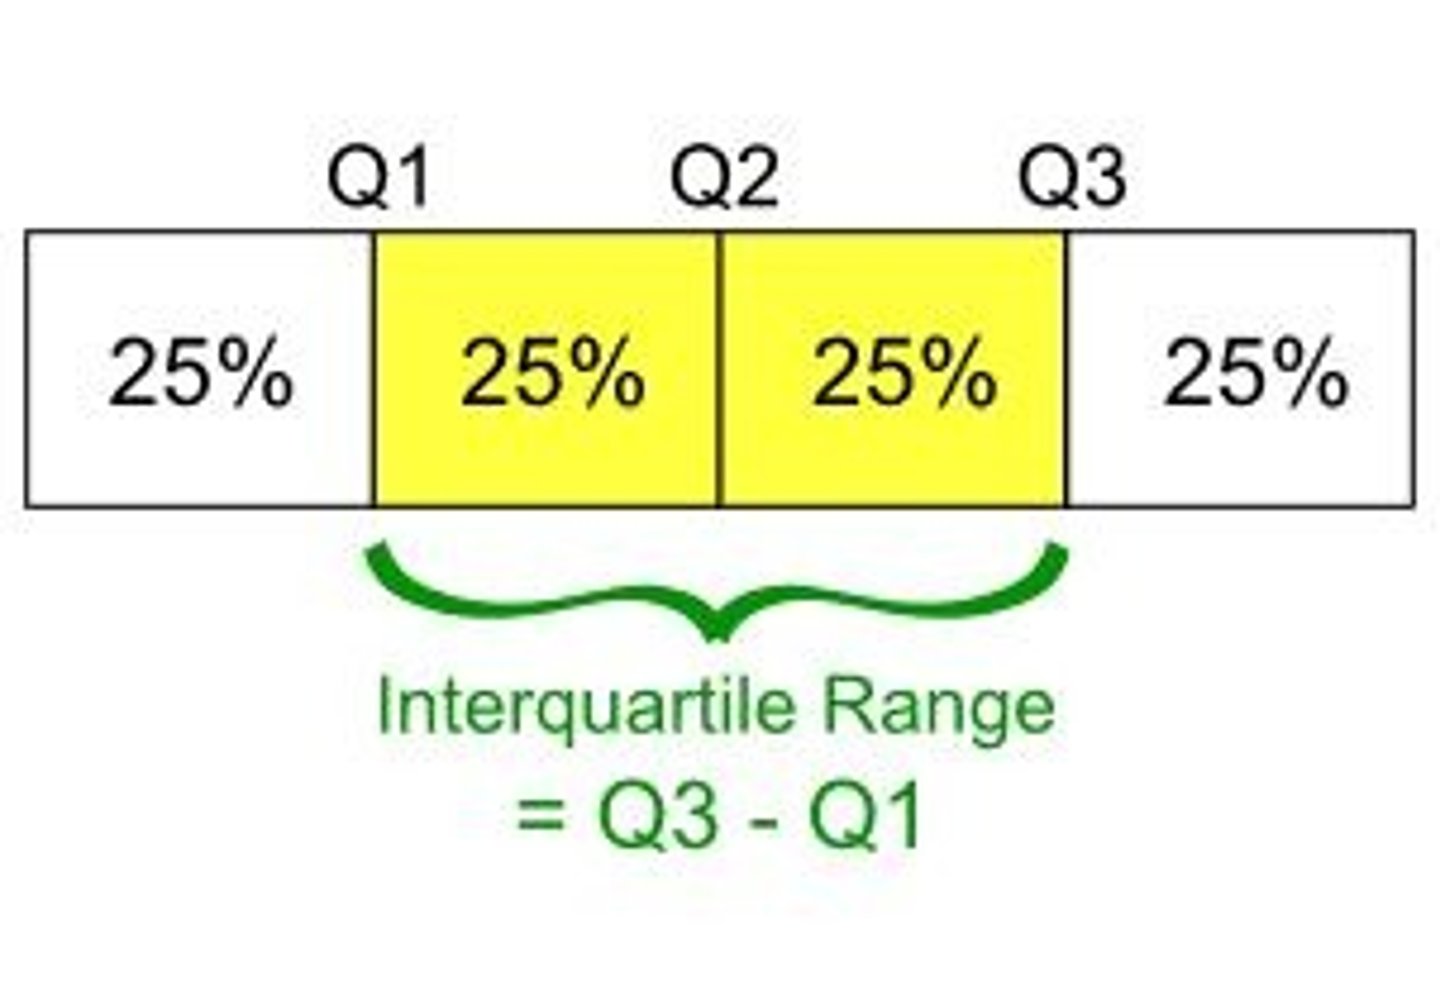
Interquartile Range
The difference between the upper and lower quartiles.
Outliers
A data point located outside the whiskers of a boxplot.
A single data point that goes far outside the average value of a group of statistics. May be exceptions.
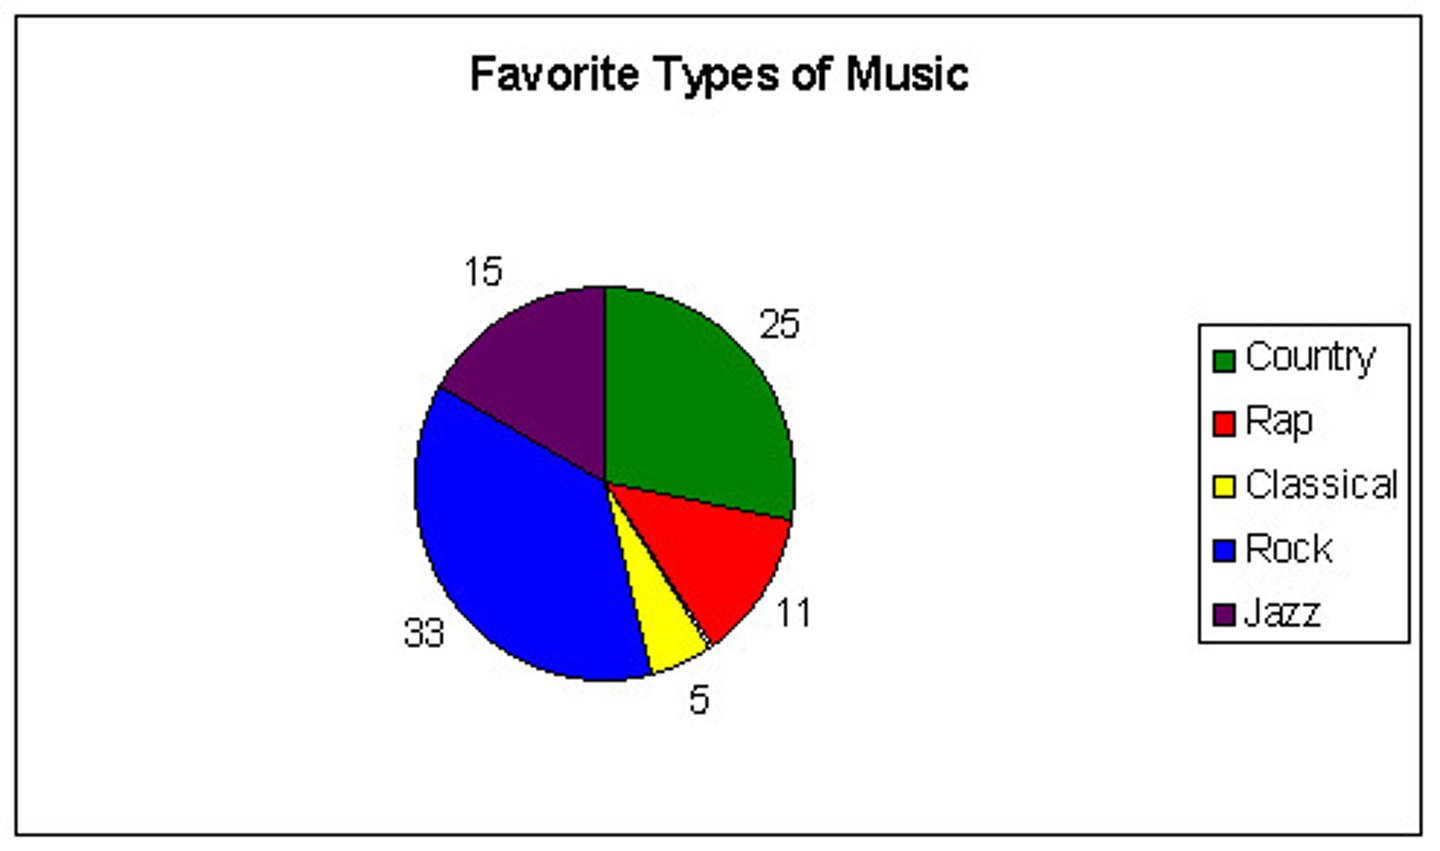
Pie Charts
Best when you'd like to emphasize one especially big value or one especially small value.
Why are pie charts generally not recommended for research?
Not always right for making comparisons:
- if the size of the pieces is similar and difficult to judge the relative size of the pieces.
- Problems especially if many levels of the variables and/or levels of the variable are roughly the same.
Univariate Graph: Qualitative Variables
Table
Bar Chart
Univariate Graph: Quantitative Variables
Histogram
Box Plot
Descriptive Statistics uses numbers, variables, proportions, etc., to
characterize (i.e., describe) or summarize information about a particular group.
Fairly intuitive.
Most statistics we have talked about in this course (e.g., mean & SD)
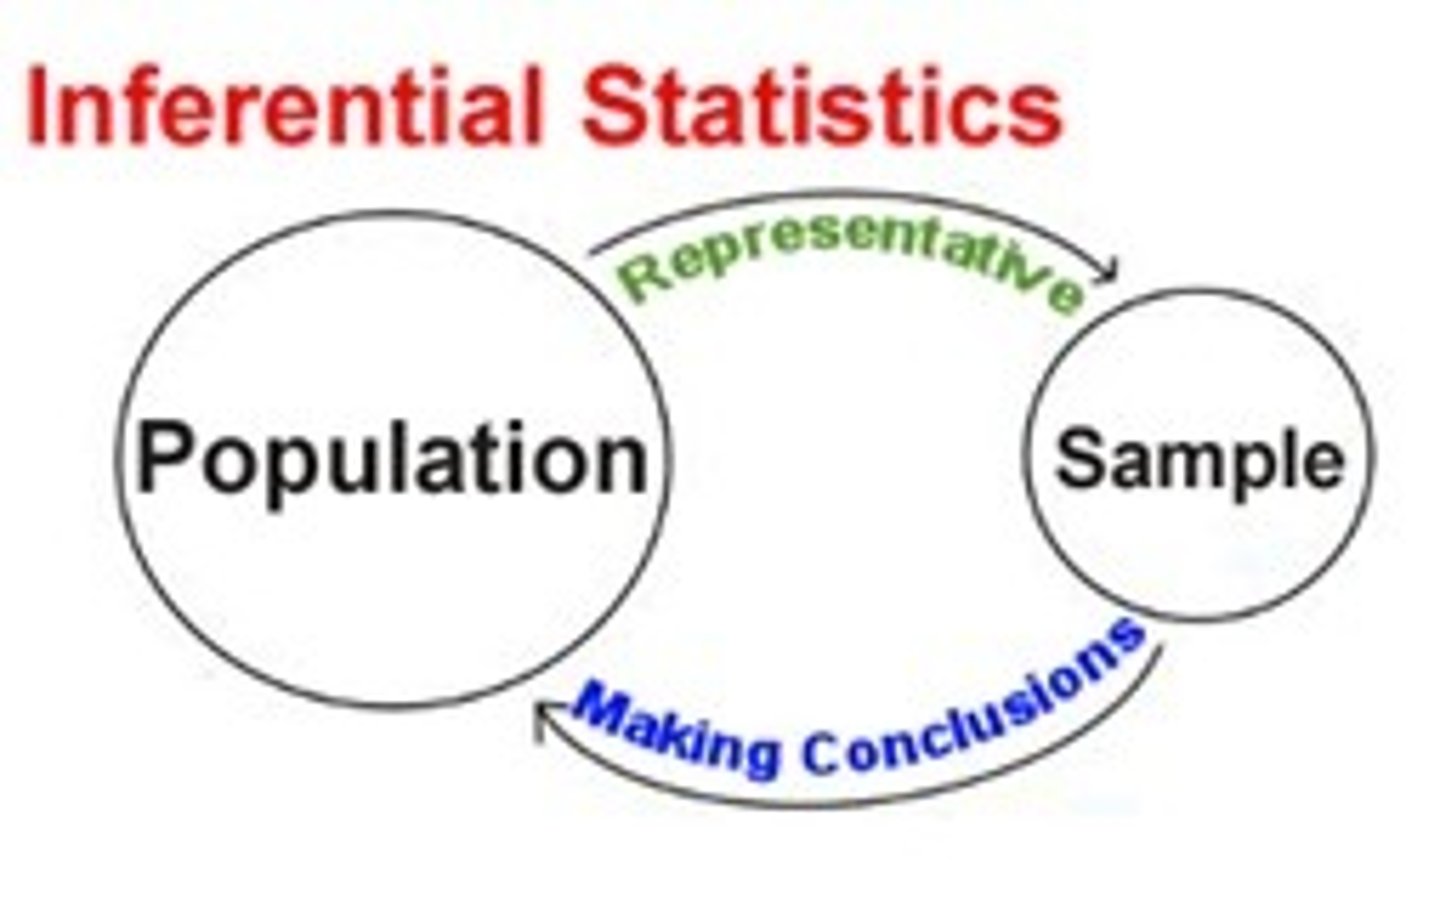
Inferential Statistics uses statistical methods to
make generalizations about a population using a sample drawn from that population.
Relies on more complex probability theories.
Inferential Statistics
Mathematical tools for estimating how likely it is that a statistical result based on data from a random sample is representative of the population from which the sample is assumed to have been selected.
makes assumptions about distribution.
"p-value"
Hypothesis testing.
Descriptive Statistics examples
What is the distribution of dementia by levels of social support?
What is the distribution of trauma scores by level of ACES?
Inferential Statistics examples
Is there a statistically significant relationship between social support and dementia in the population, based on this sample?
Is there a statistically significant relationship between trauma scores and levels of ACEs in the population, based on this sample?
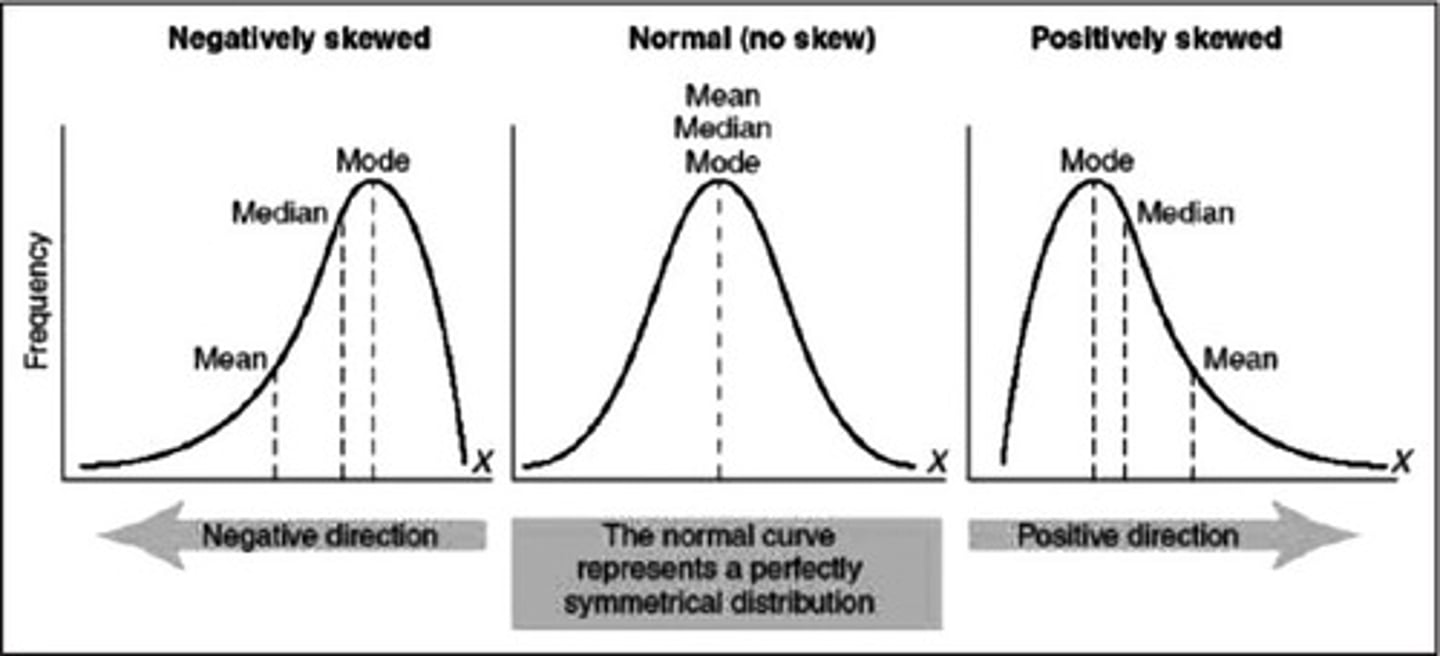
Data Distribution
Data can be distributed in different ways: it can be spread out more on the left, more on the right, or all jump up.
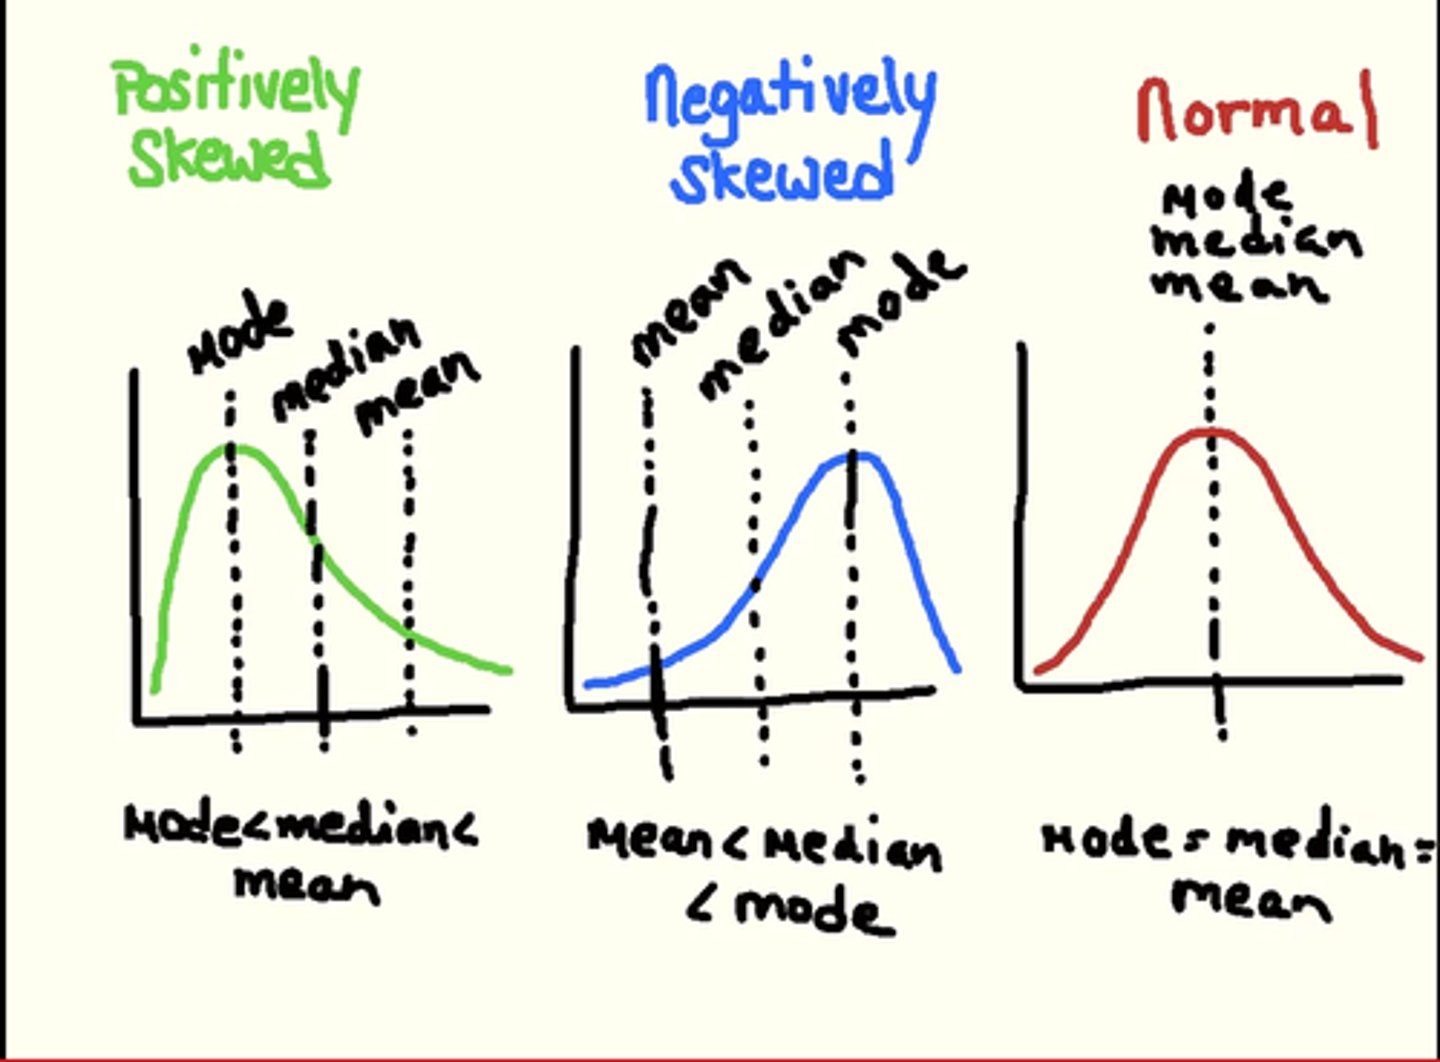
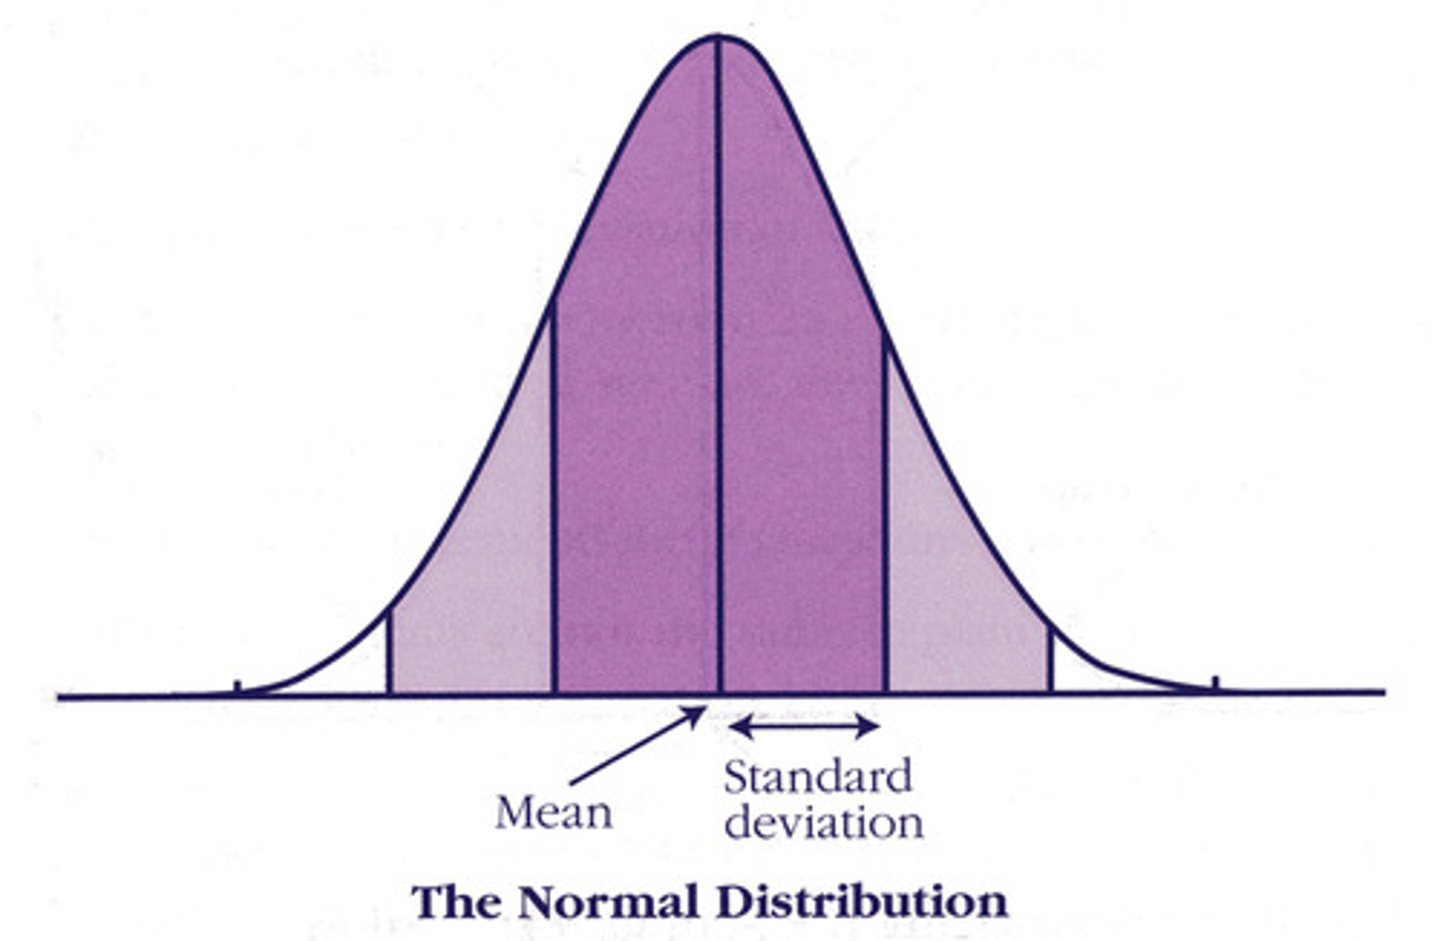
Normal Distribution (bell curve)
The data is evenly (normally) distributed.
Looks like a bell and is symmetric; this shape is important for sampling and statistical analysis.
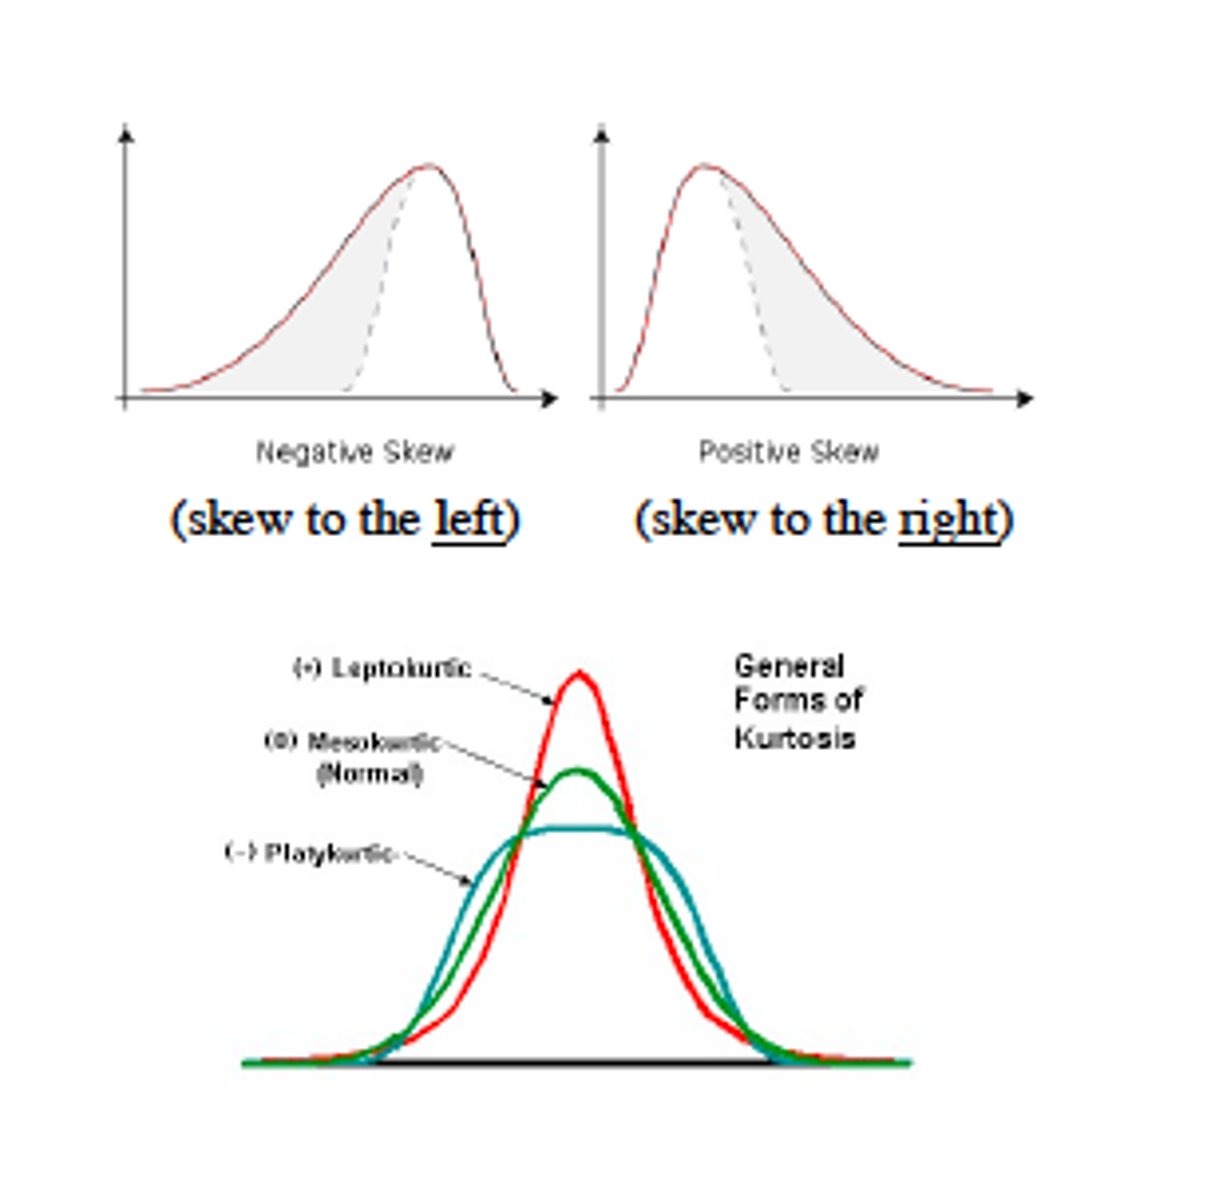
Skewedness
The extent to which cases are clustered more at one or the other end of the distribution of a quantitative variable, rather then in a symmetric pattern around its center.
Highly skewed data can lead to misleading results.
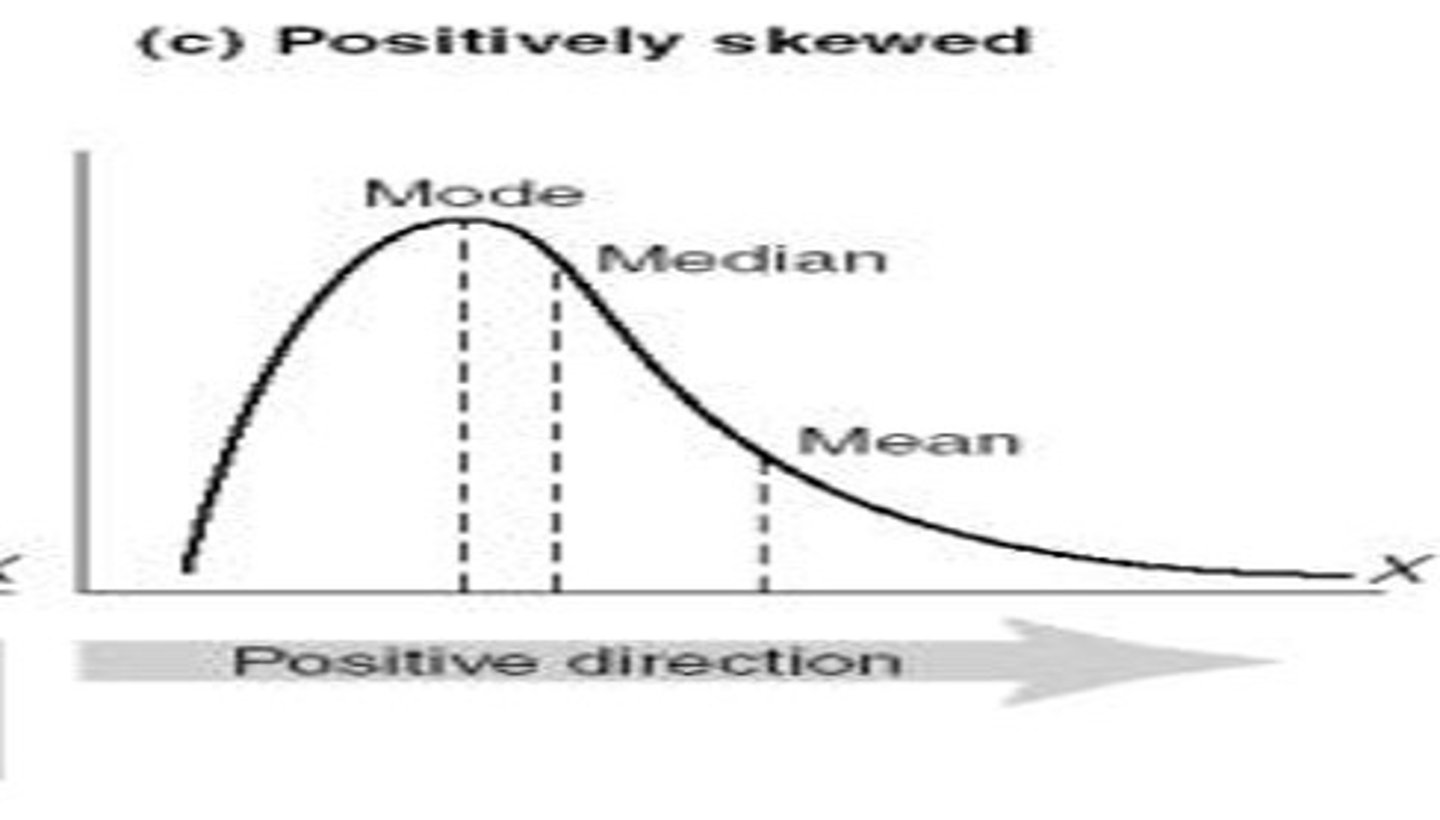
Positive Skew
Skew to the right
Number of cases taper off to the right
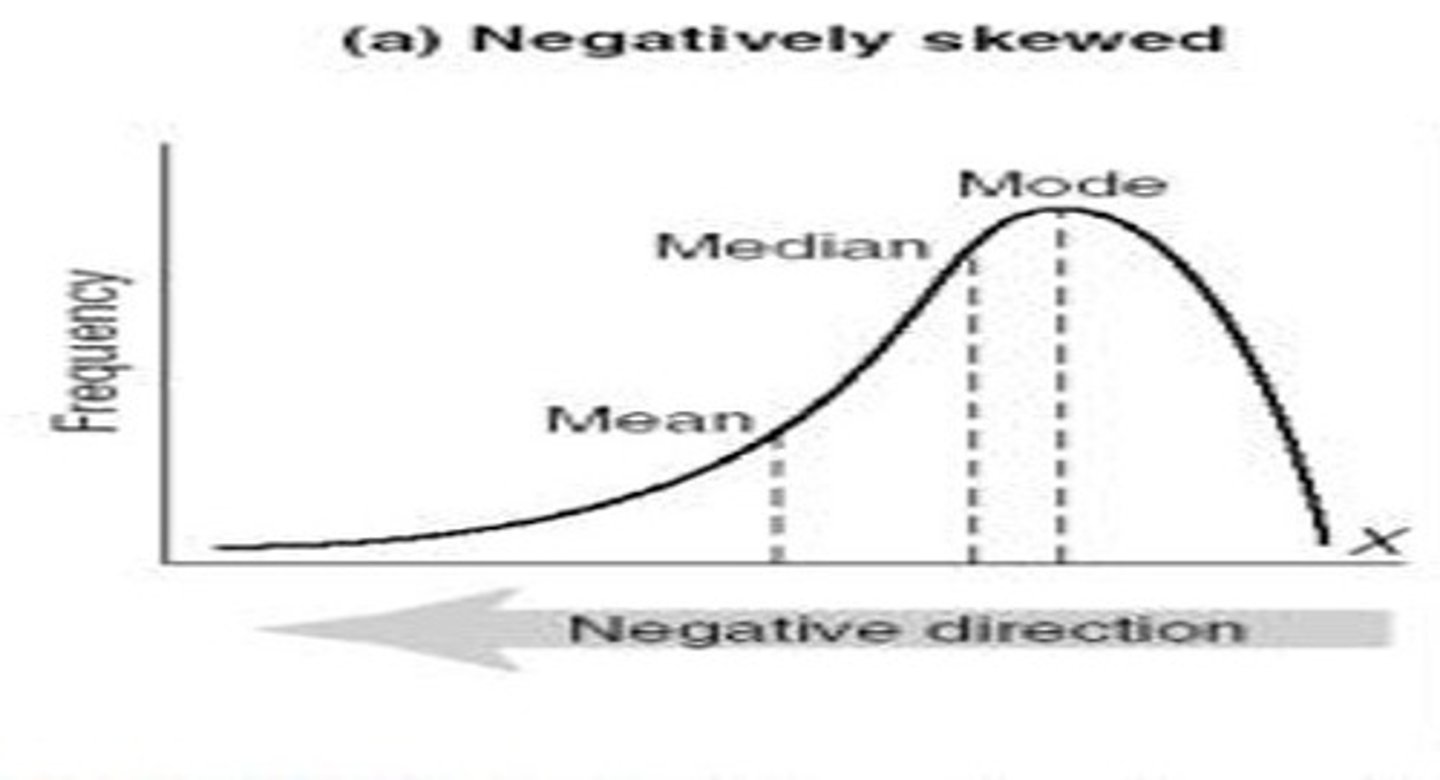
Negative Skew
Skew to the left
Number of cases tapering off to the left
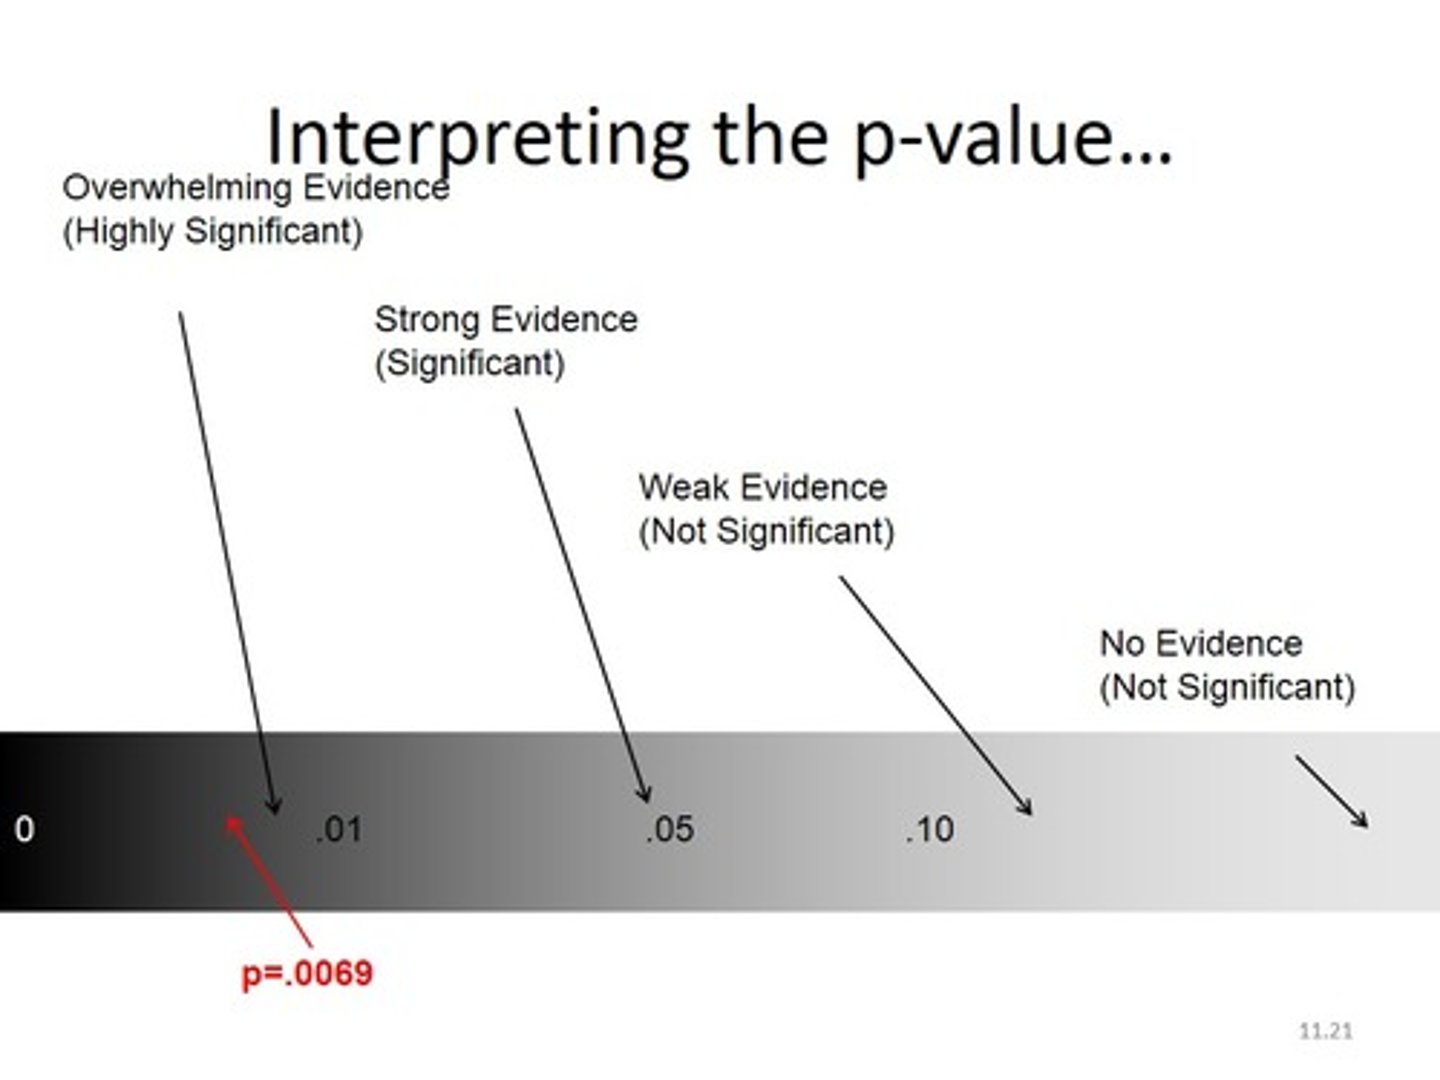
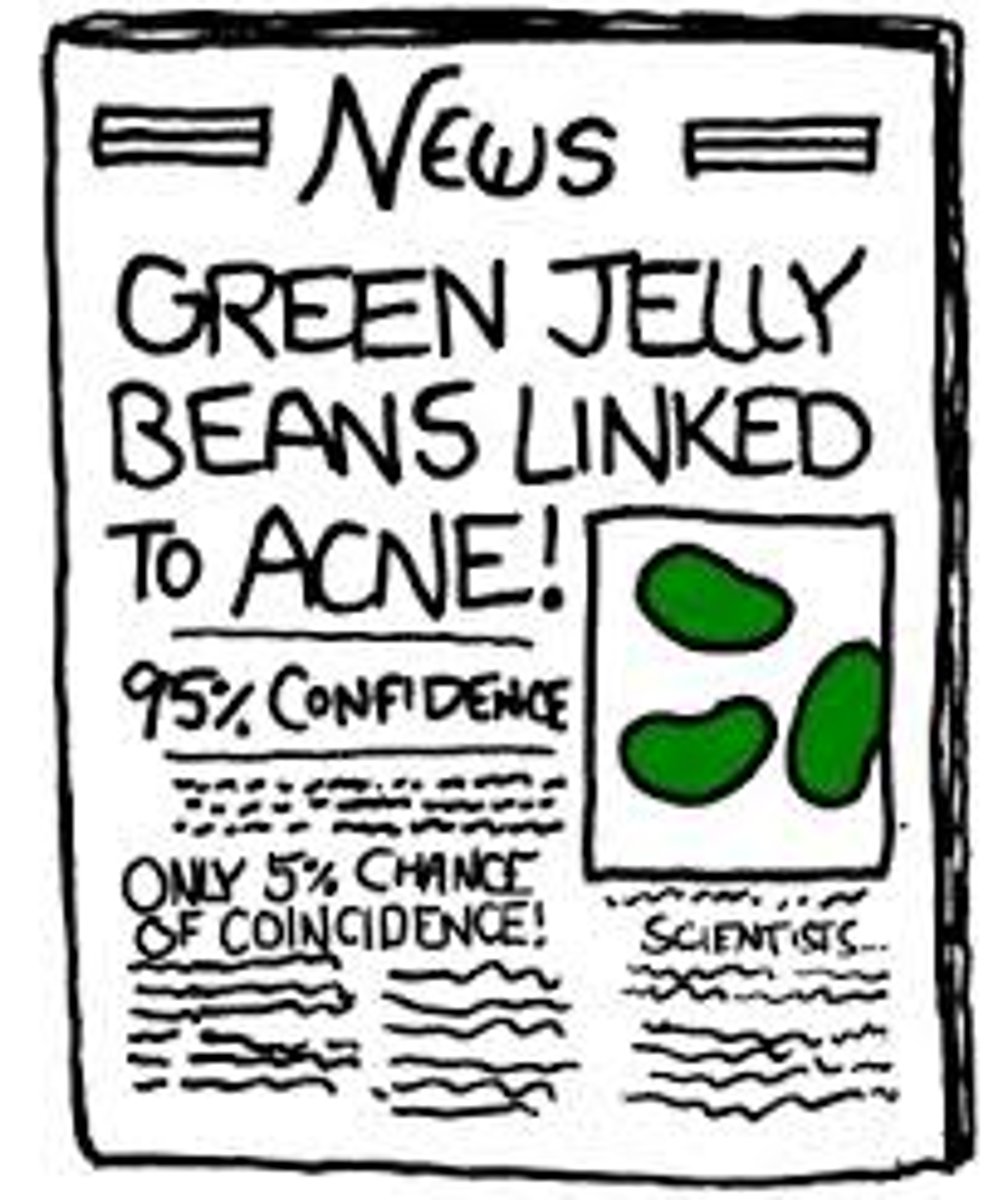
p-value
A number (statistic) used to indicate that the result of a statistical test was not due to chance (random variation).
A "significant" effect or difference.
Think of as the probability that what was found was due to chance. ("p" = "probability")
Relates to inferential rather than descriptive statistics.
p < 0.05
Generally, the acceptable cut off (sometimes p < .10 for more exploratory research) for a result to be "statistically significant".
May also see p < 0.01; p < 0.001 -- these are all acceptable.
Hypothesis
Propose relationship between two variables.
A tentative statement about empirical reality involving a relationship between two or more variables.
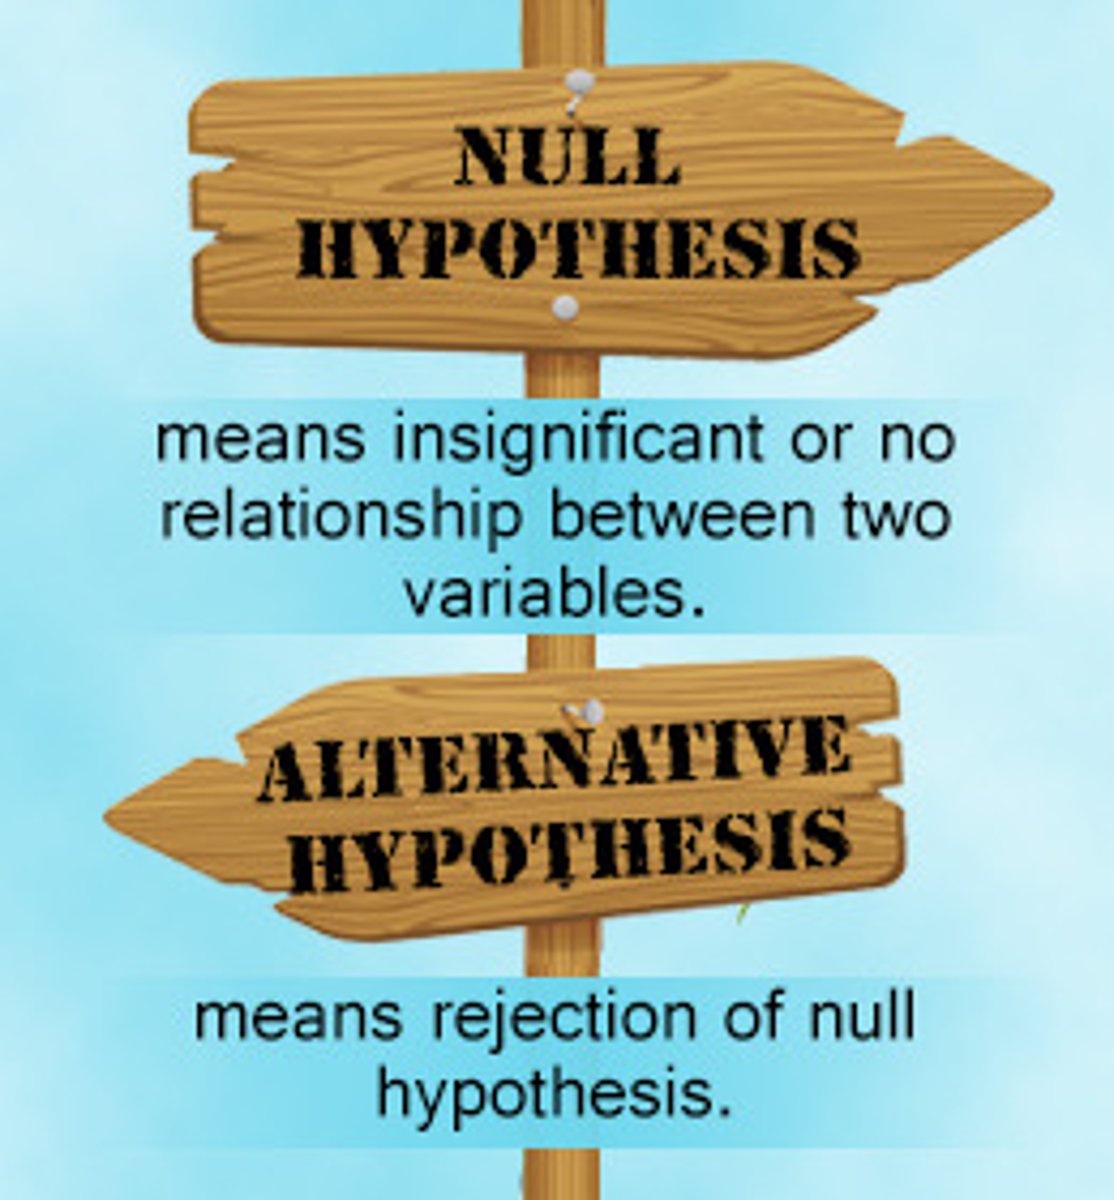
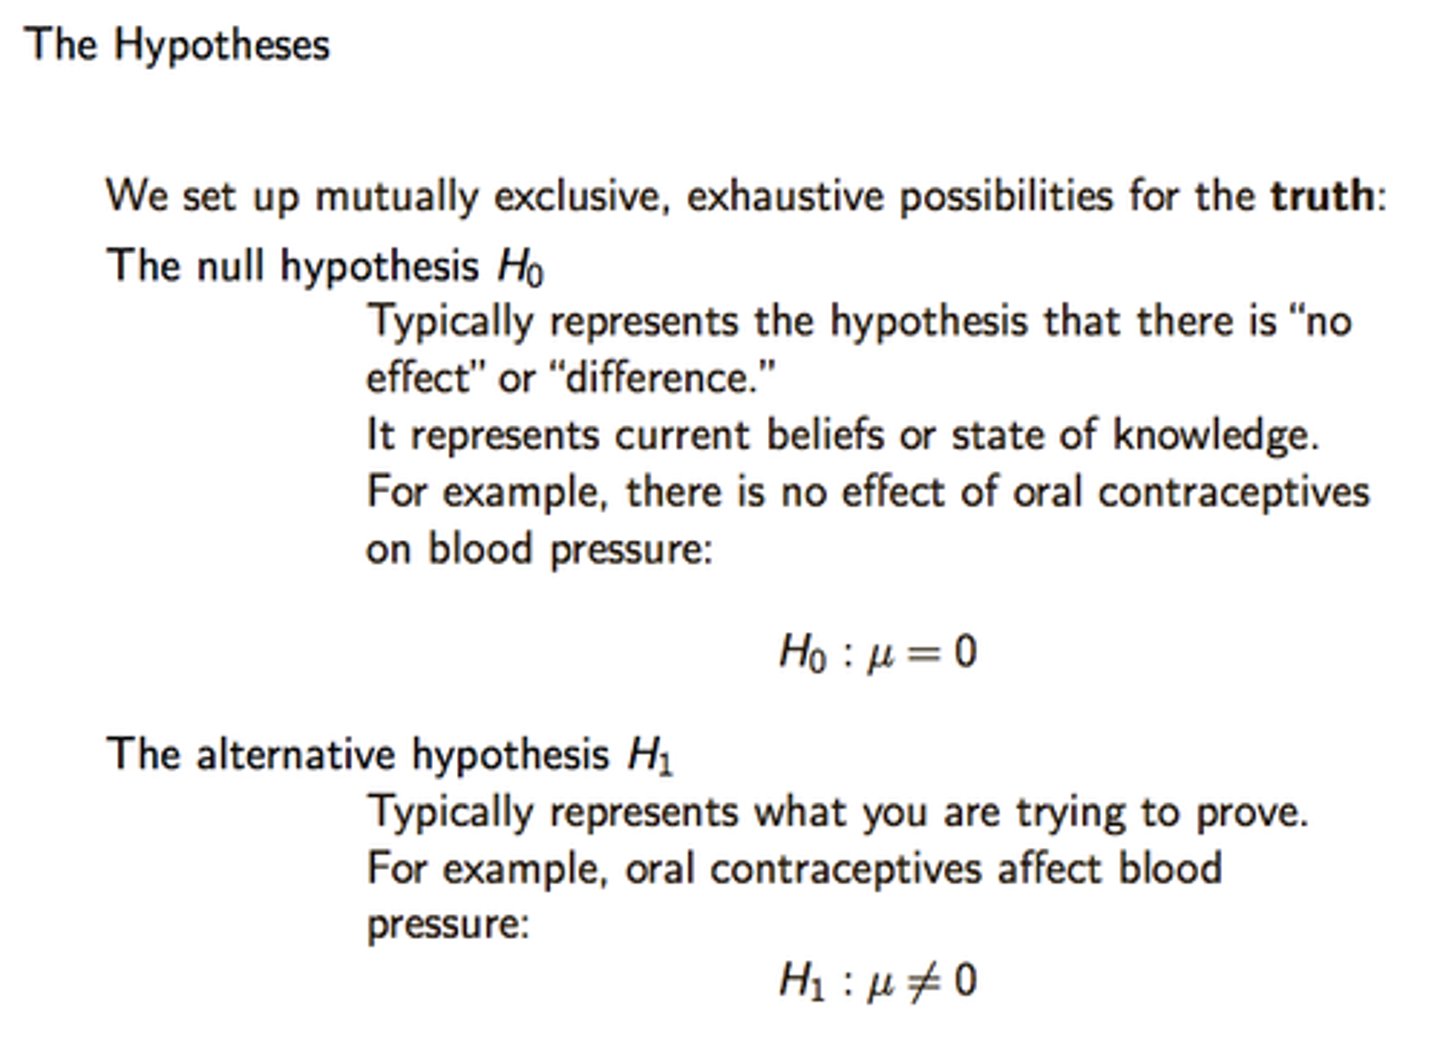
Null Hypothesis (Ho)
The hypothesis of no (null) effects. The hypothesis you are testing against; try to dissolve or discredit; there is no statistical significance between the two variables.
Alternative Hypothesis (Ha)
The hypothesis of something being different than the null. The hypothesis you are testing; here is a statistically significant relationship between two variables.
Statistically Significant
A p-value less than 0.05 is typically considered statistically significant, in which case the null hypothesis (Ho) should be rejected.
Hypothesis Example
You believe there is a lower level of depression in our class than in the general population, so you give students in the class the BDI (Beck's Depression Inventory) & take the average.
Hypothesis Example: (Ho) or (Ha) ?
(Ho) = The average level of depression in this class is the same as the general population.
(Ha)= The average level of depression in this class is lower than (different than) the general population.
You reject the null hypothesis and accept the alternative hypothesis if statistics indicate a difference (with a p < 0.05 level of confidence) => 95% sure that the average level of depression in our class is lower than the general population.