Candlestick Patterns
1/95
There's no tags or description
Looks like no tags are added yet.
Name | Mastery | Learn | Test | Matching | Spaced | Call with Kai |
|---|
No analytics yet
Send a link to your students to track their progress
96 Terms
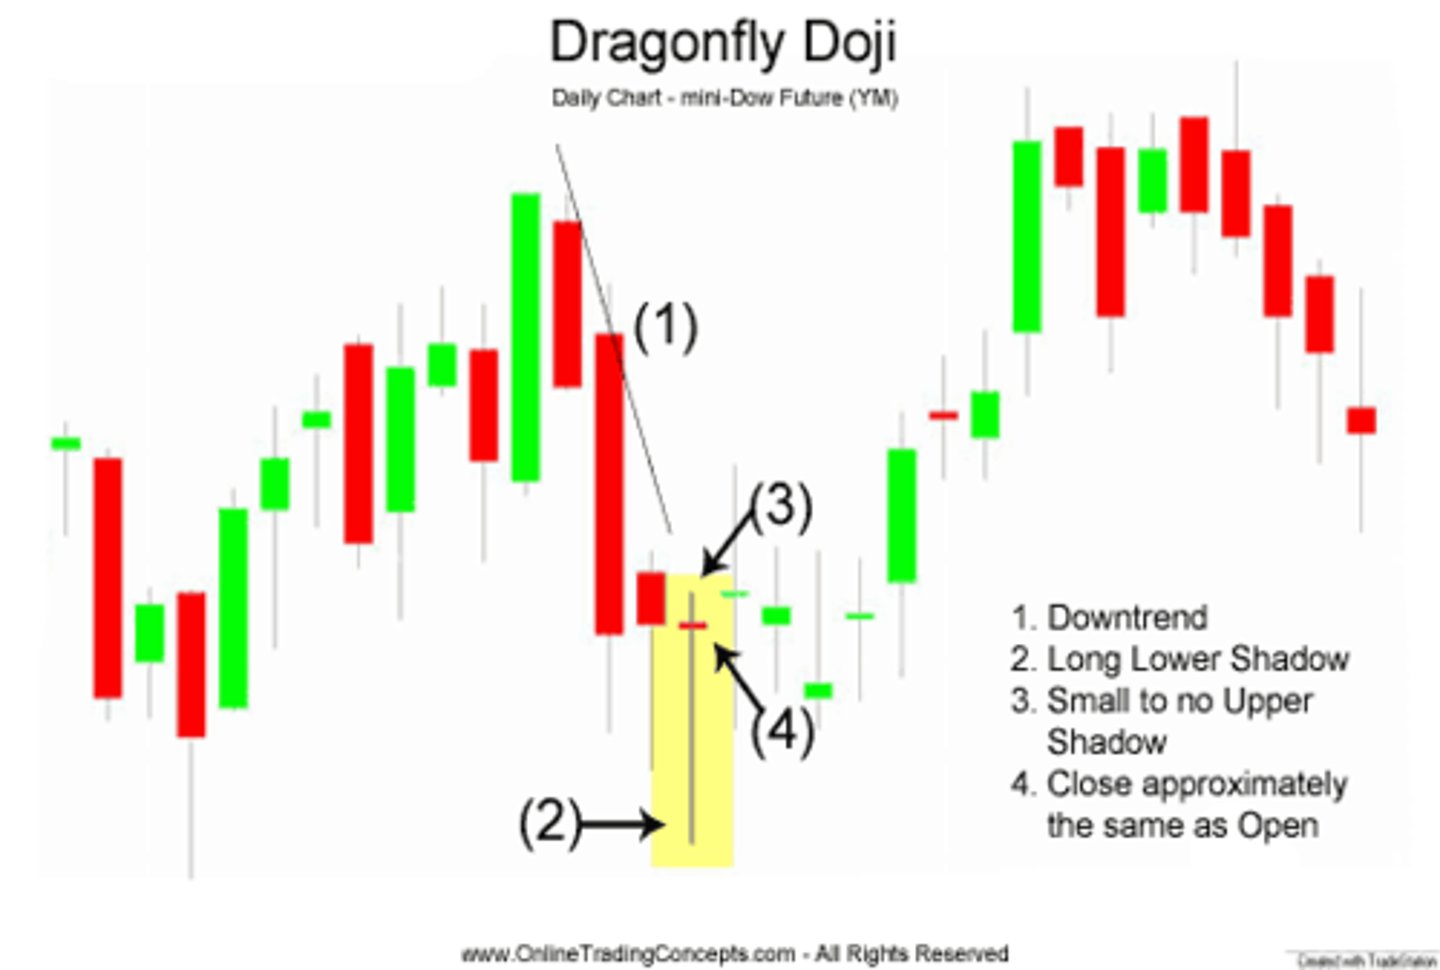
Dragonfly Doji
A type of candlestick pattern that signals indecision among traders. deemed to be a reliable signal that the trend is about to change direction
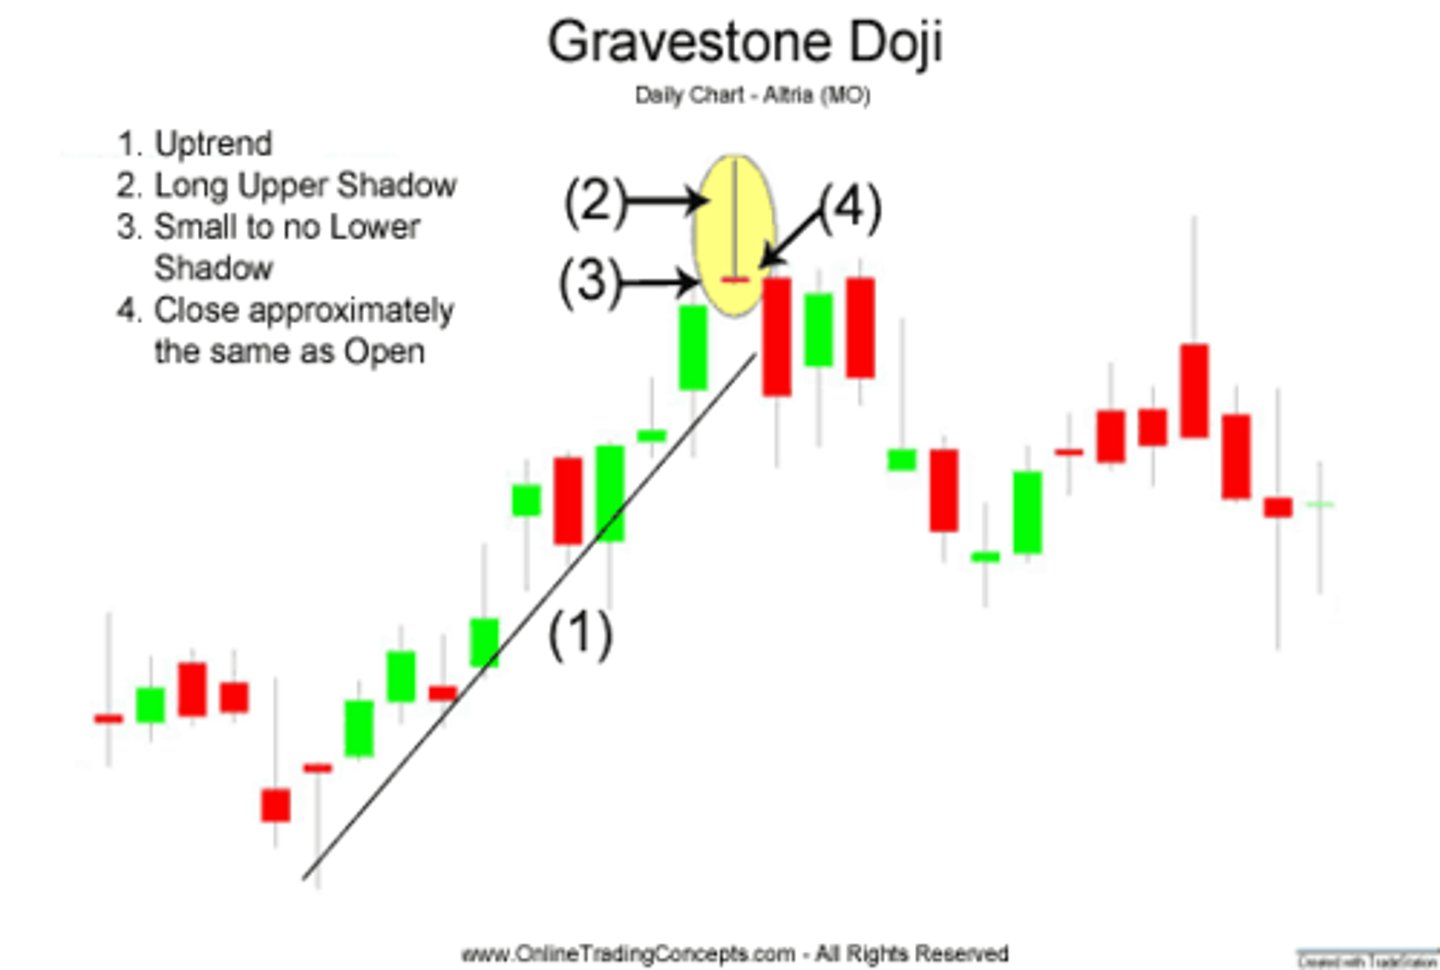
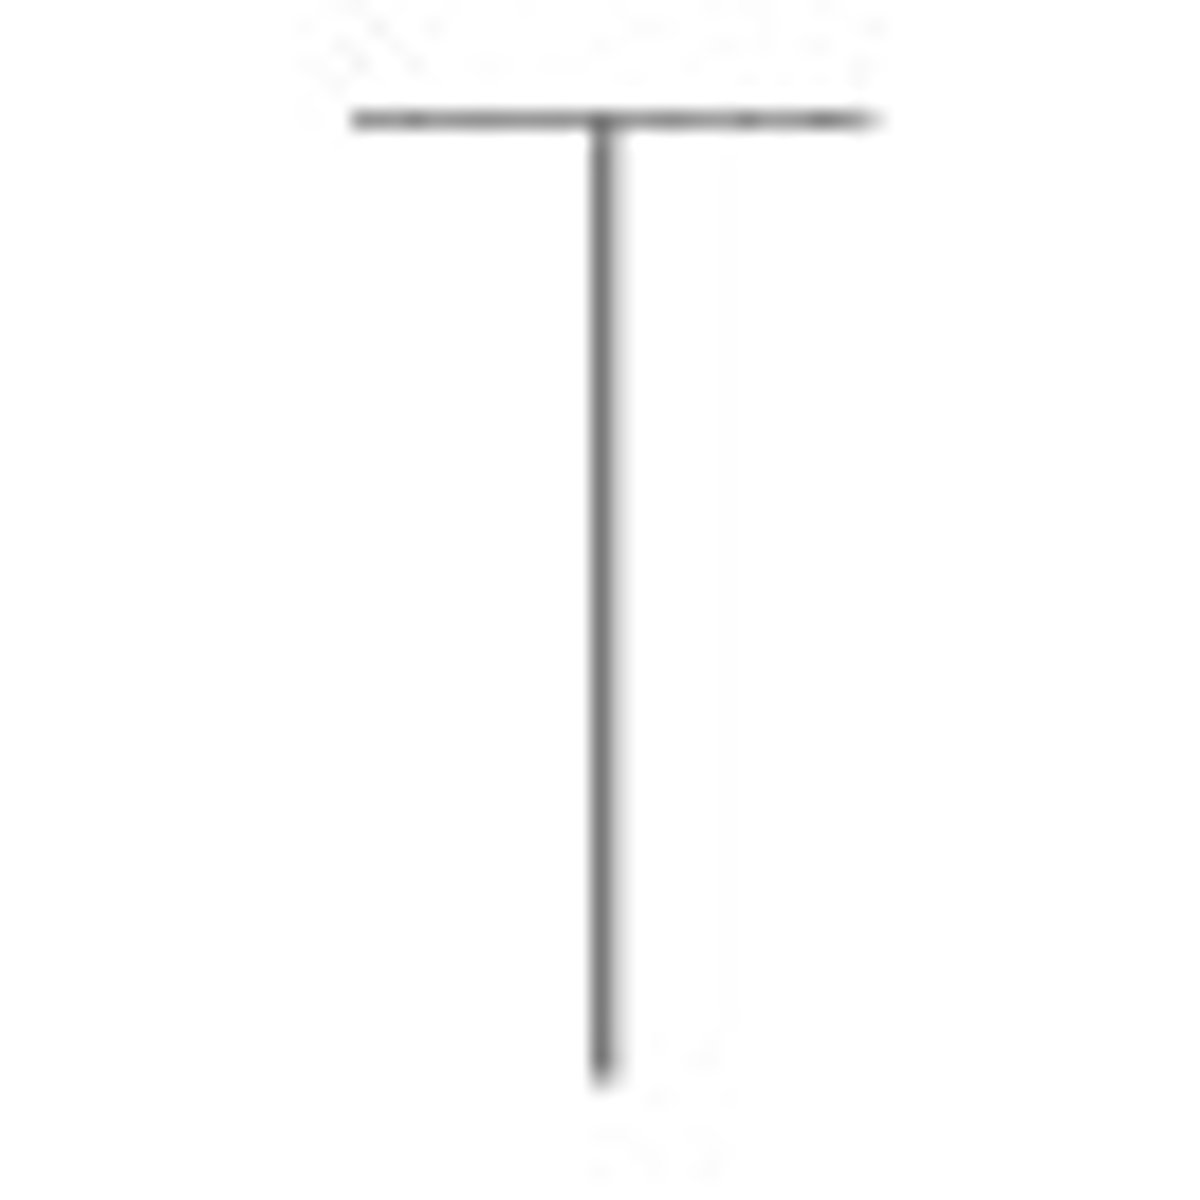
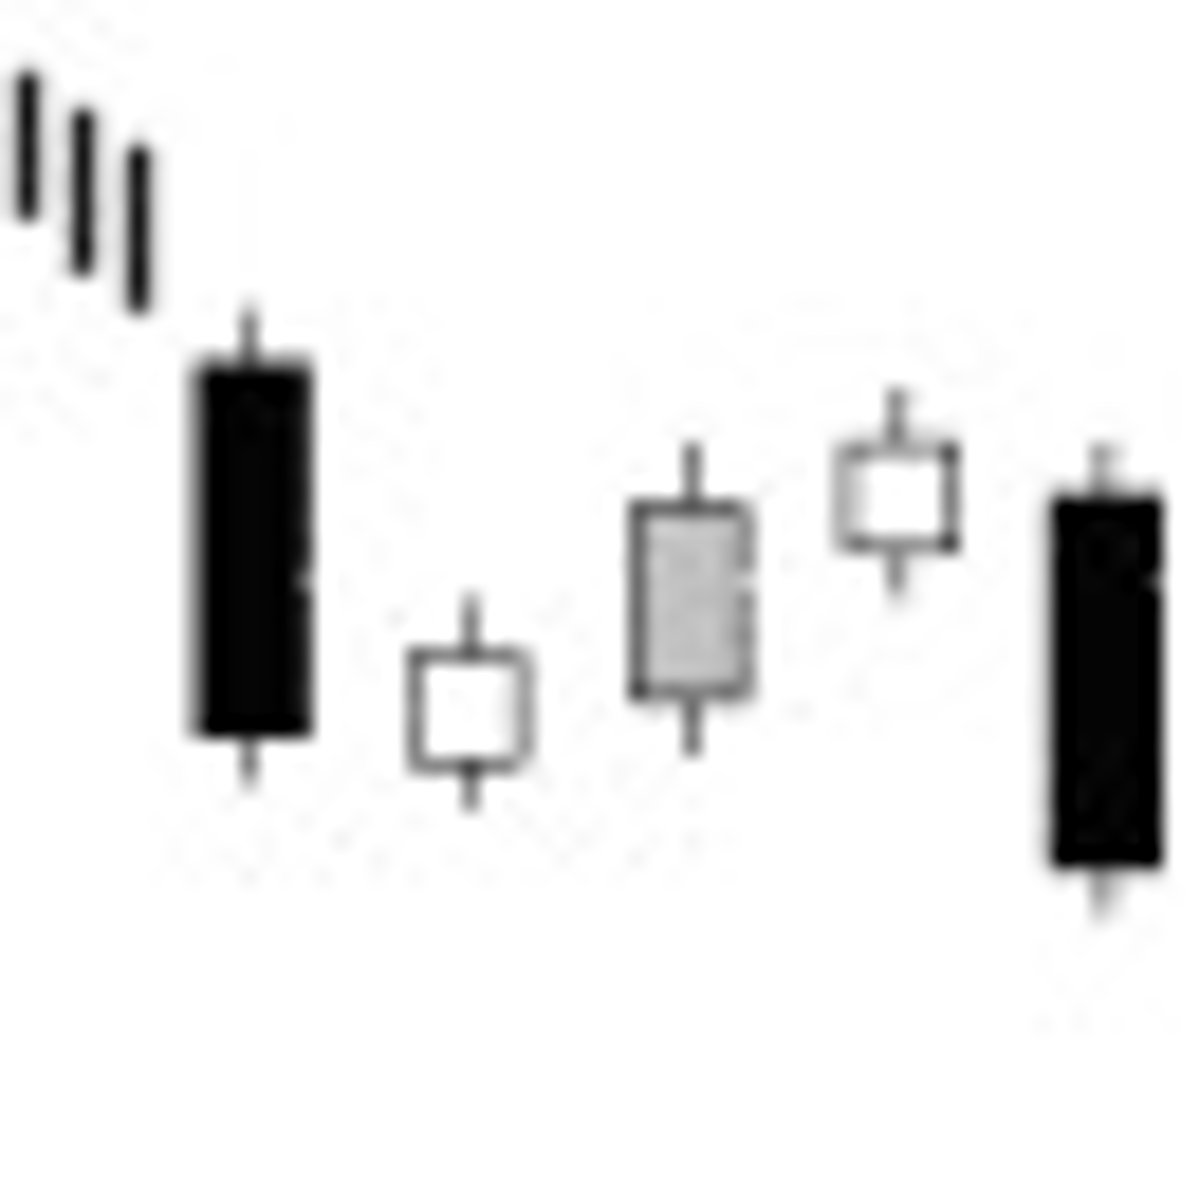
Gravestone Doji
A gravestone doji pattern is a common reversal pattern used by traders to suggest that a bullish rally or trend is about to reverse. It can also be found at the end of a downtrend, but this version is much more rare. As you can see from the chart, on the day of the gravestone doji (shown within the black box), bearish traders realized that the price was pushed up to unjustifiably high levels so they send the price back up to where the stock opened. The close near the day's low suggests that supply is starting to outweigh demand again.
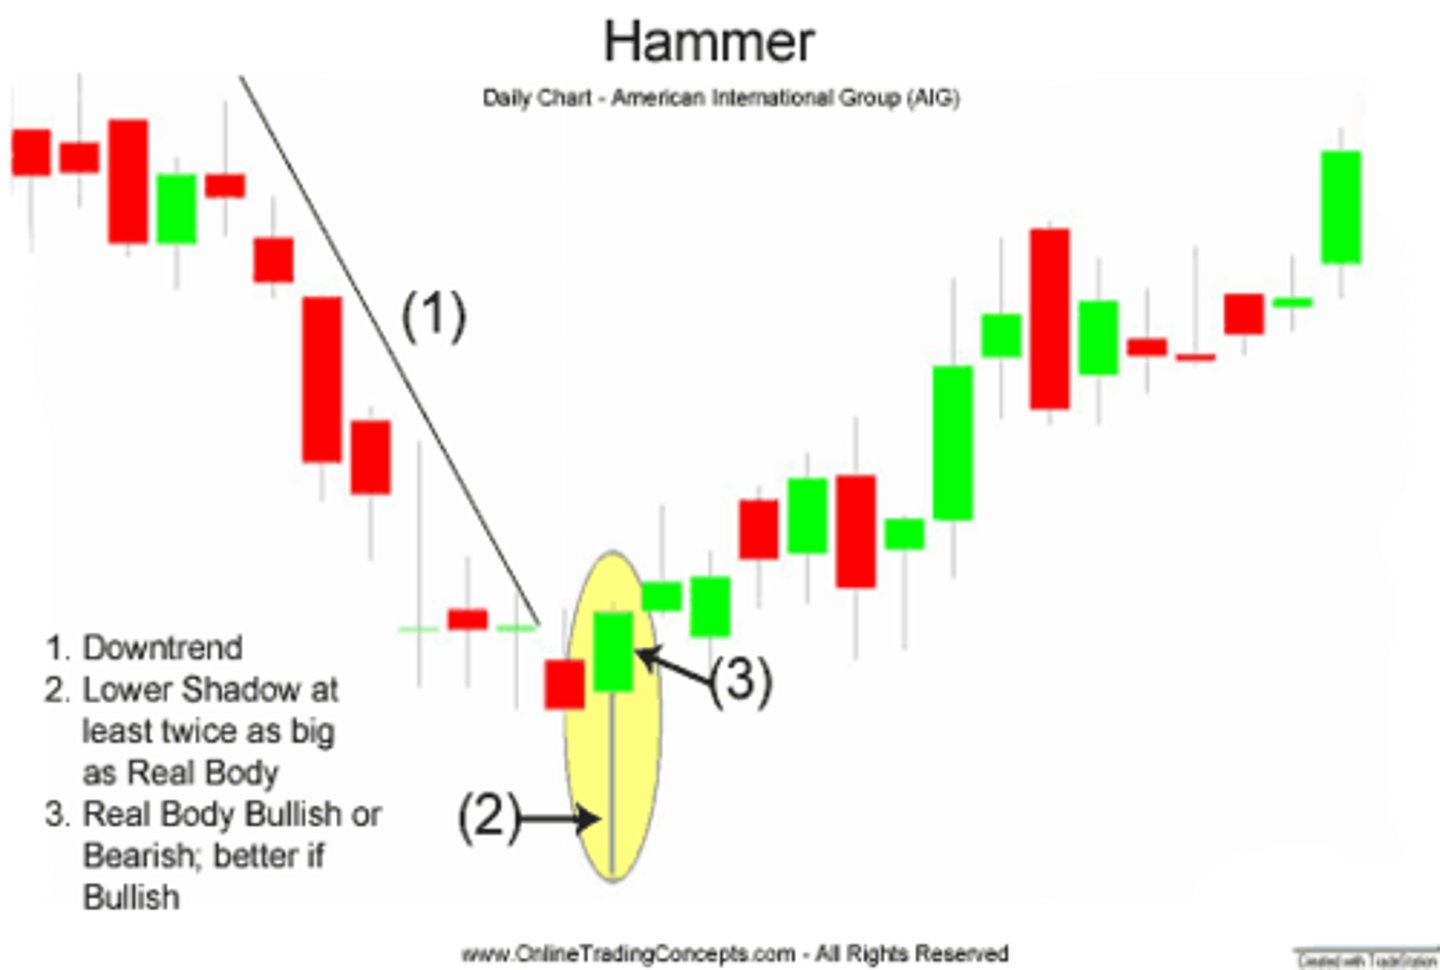
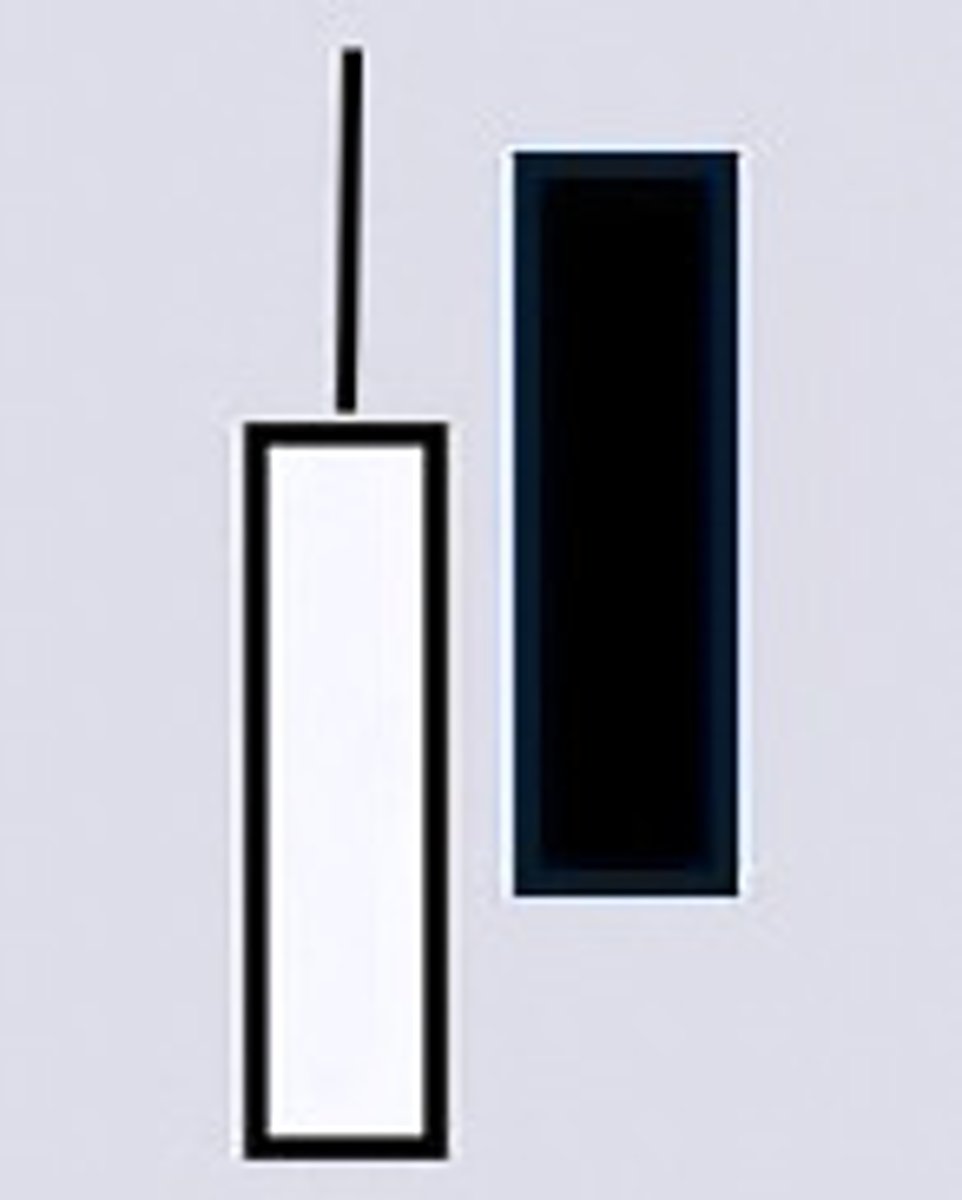
Hammer
A hammer occurs after a security has been declining, possibly suggesting the market is attempting to determine a bottom.
The signal does not mean bullish investors have taken full control of a security, it simply indicates that the bulls are strengthening.
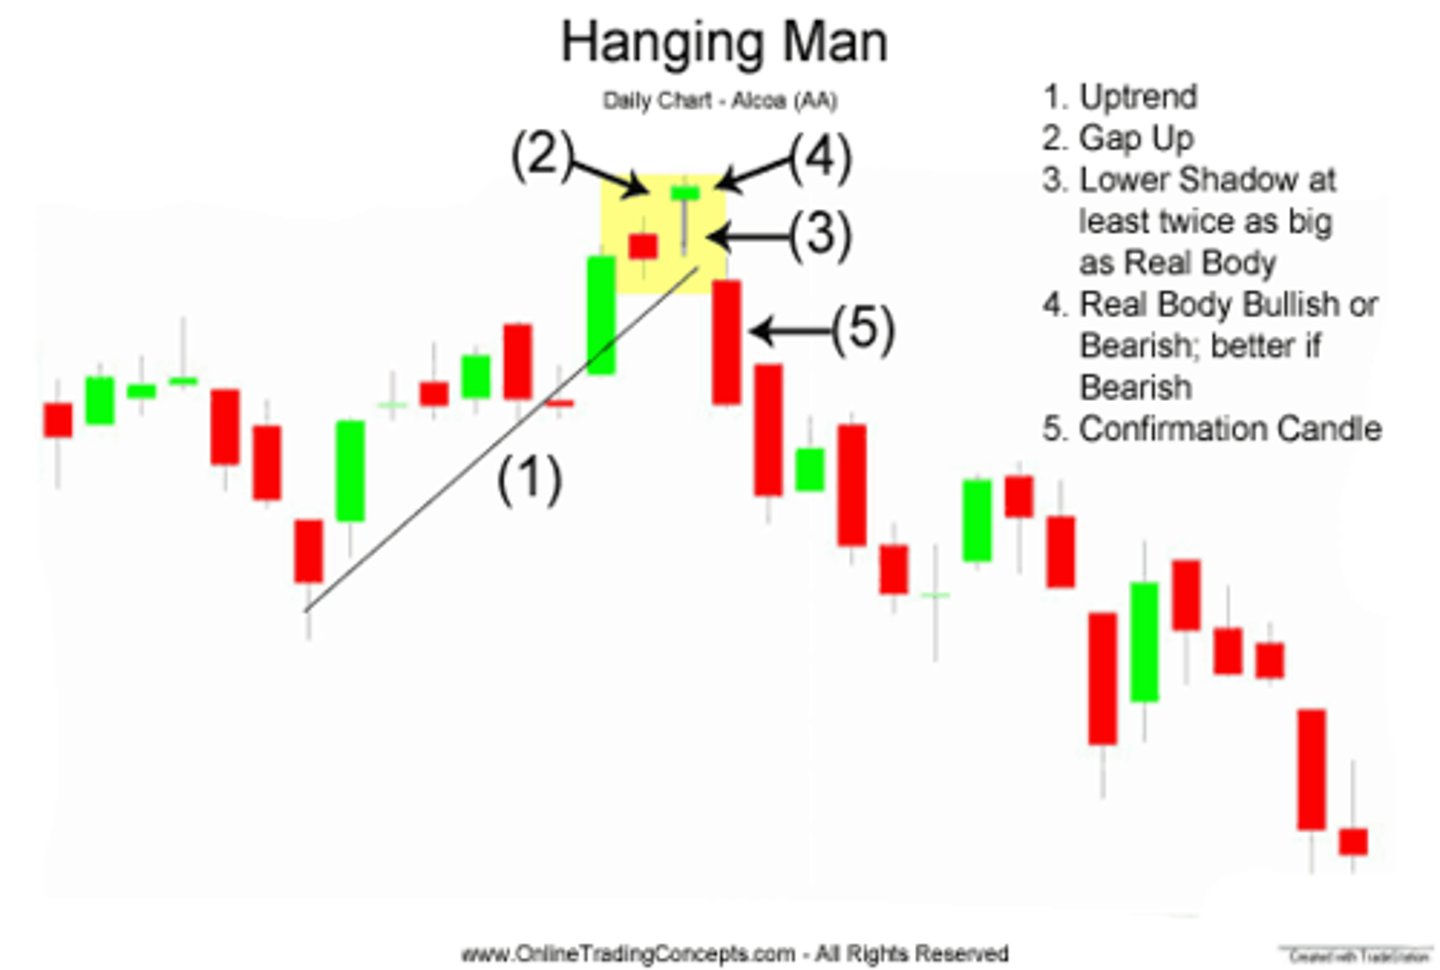
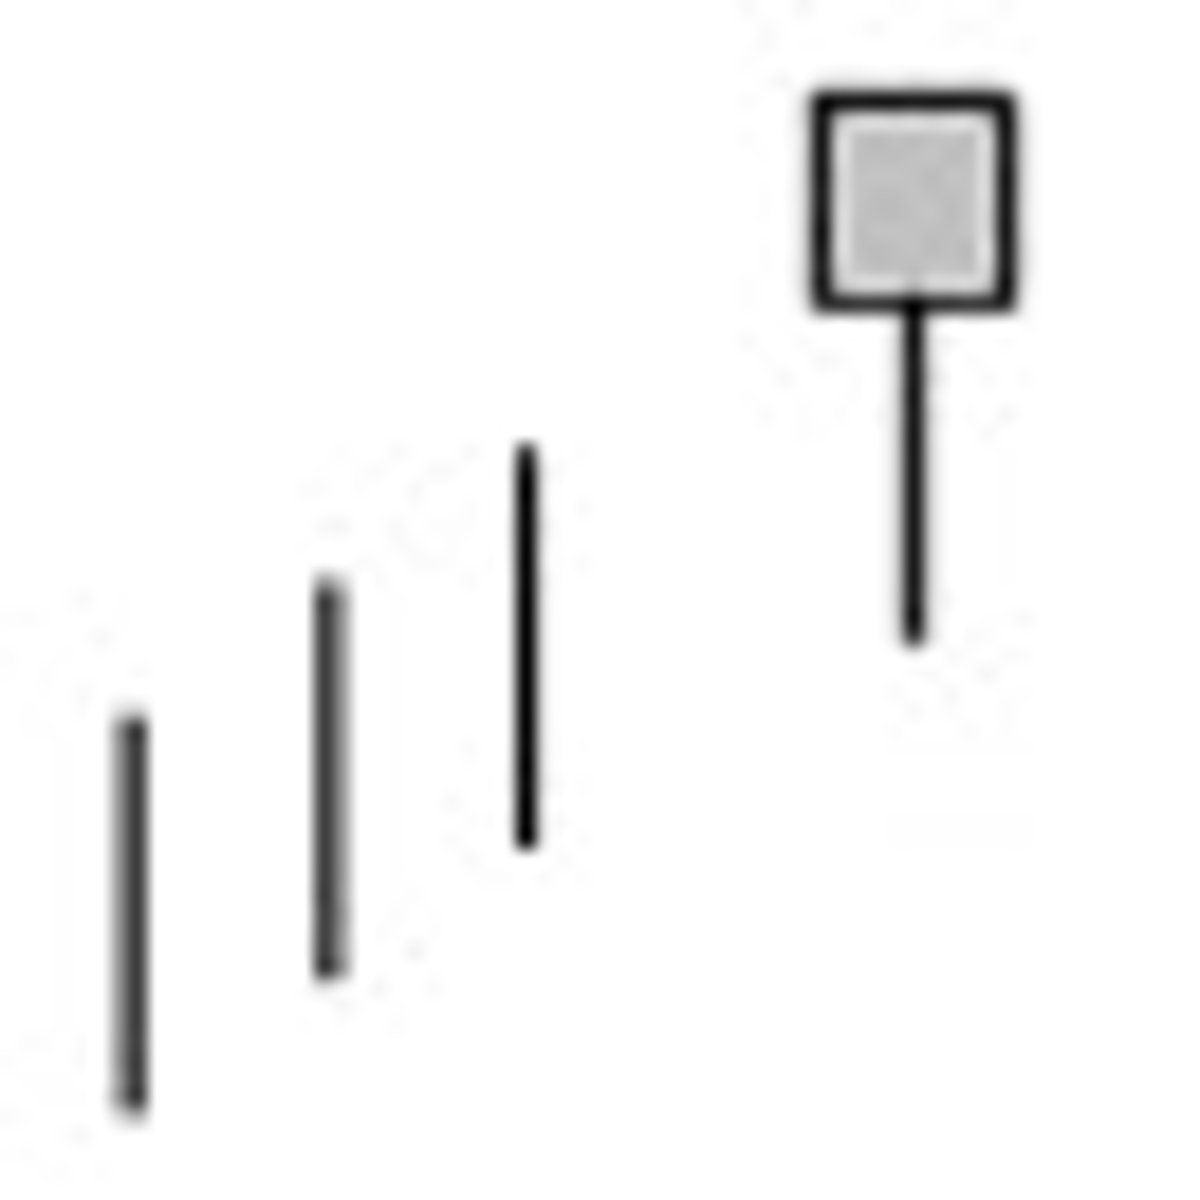
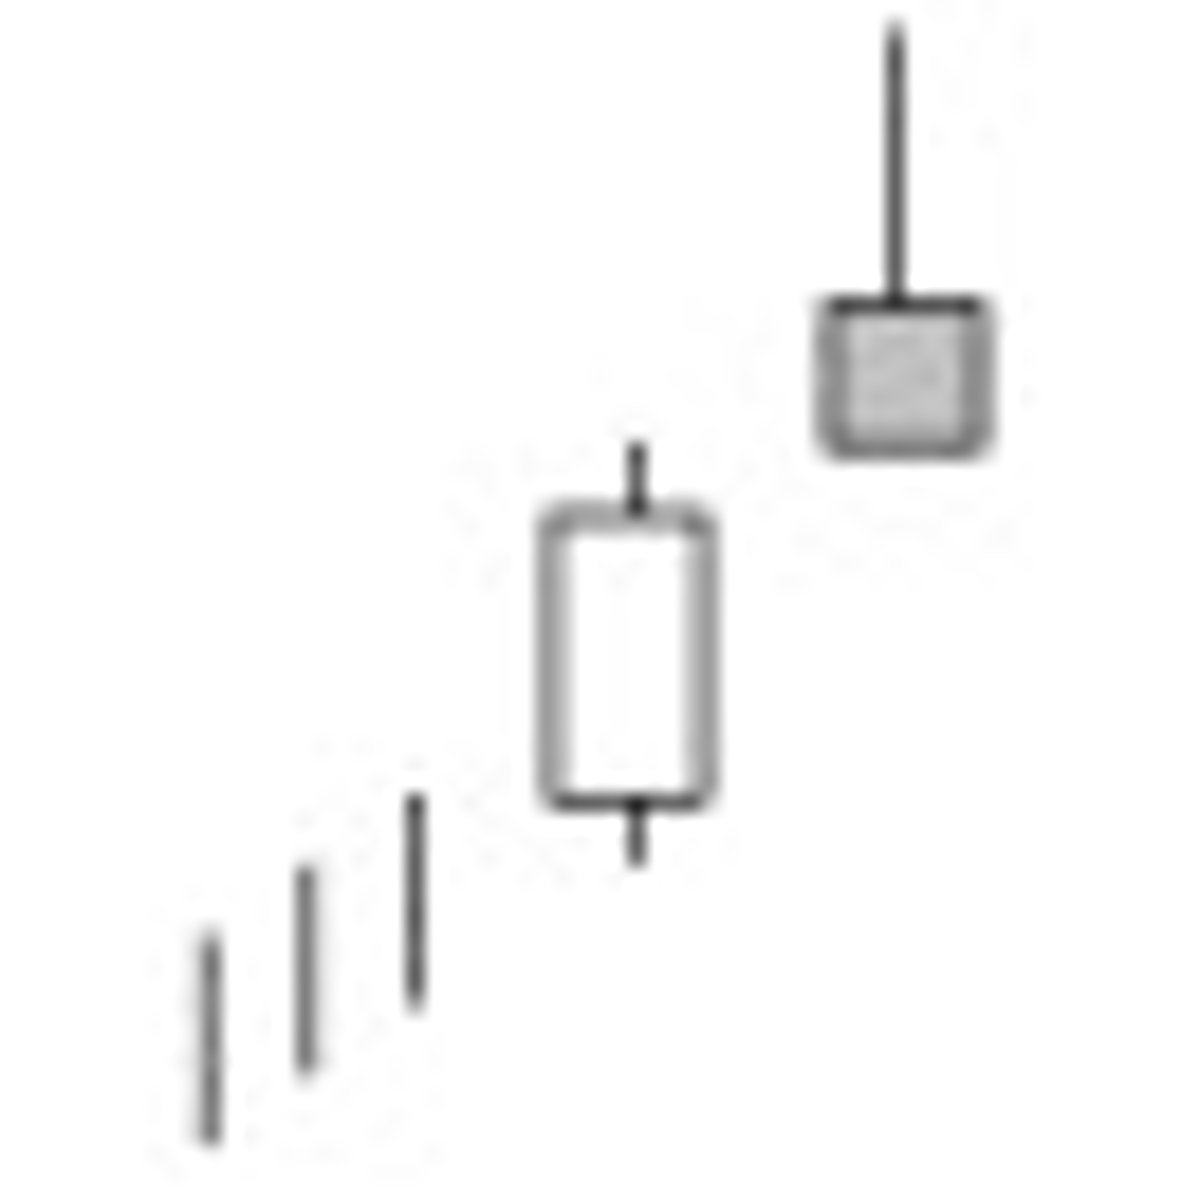
Hanging Man
This formation does not mean that the bulls have definitively lost control, but it may be an early sign that the momentum is decreasing and the direction of the asset may be getting ready to change. The reliability of this signal is drastically improved when the price of the asset decreases the day after the signal. Hanging man formations can be more easily identified in intraday charts than daily charts and are a very popular formation used by day traders.
If this pattern is found at the end of a downtrend, it is known as a "hammer".
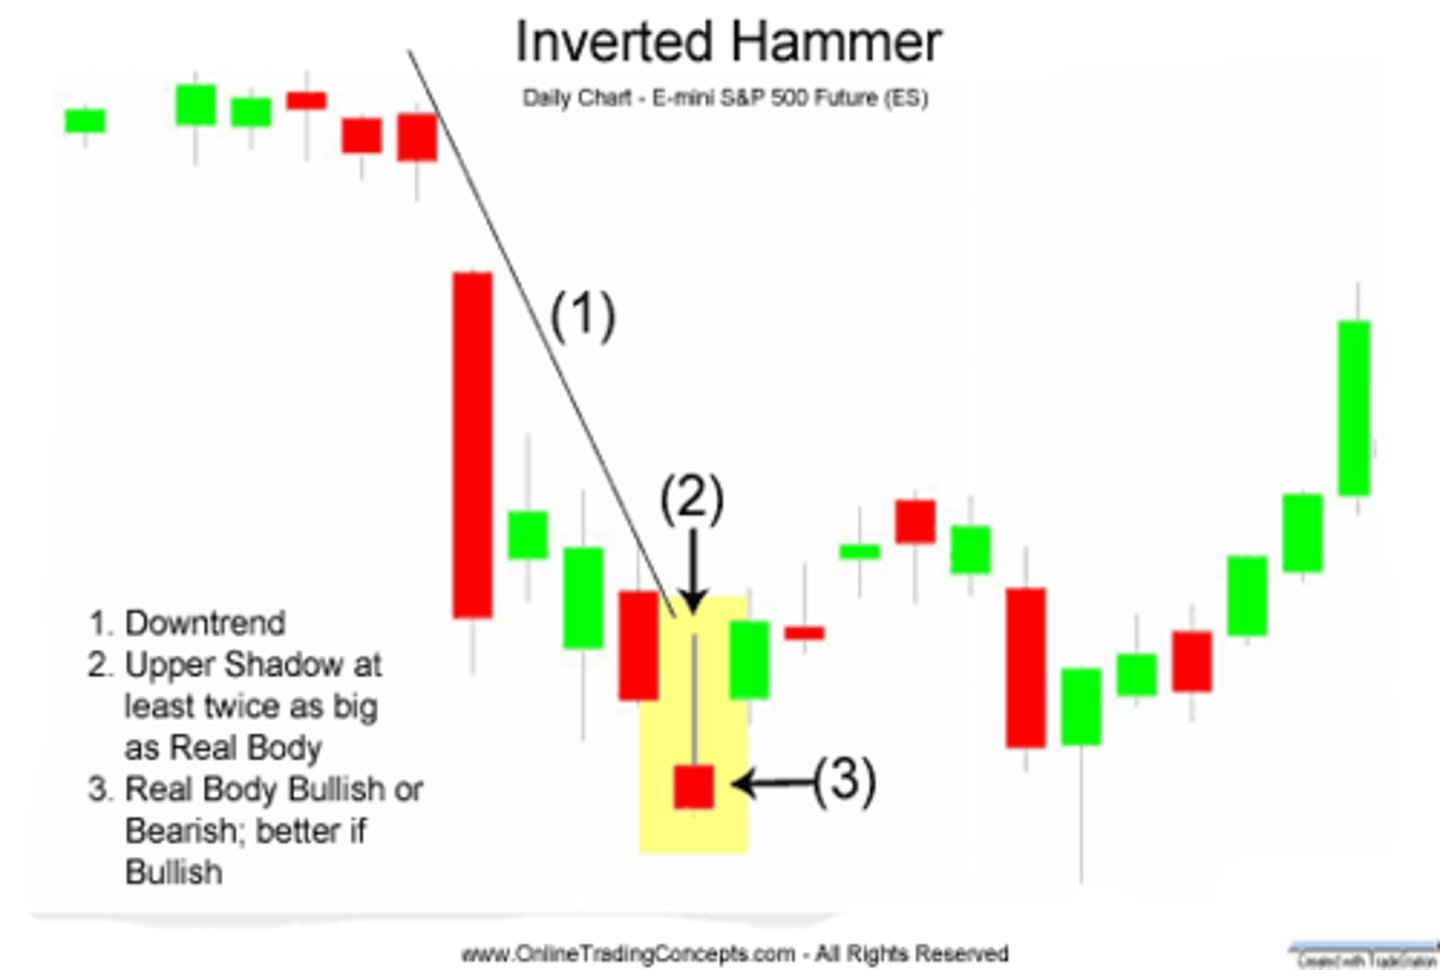
Inverted Hammer
The Inverted Hammer candlestick formation occurs mainly at the bottom of downtrends and can act as a warning of a potential reversal upward. It is important to note that the Inverted pattern is a warning of potential price change, not a signal, in and of itself, to buy.
Shooting Star
The Shooting Star candlestick formation is viewed as a bearish reversal candlestick pattern that typically occurs at the top of uptrends.

Doji
High Wave
The high wave candle expresses doubt and confusion on the part of the market. Until the situation becomes clear, traders should emphasize careful stock selection and minimize position size.
They are indicative of a market in which uncertainty and indecision prevail. Neither the buyers nor the sellers have a clear sense of which direction the market will head. The forces of supply and demand are equally balanced.
Spinning Top
If a spinning top formation is found after a prolonged uptrend, it suggests that the bulls are losing interest in the stock and that a reversal may be in the cards. On the other hand, if this formation is found in an defined downtrend, it suggests that the sellers are losing conviction and that a bottom may be forming.
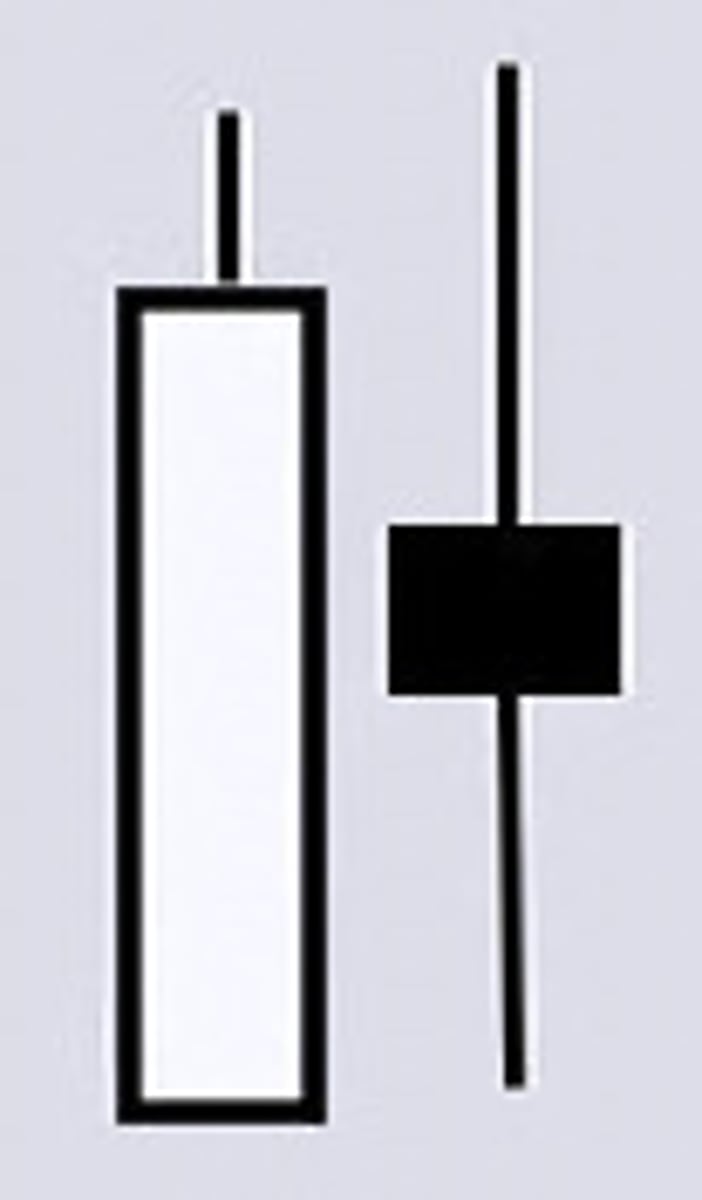
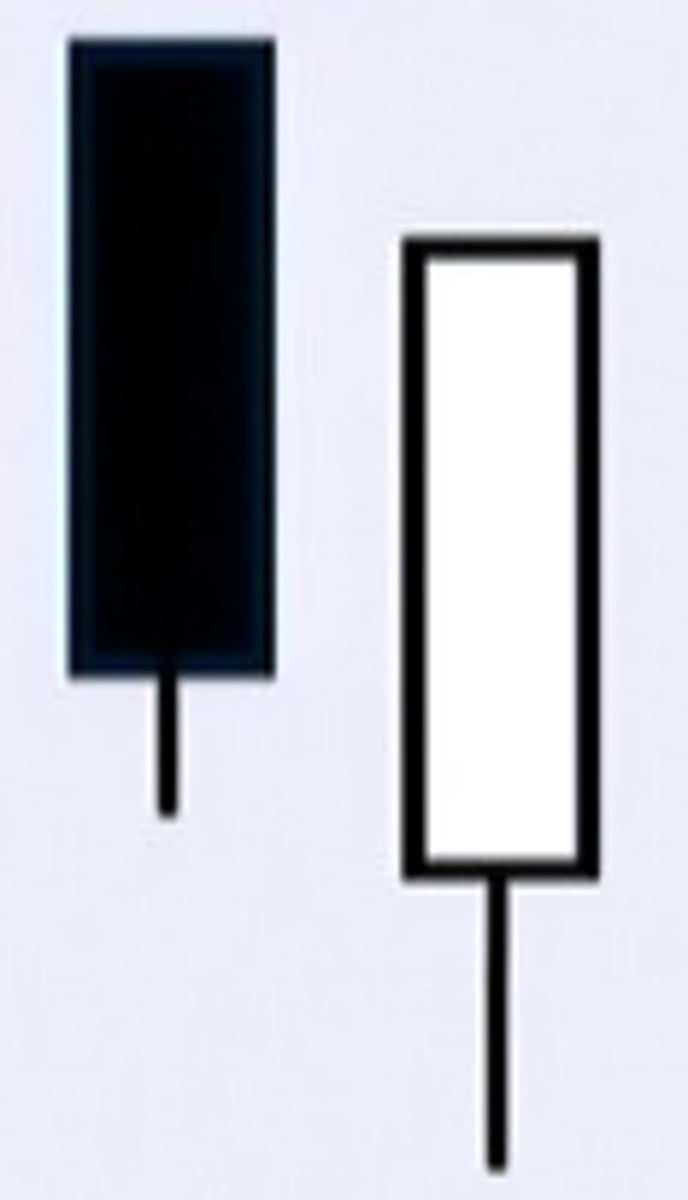
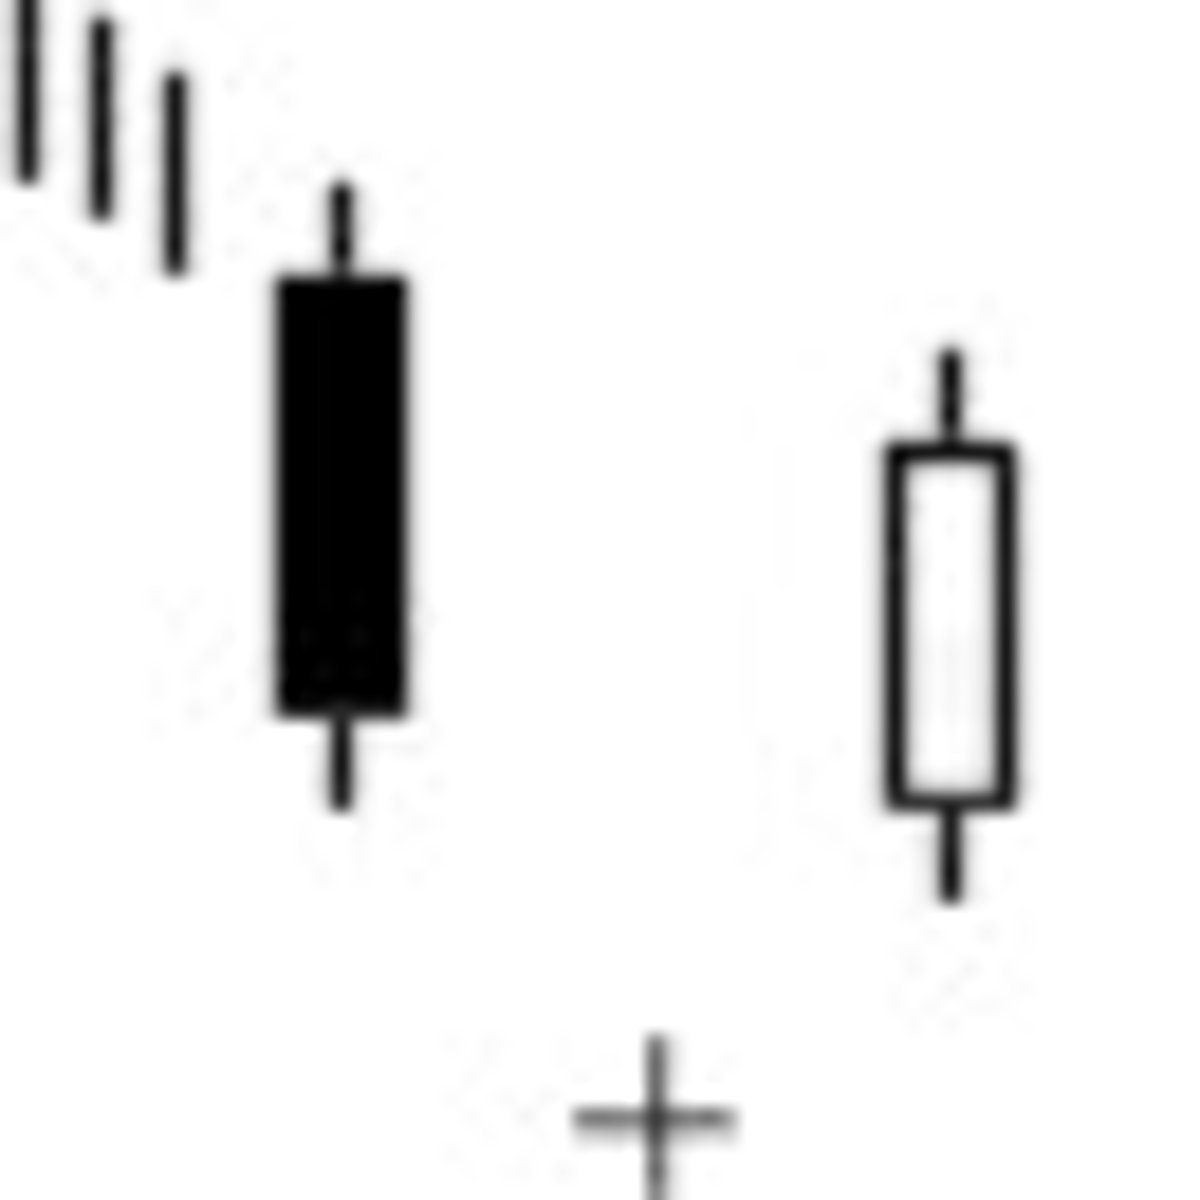
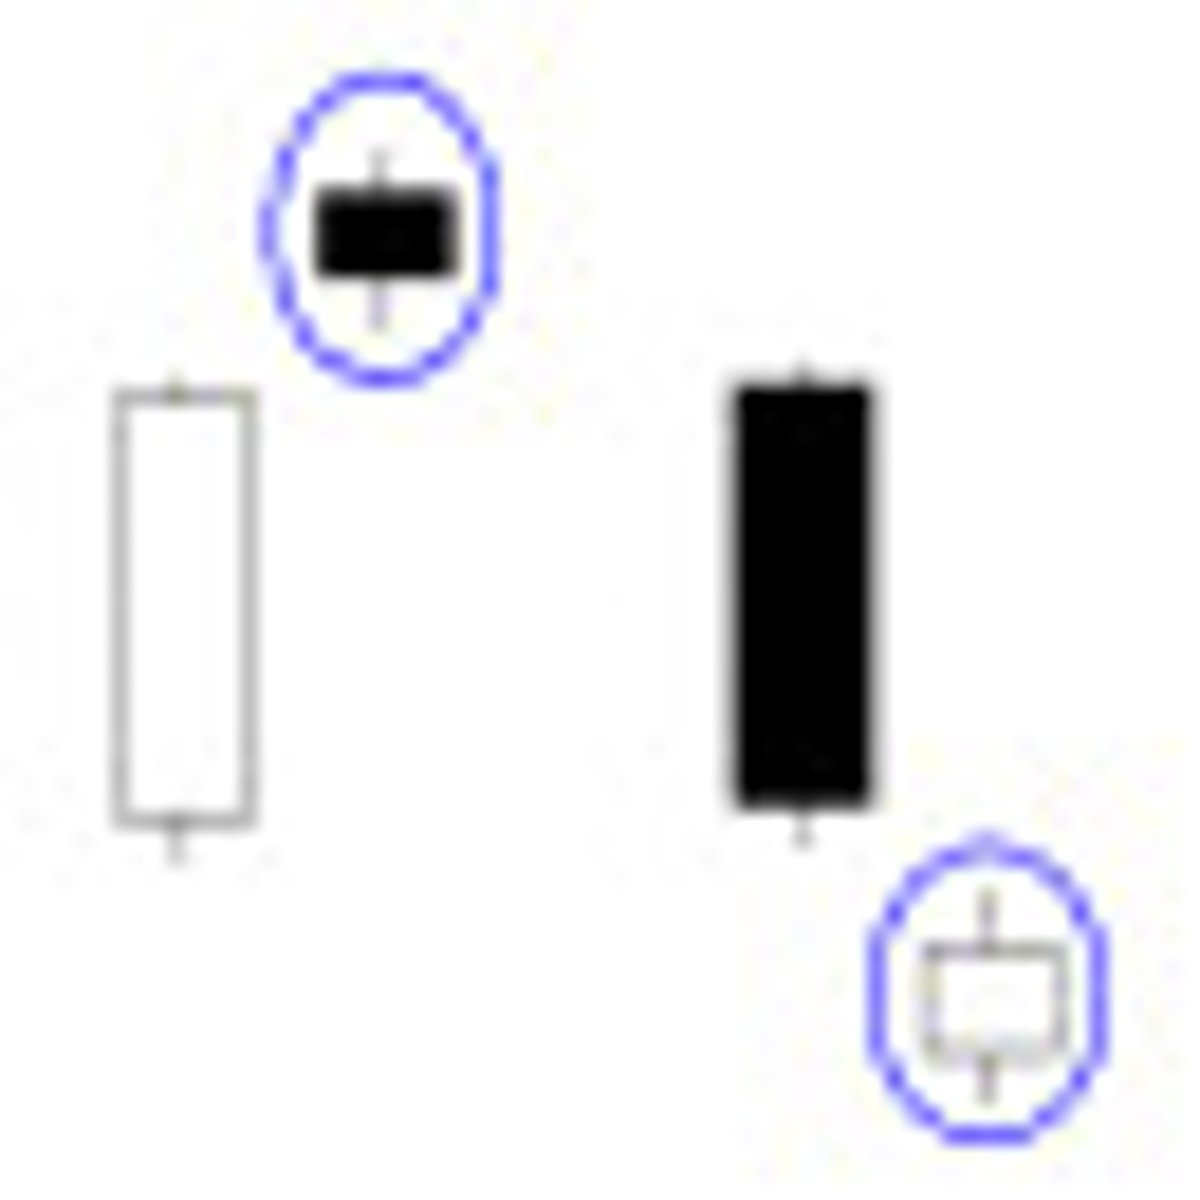
Bear Harami
Uptrend to downtrend; occurs after a large bullish candle stick meets a smaller bearish candlestick. Bulls lost control over the uptrend. Blended candle analysis; bearish + bullish = a shooting star candle stick. A resistance level is created, if tested and fails, downtrend will continue. A Doji can meet the bullish candle stick, and may begin the downtrend.
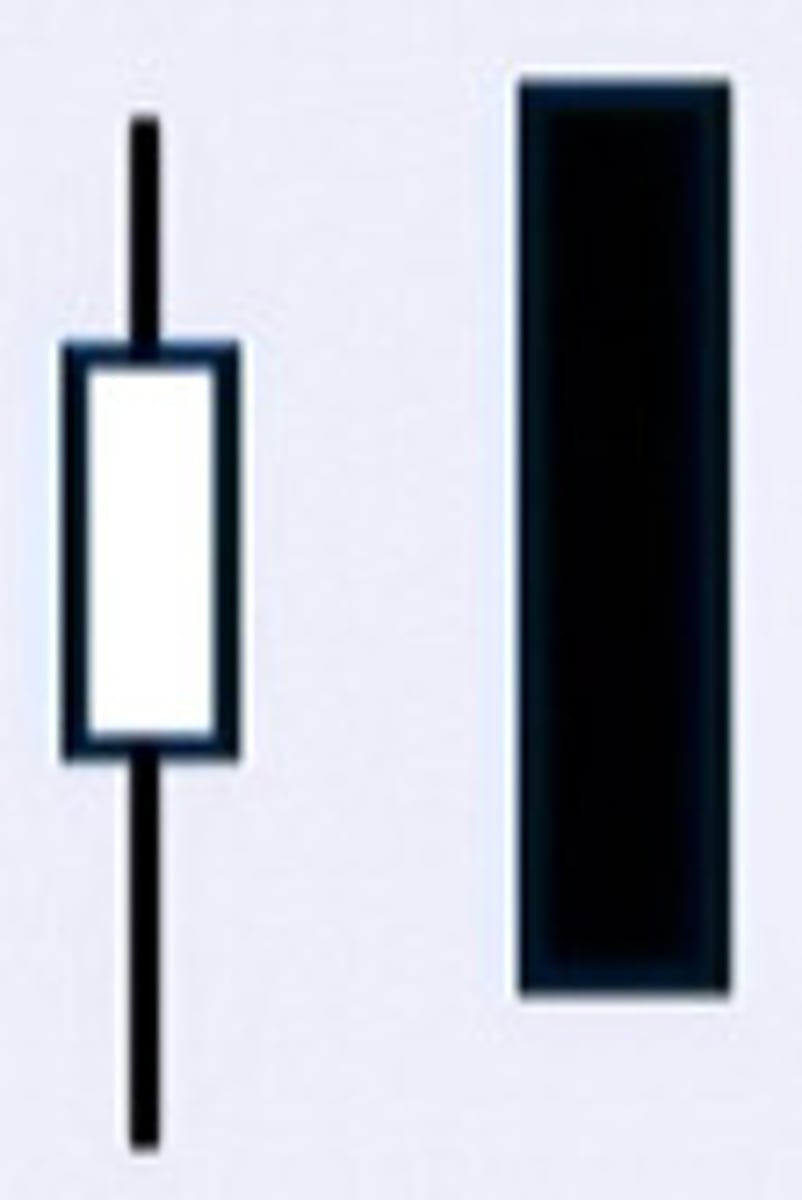
Bearish Engulfing
Uptrend to Downtrend: First day should be a bullish candle stick (or a Doji), the second day is a large real body bearish candle stick. Second day high is higher then the first day low, and lower then the first day low. Gap up is created from bulls taking control. The bears reject this and take control moving the price downwards (bullish gain is lost). Blended candle analysis; bullish candle + bearish candle = a bearish shooting star. Bearish candle stick should be on high volume.
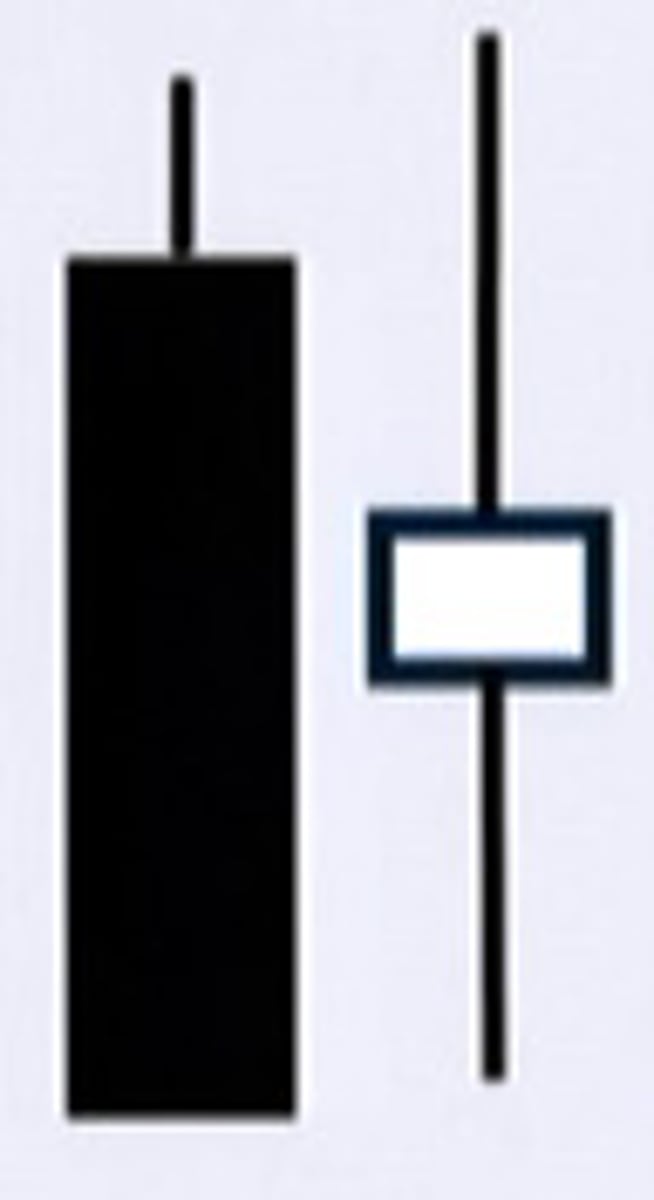
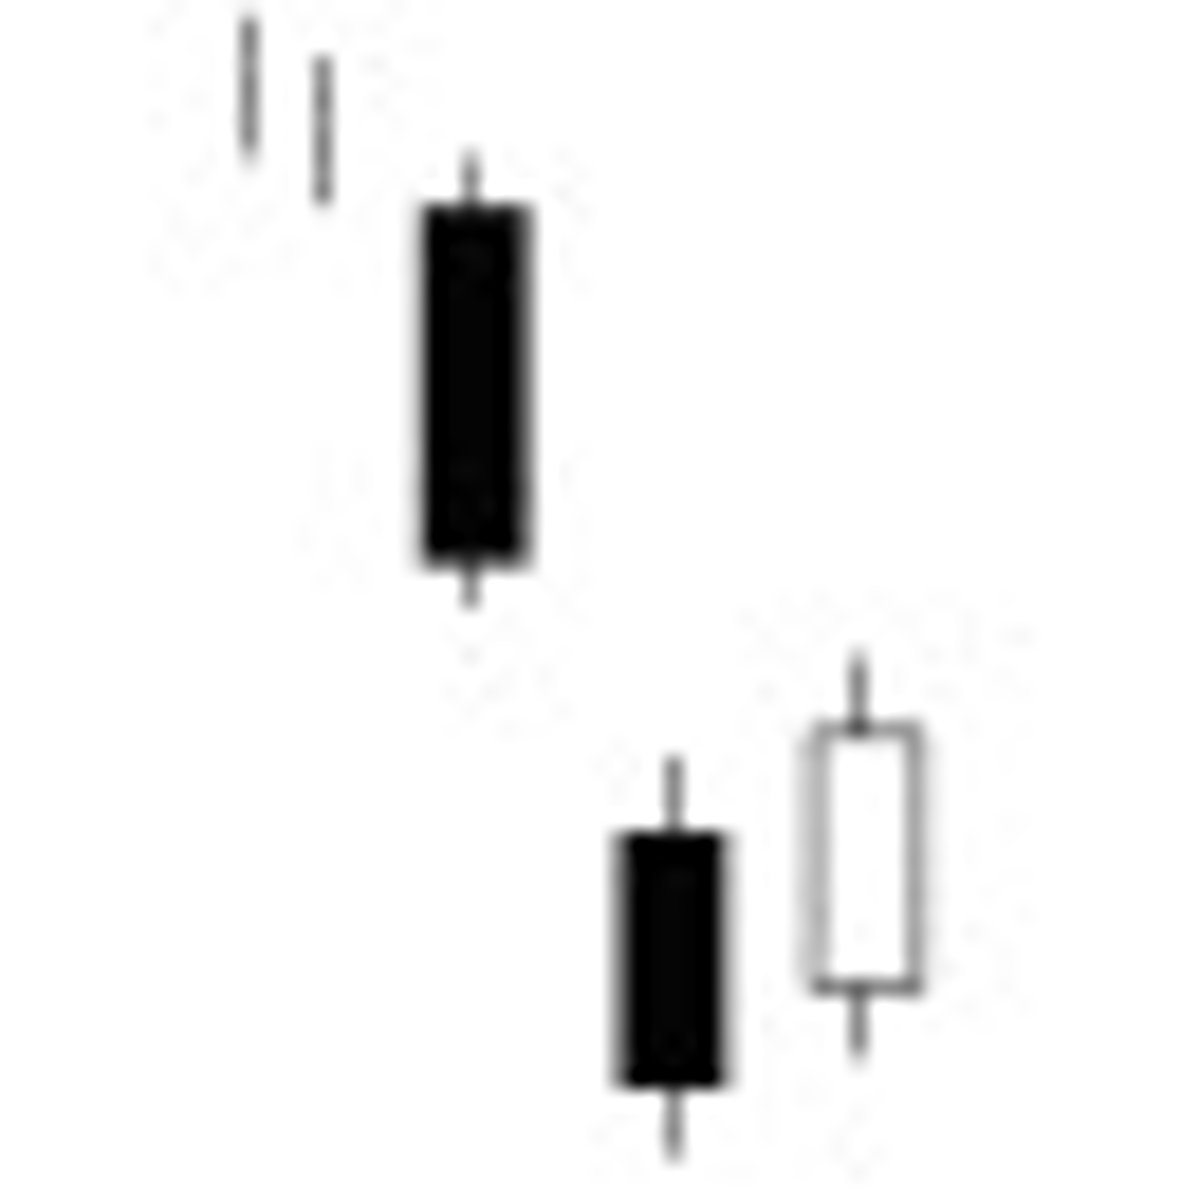
Bullish Harami
Downtrend to uptrend, or vise versa; starts with a large bullish real body, followed by a small real body or a doji. The bearish harami occurs during levels. The bullish candlestick is a reversal of the downtrend. Blended candle analysis; bearish + bullish = a hammer (smaller then both of them); is a bullish candlestick pattern, has a large low opening. The bullish hammer is were the support area will lie, prices may test the support area in further trends; prices will continue to head higher.
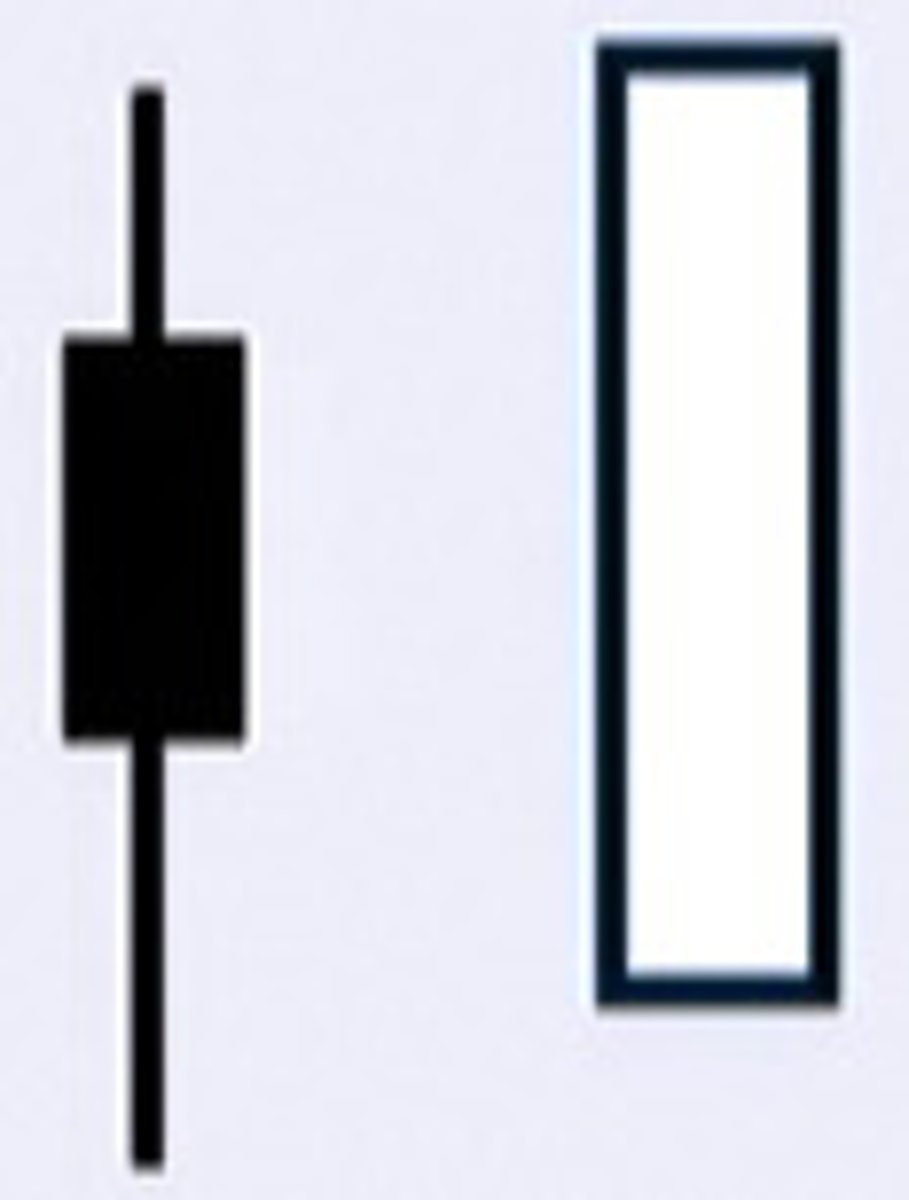
Bullish Engulfing
Downtrend to Uptrend; a medium size bearish candlestick is met by a large bullish candlestick. The second day highs are higher, and the lows are lower. Gap down is created, bulls reject bears and close higher. Blended candle analysis; bearish + bullish = a shooting star candle stick. The Bullish Engulfing pattern may create a support line for future prices. High volume should confirm the second day bullish candlestick.
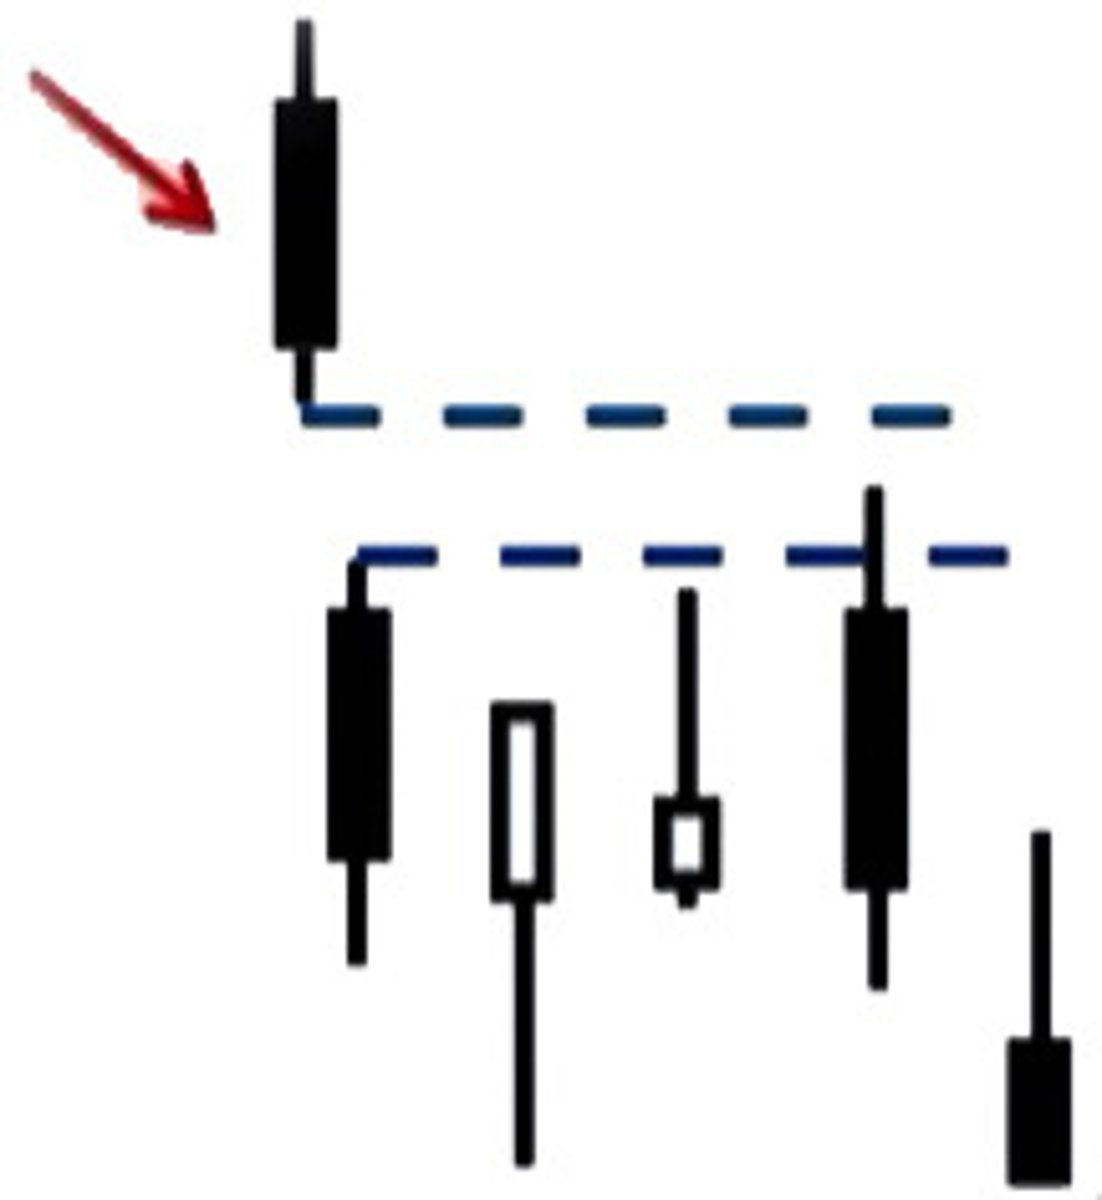
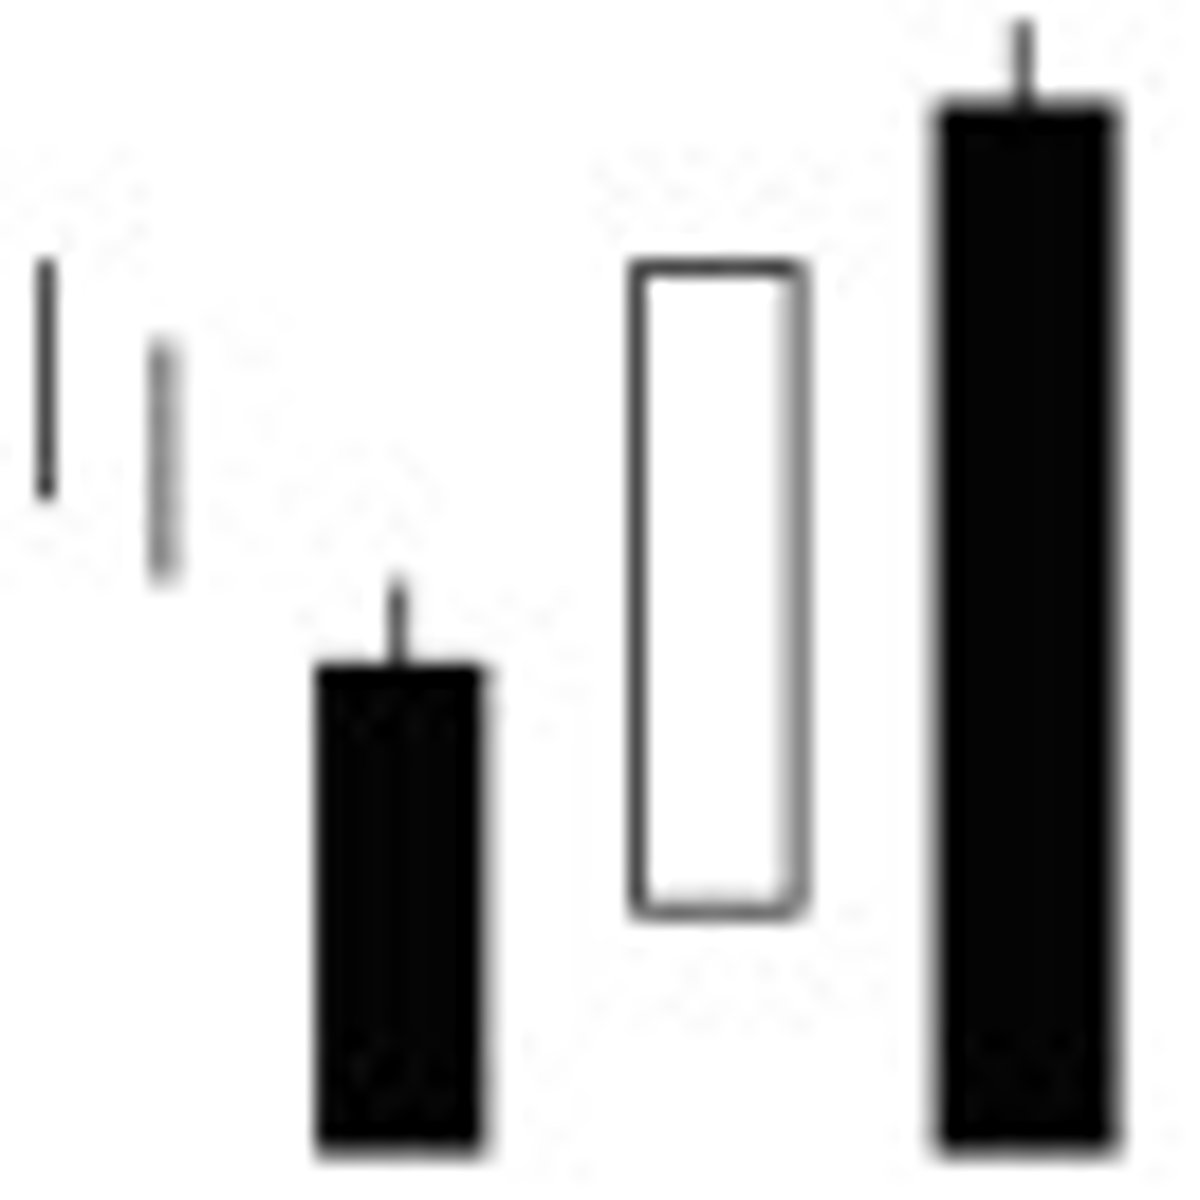
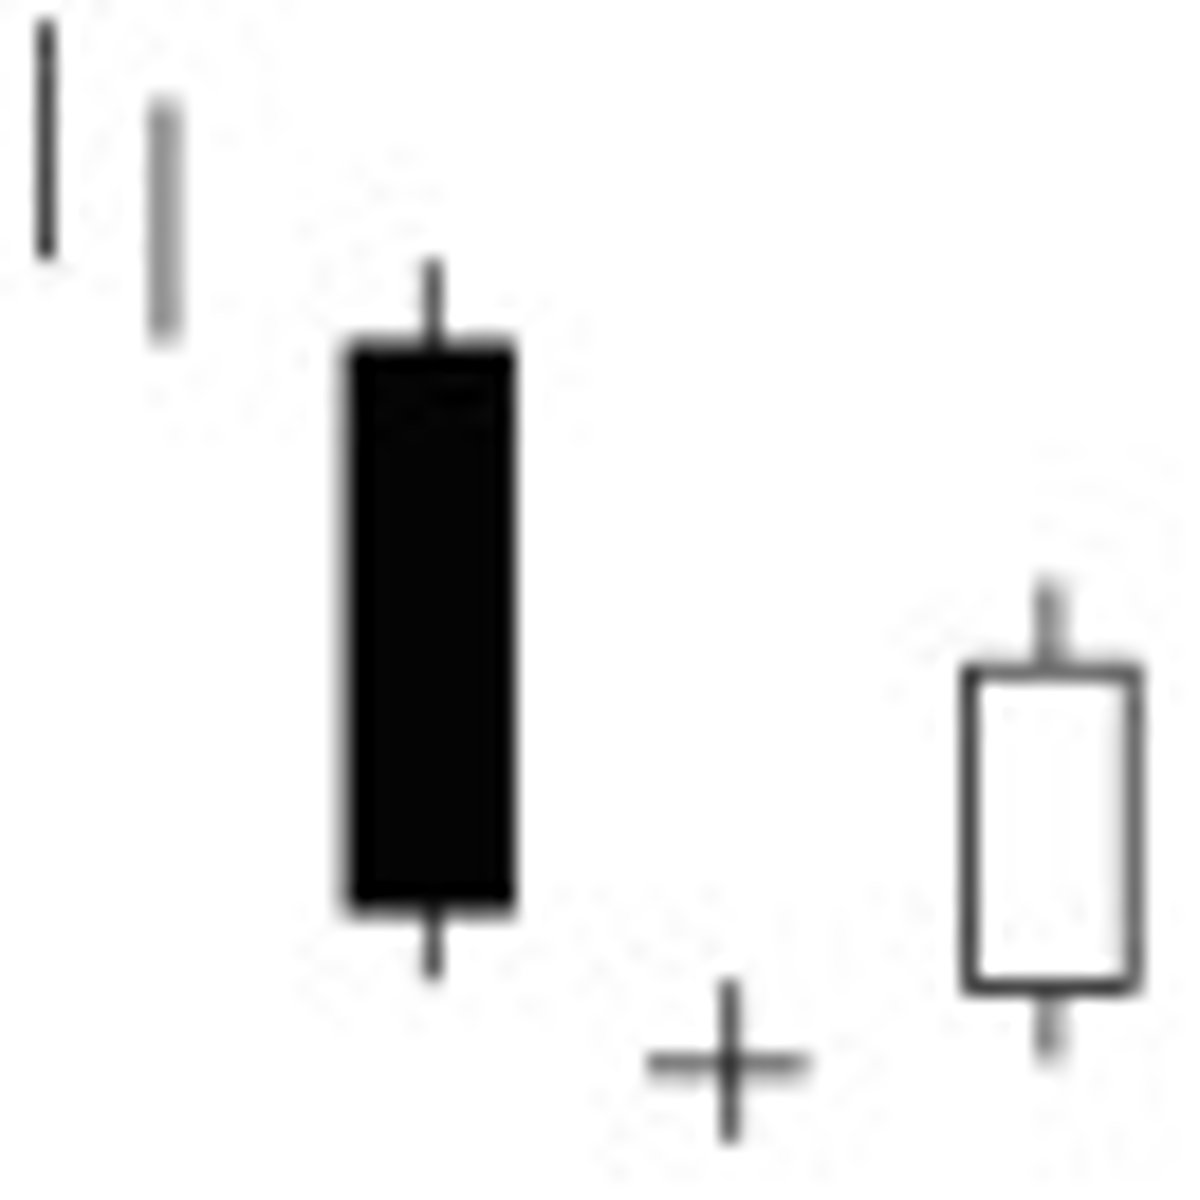
Dark Cloud Cover
This pattern creates a mid term resistance level (25 days). First day is a large bullish candlestick real body. The second day is a large bearish real body; the bearish candlestick must close within 50% of the first day bullish candlestick (this may suggest a downtrend). If the bearish candle stick closes at the lowest point, then this will be apart of a bearish engulfing pattern. Blended candle analysis; bearish + bullish = a hammer (smaller then both of them, high shooting star). The second resistance test will come from a large bearish candle stick; prices will then fall further down (did not break resistance level).
Piercing Pattern
Two day Downtrend to uptrend; first day has a large bearish candlestick. The second day a bullish candlestick opens lower but continues to fight upwards, the bullish high is still lower then the bearish high. The higher the counter incline of the second candlestick, the stronger the pattern is. Blended candle analysis; day 1 plus day 2 equals a hammer candle stick. If bearish pattern following a second day bullish candlestick, then bearish hammer will follow. Draw resistance line for a bearish reversal (downtrend), draw support for a bullish reversal (uptrend). Three major characteristics; the greater the second day's bullish candlestick the stronger the pattern, the failure to penetrate support by the bears at the end of the day, and high volume accompanies the second day bullish candlestick; many traders are short and want to cover their position before a bullish uptrend.
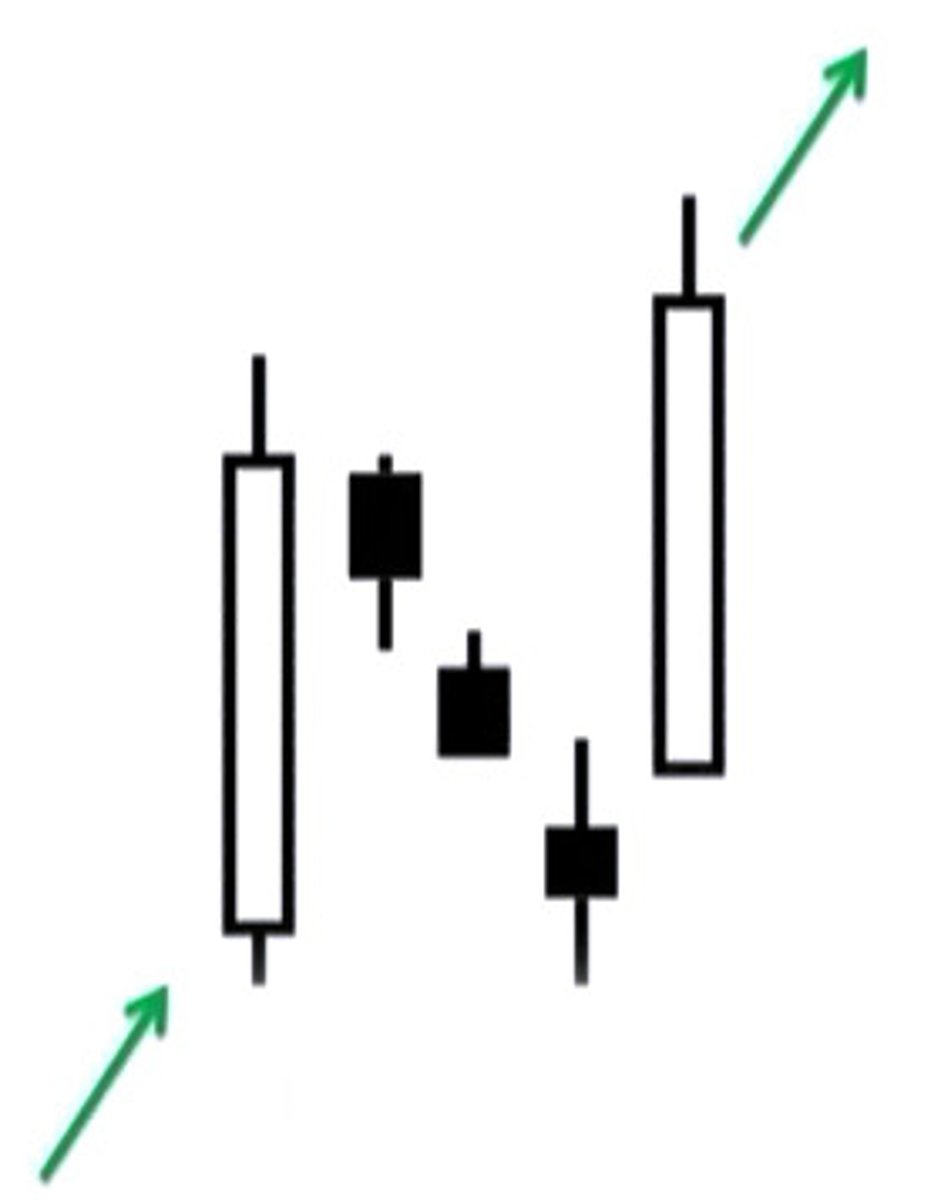
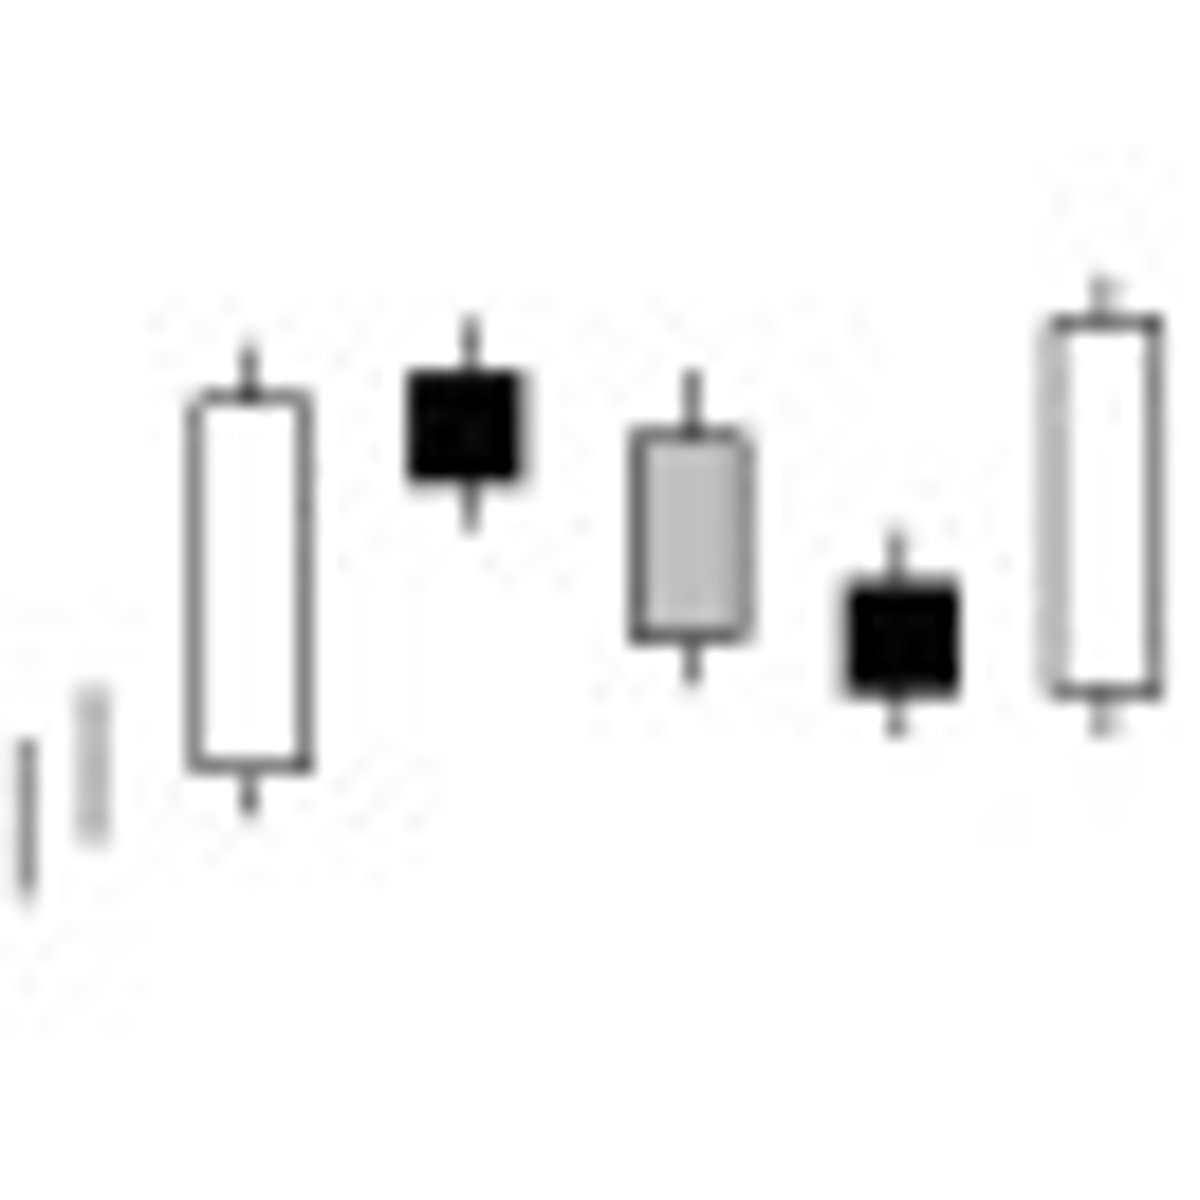
Rising Three Methods
Uptrend to uptrend; A large bullish candlestick followed by three smaller bearish candlesticks. followed by another even bullish candlestick that has higher highs and the same lows and the first days higher high. Falling three methods (bearish) has the same pattern. Starts with a large bearish candlestick, followed by three small bullish candlestick, followed by another large bearish candlestick with lower lows, and same highs as the first days bearish candlestick. Draw support at the first bullish candlestick. Draw resistance at the first bearish candlestick. Volume on the first day is increased, while volume for days 2 and 3 are lower. If the pattern stays intact, volume increases on the 4th day.
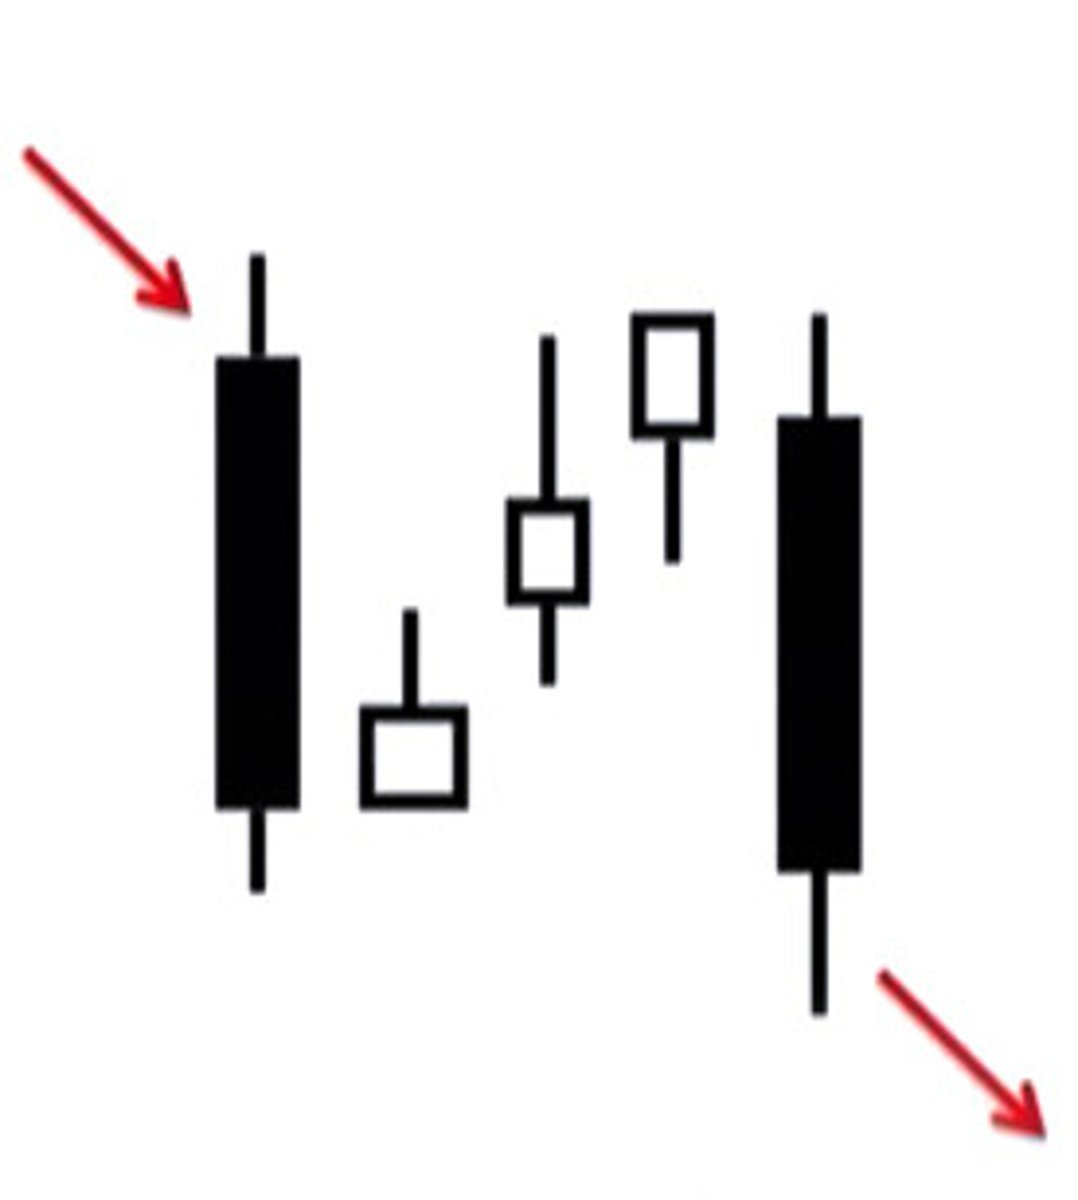
Falling Three Methods
Falling three methods (bearish) has the same pattern. Starts with a large bearish candlestick, followed by three small bullish candlestick, followed by another large bearish candlestick with lower lows, and same highs as the first days bearish candlestick. Draw support at the first bullish candlestick. Draw resistance at the first bearish candlestick. Volume on the first day is increased, while volume for days 2 and 3 are lower. If the pattern stays intact, volume increases on the 4th day.
Rising Window
Windows are continuation candlestick patterns. When the market opens a window to the upside, it is a rising window. It is a bullish candlestick pattern and the rising window should be support.
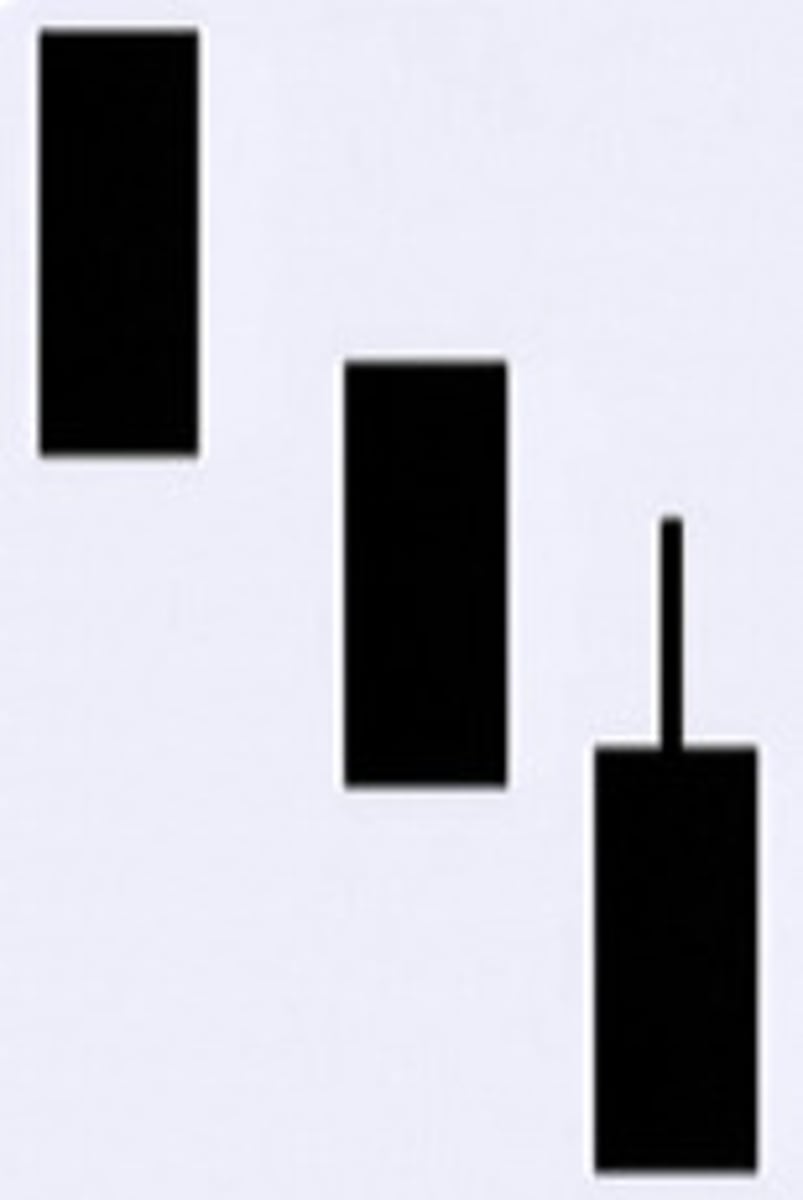
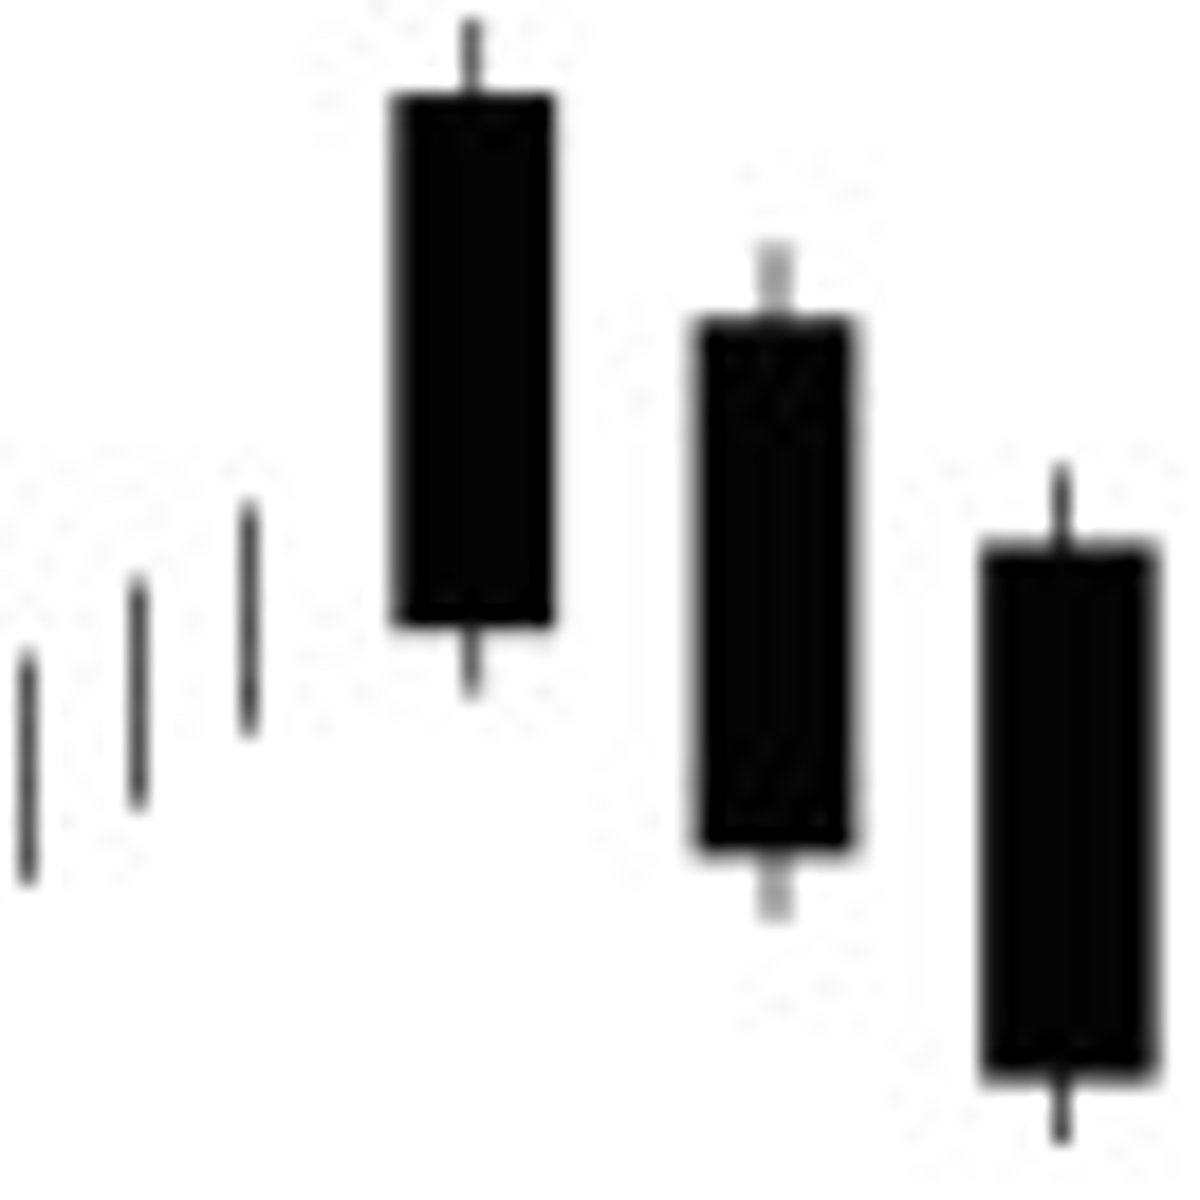
Three Black Crows
Uptrend to downtrend; three bearish candlestick will create lower highs and lower lows. This will suggest the continuation of the downtrend. Resistance level starts at the first bearish candlestick.
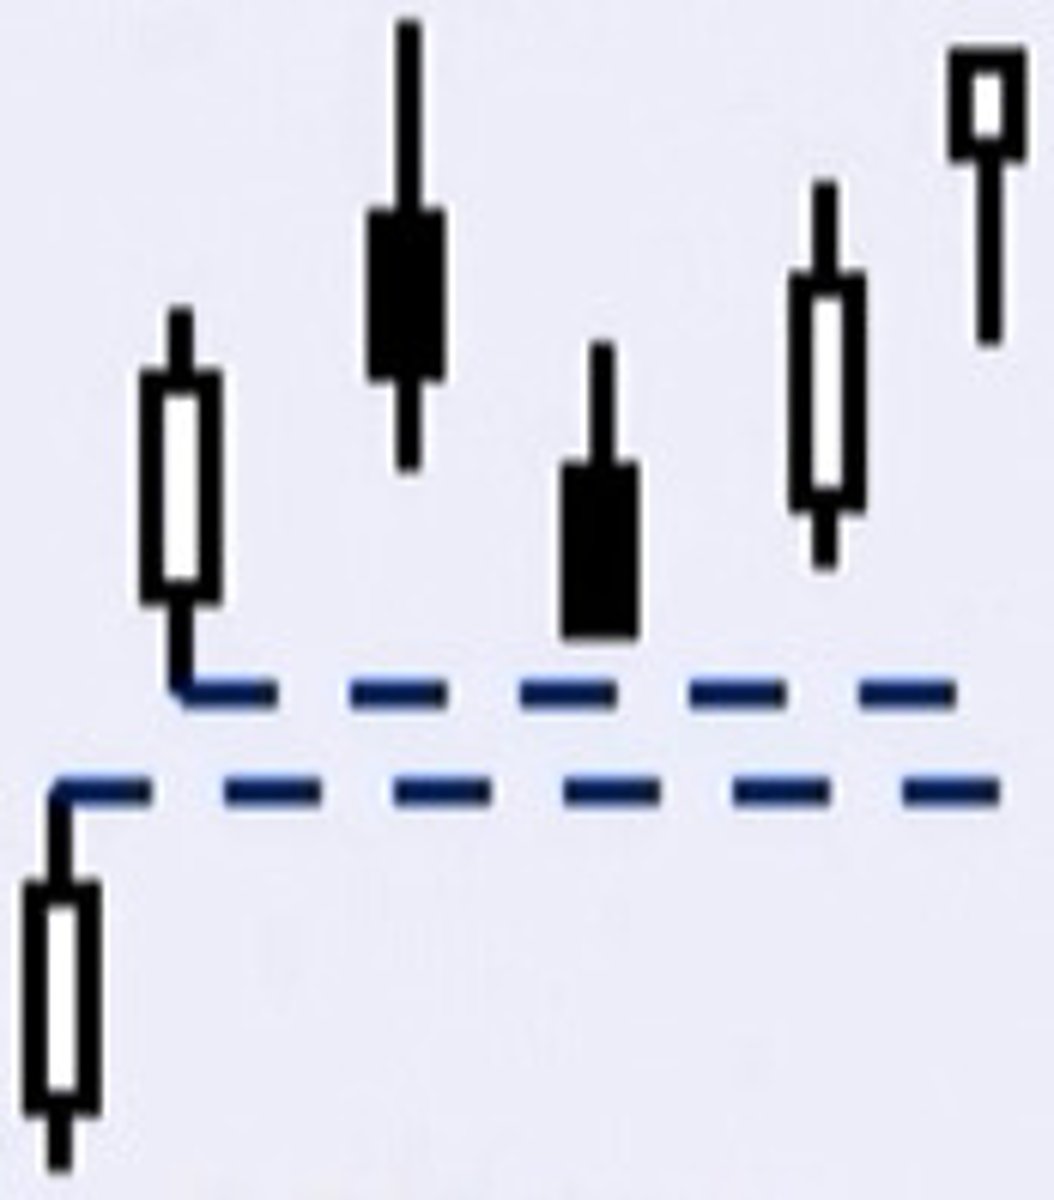
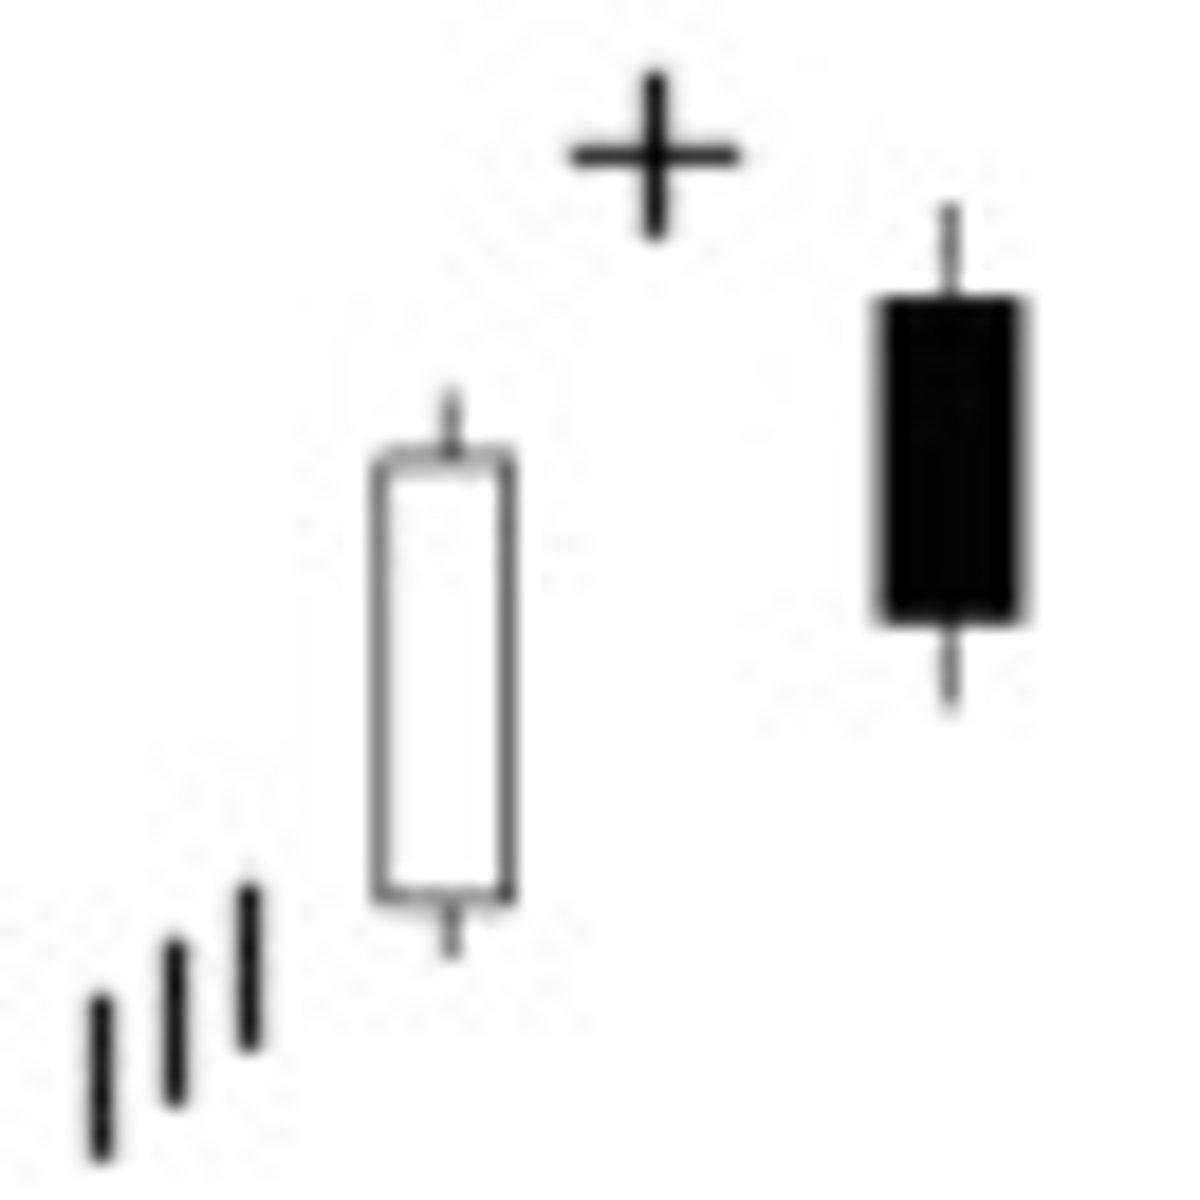
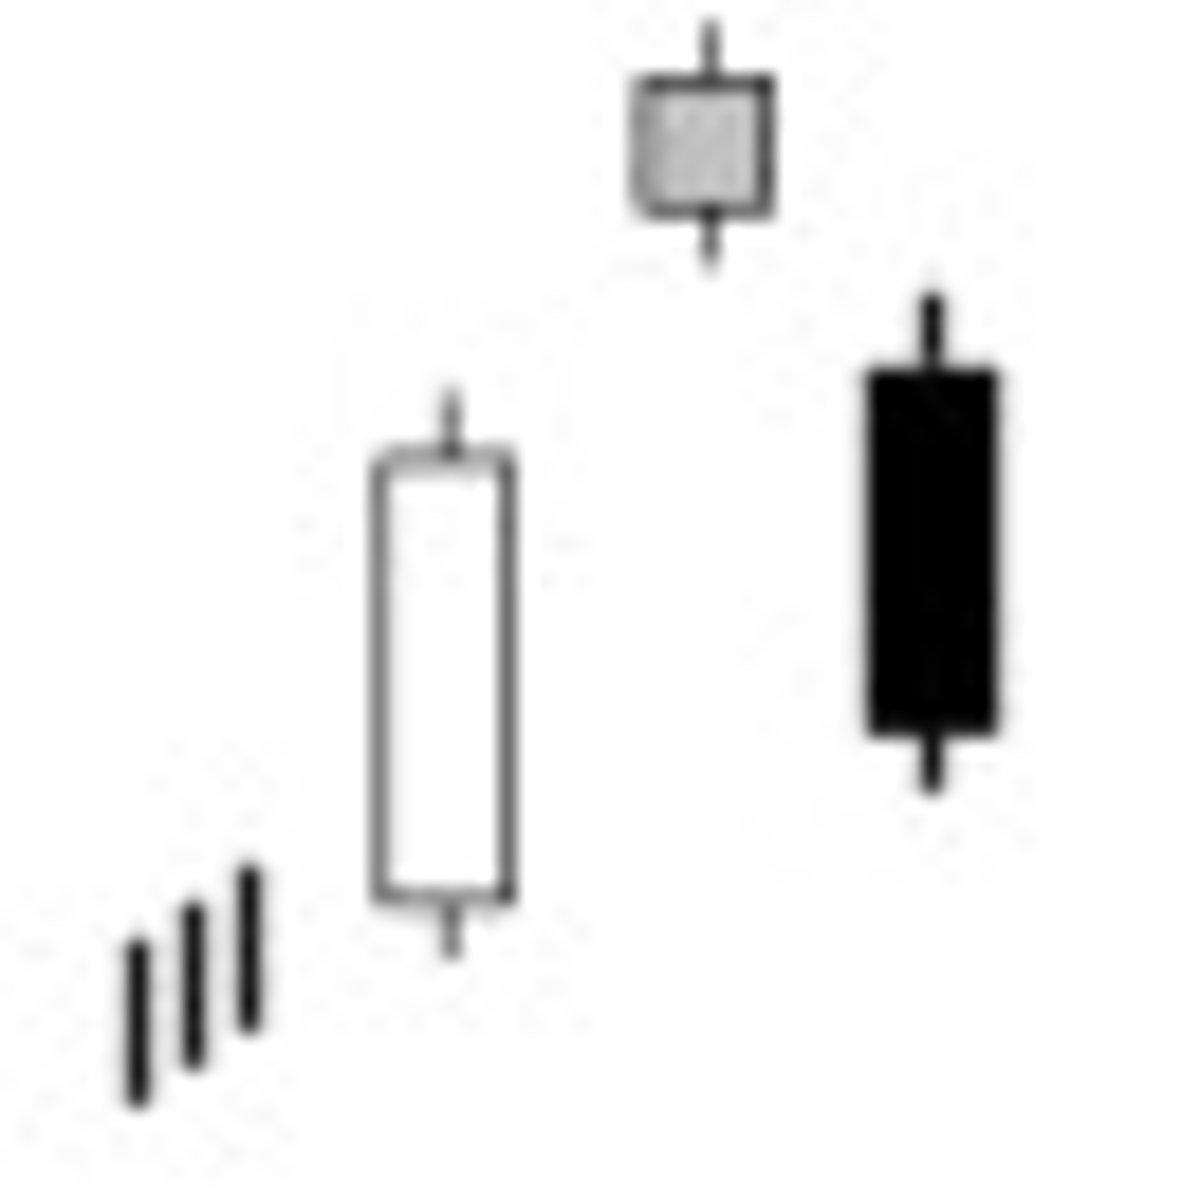
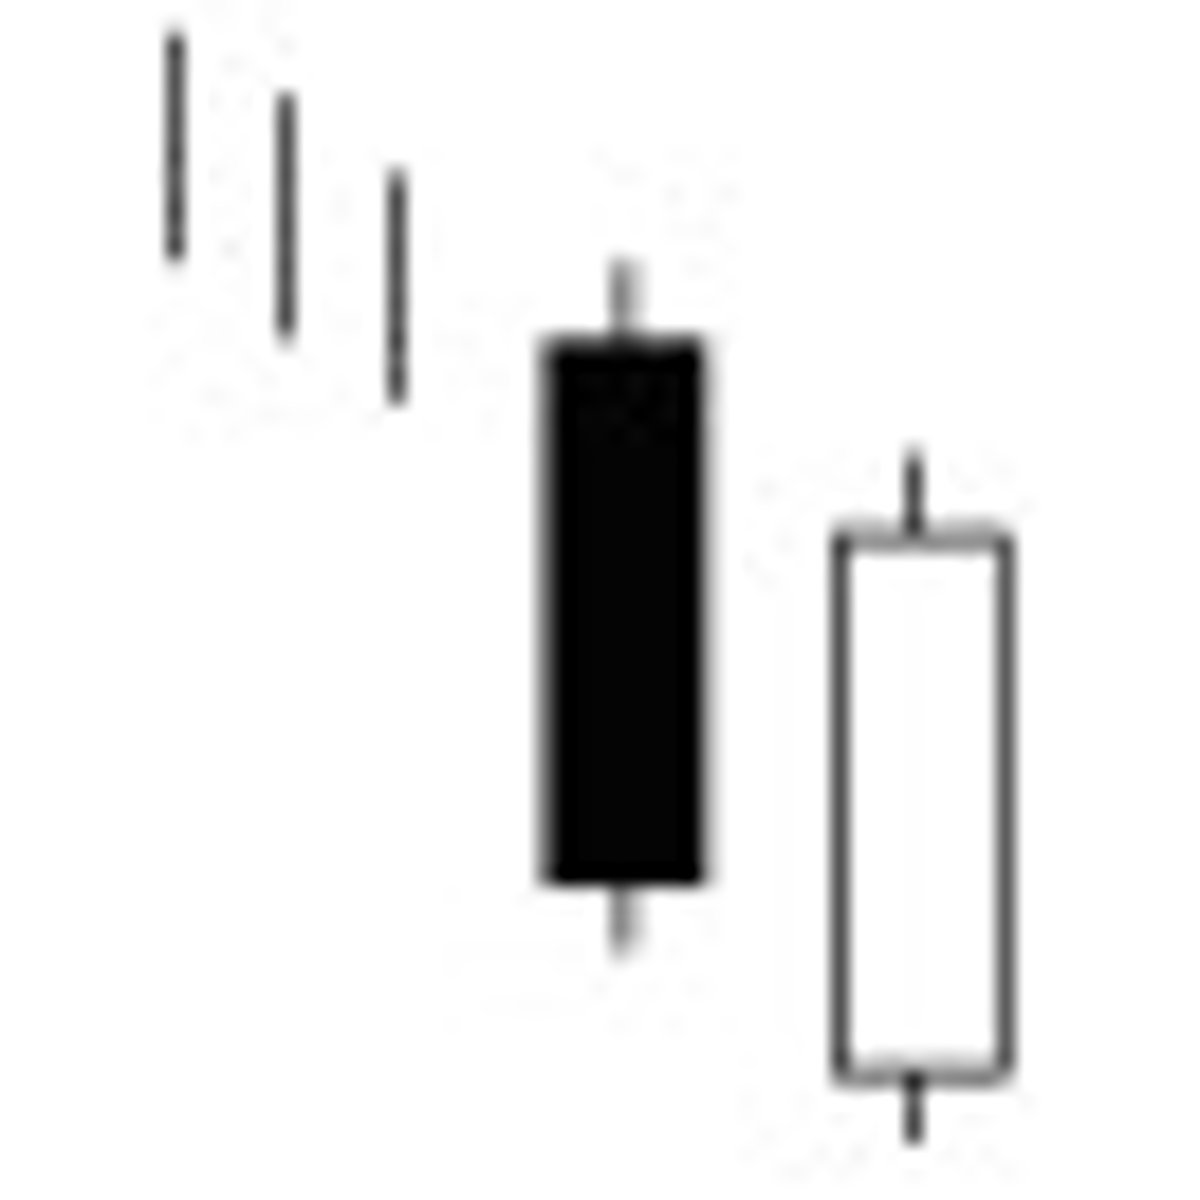
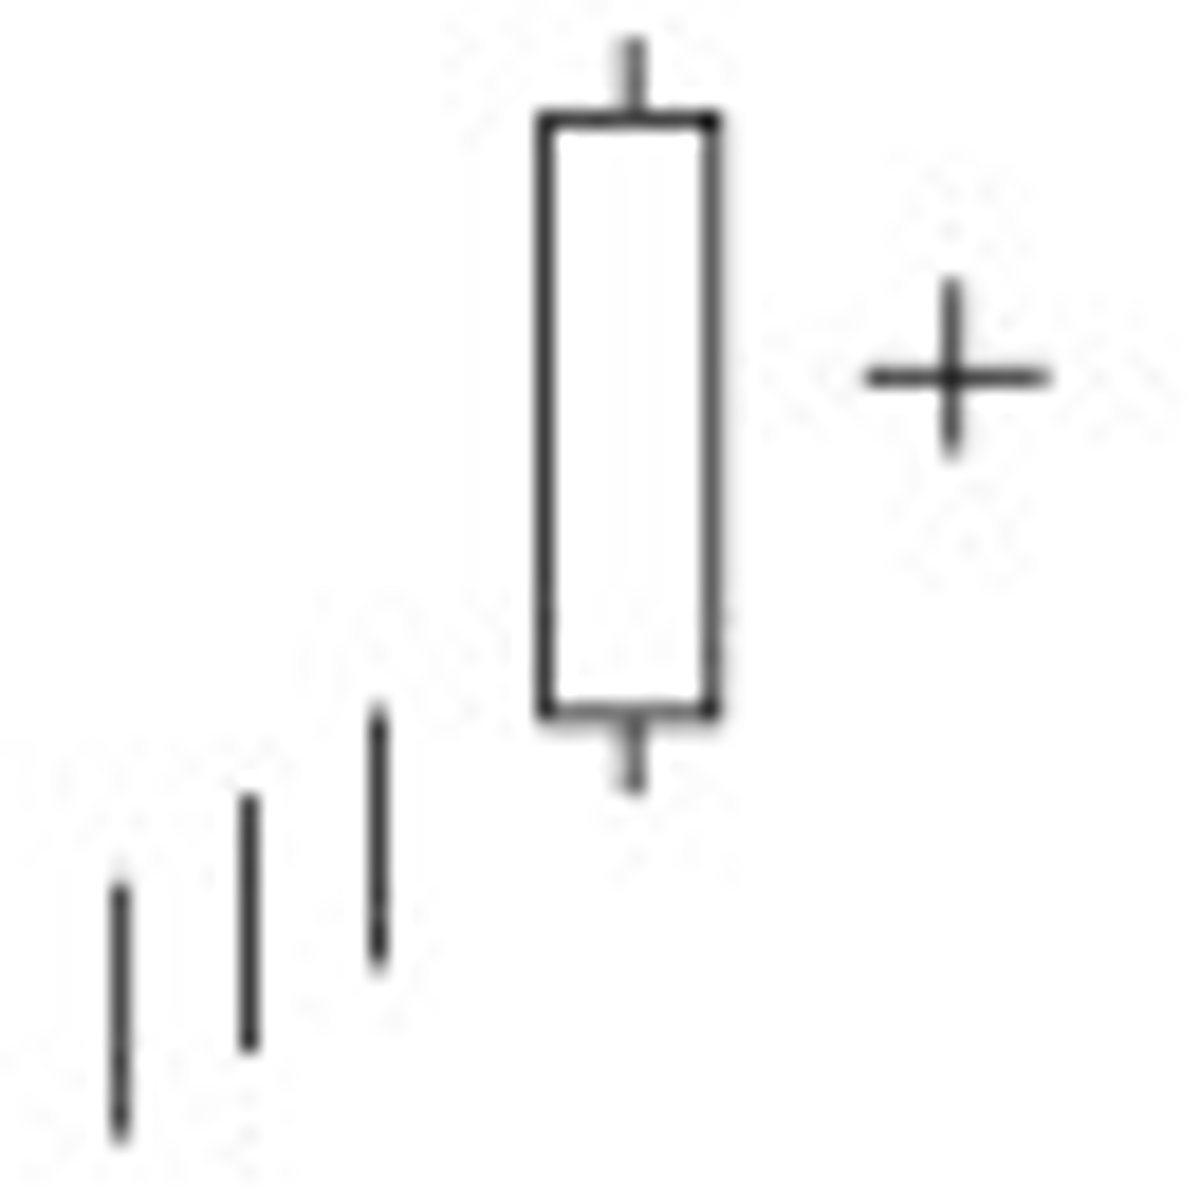
Evening Star
The Evening Star Pattern is viewed as a bearish reversal pattern, that usually occurs at the top of an uptrend. The pattern consists of three candlesticks:
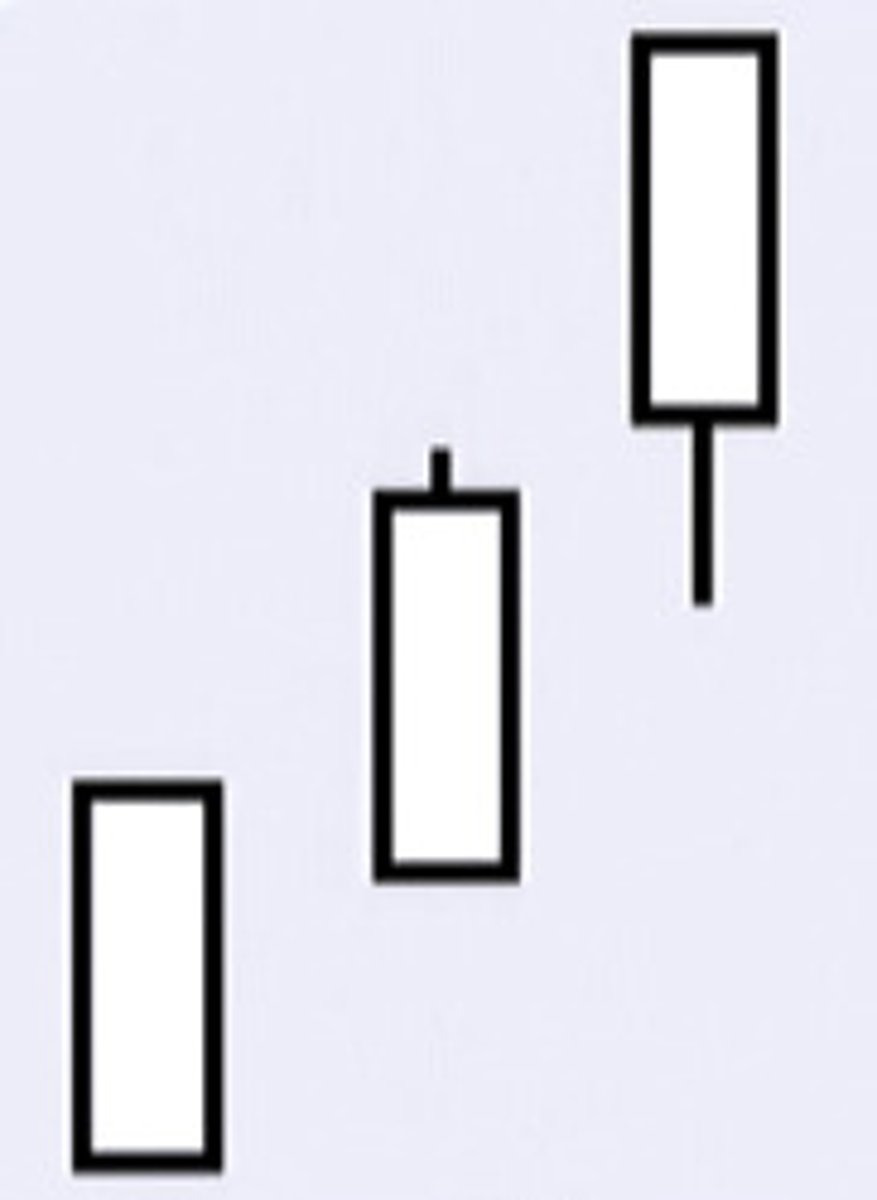
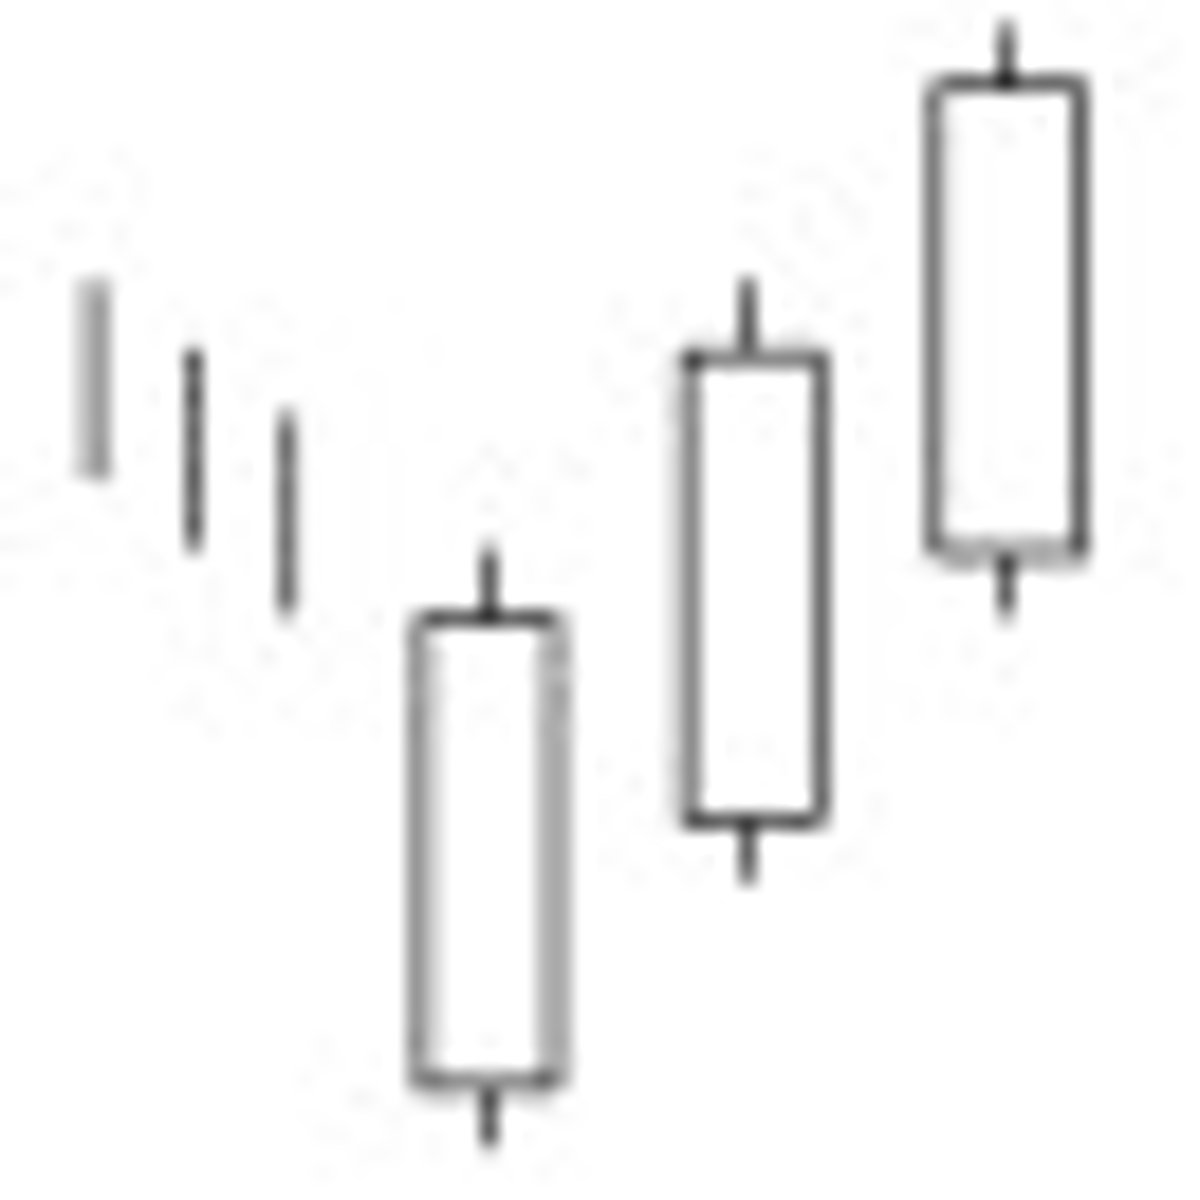
Three Advancing White Soldiers
After a downtrend; three bullish candlesticks will create higher closes. Prices should continue higher (staircase like pattern).
Falling Window
If a window opens in a selloff, it is a falling window. This is a bearish signal. The falling window is resistance.
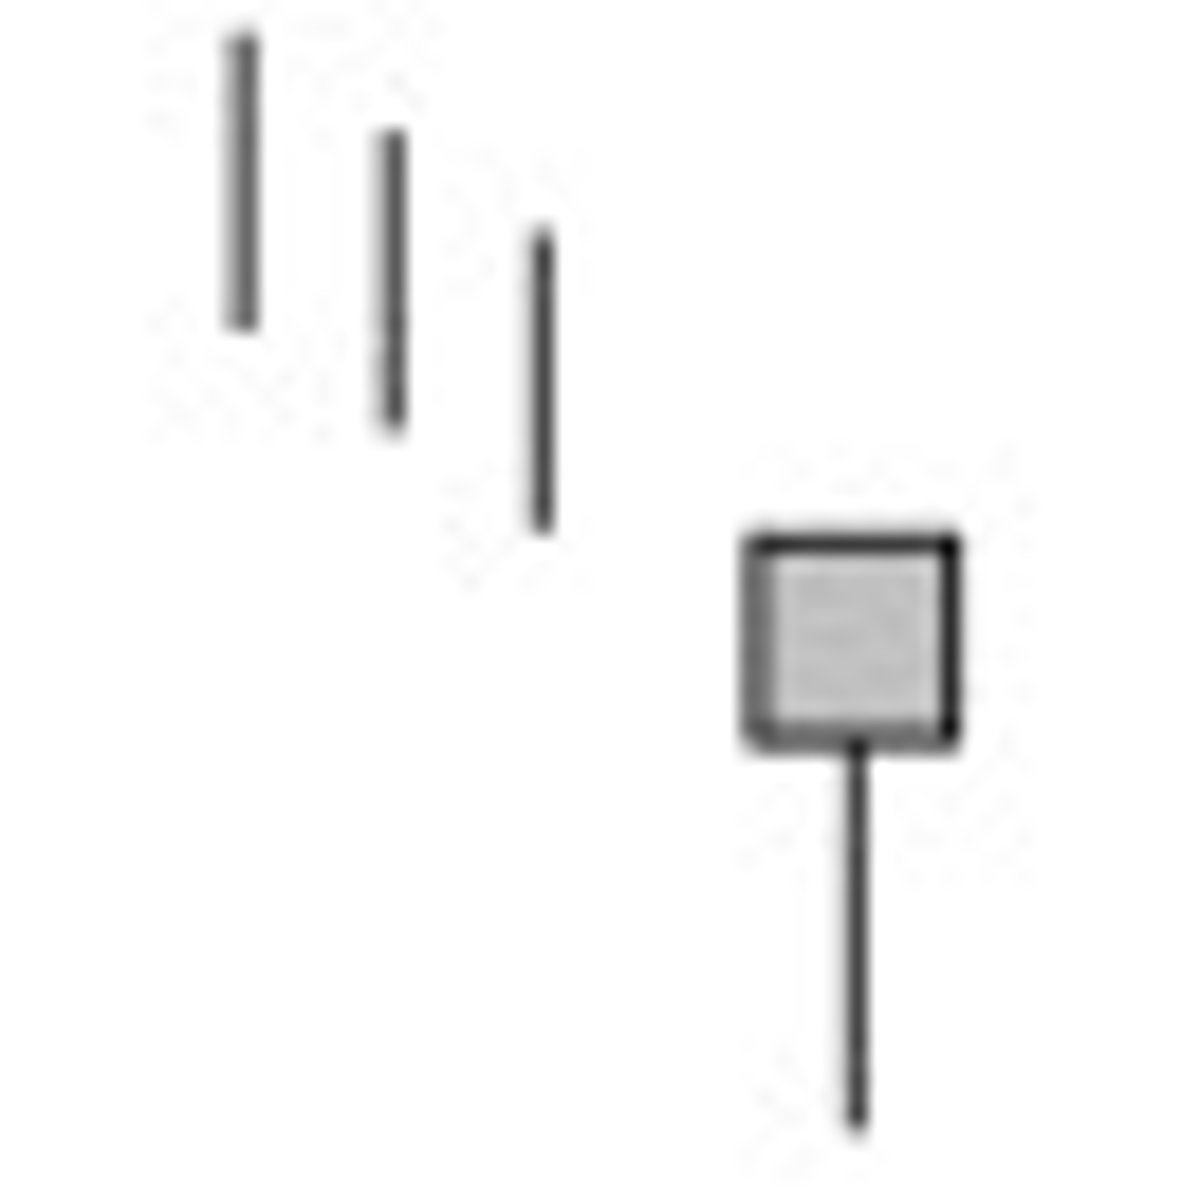
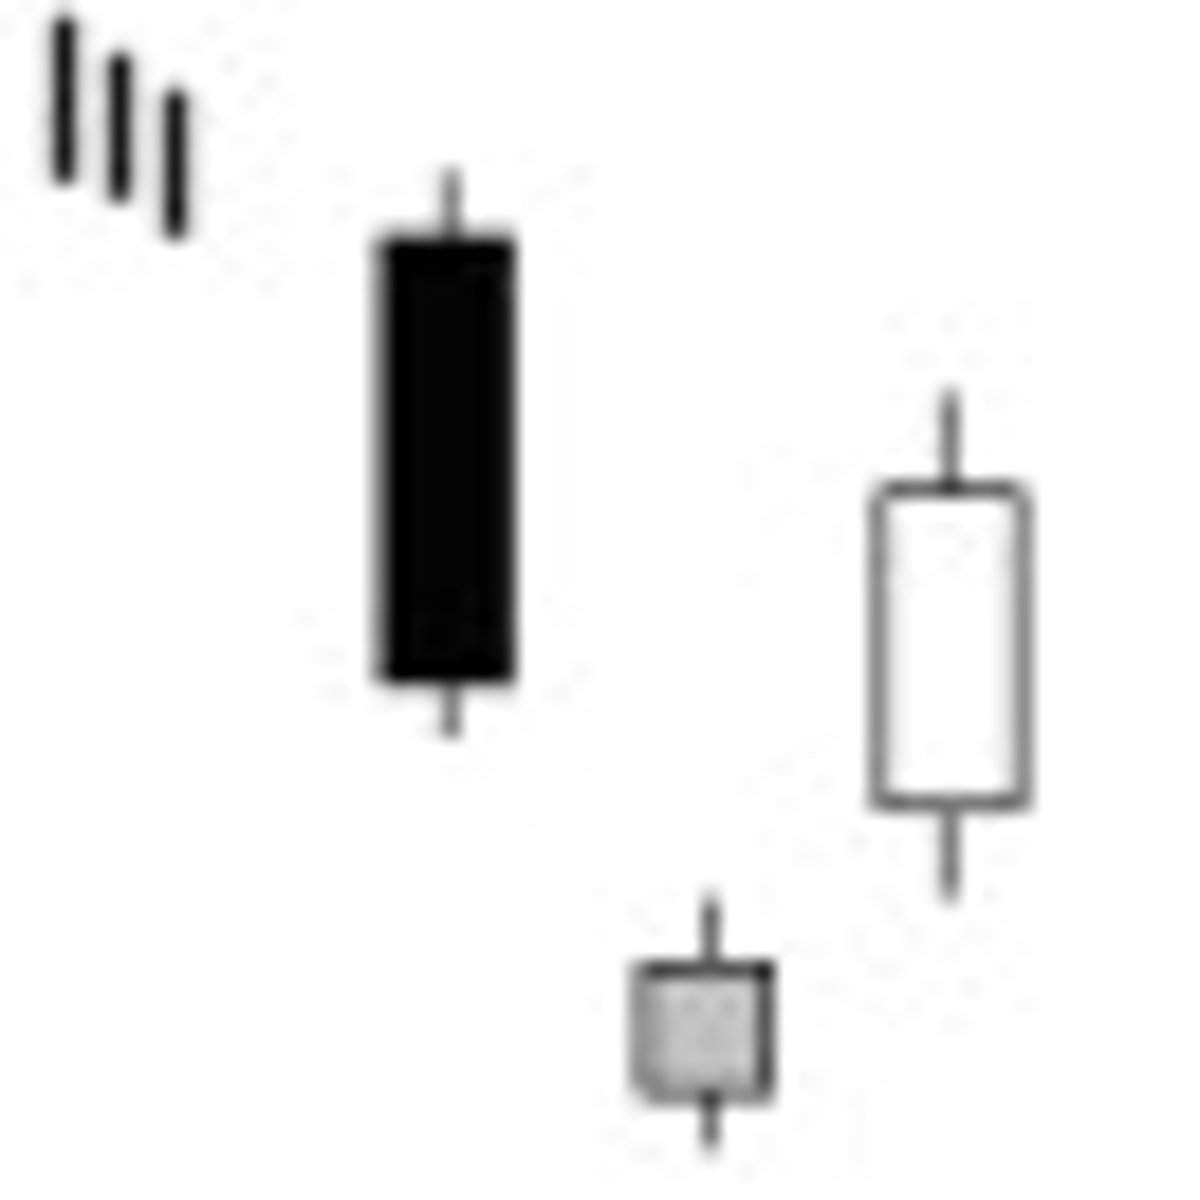
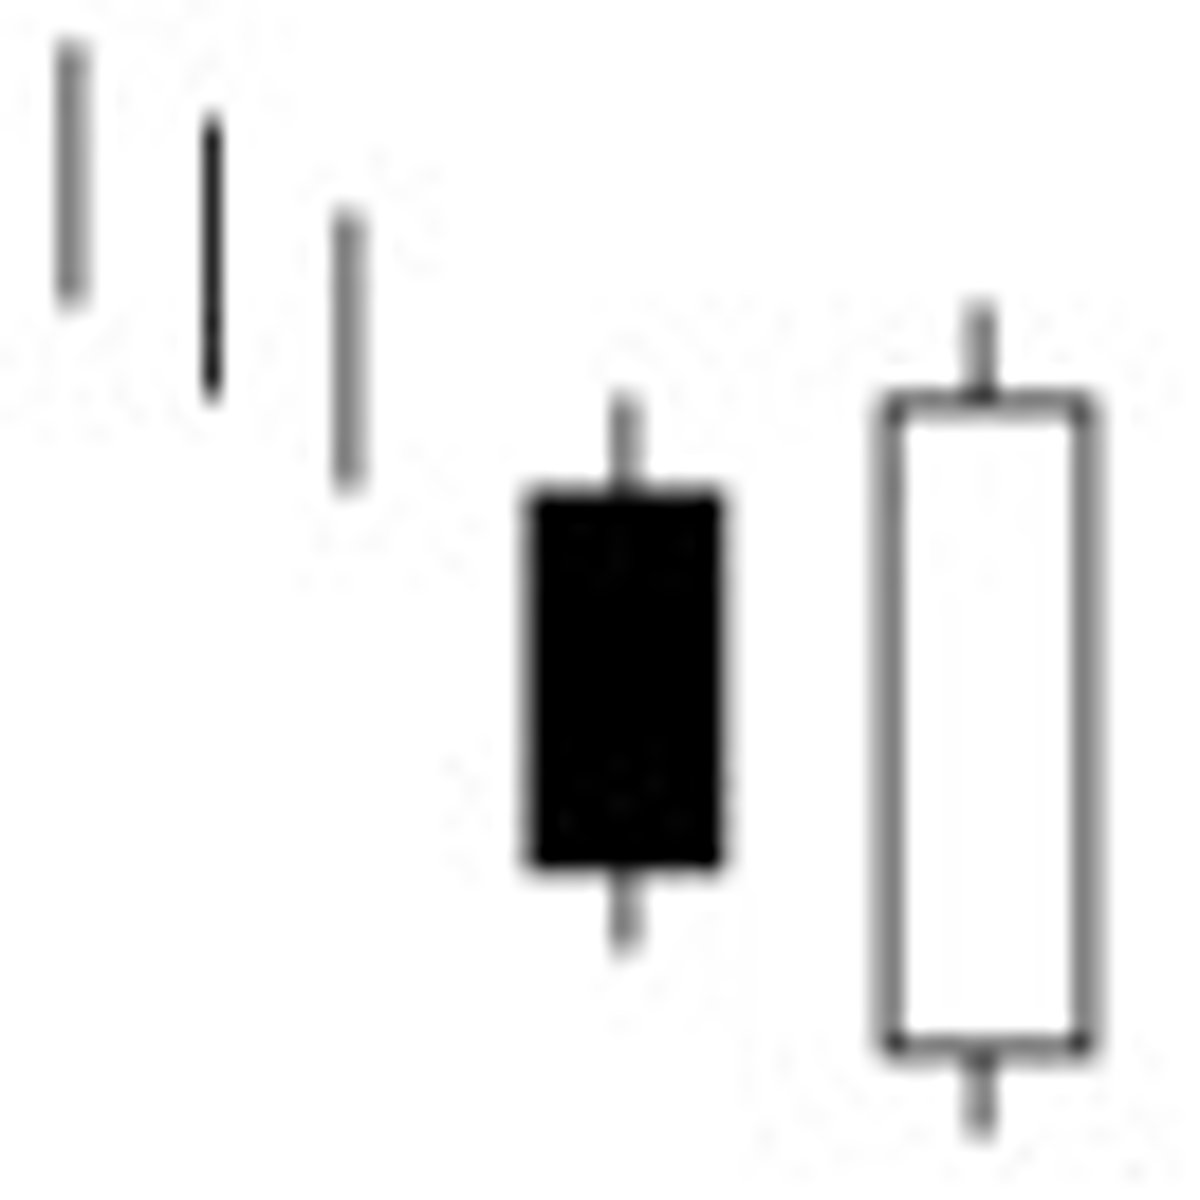
Morning Star
Downtrend to uptrend; after a downtrend a large bearish candlestick is formed, the next day a small bullish candlestick re-consolidates, and a large bullish candlestick follows, an up trend will continue. Morning Doji Star; same pattern but the second day is followed with a doji (this proves further consideration). Abandoned Baby Bottom has a long bearish candlestick, a gap down, bullish doji, a gap up, and a long bullish real body (from a downtrend to an uptrend). Bulls are able to begin an uptrend from a bearish reconciliation period. Three attributes, volume on a third days candle stick should be higher then the previous 2 day's volume.
A morning star pattern can be useful in determining trend changes, particularly when used in conjunction with other technical indicators. Many traders also use price oscillators such as the MACD and RSI to confirm the reversal.
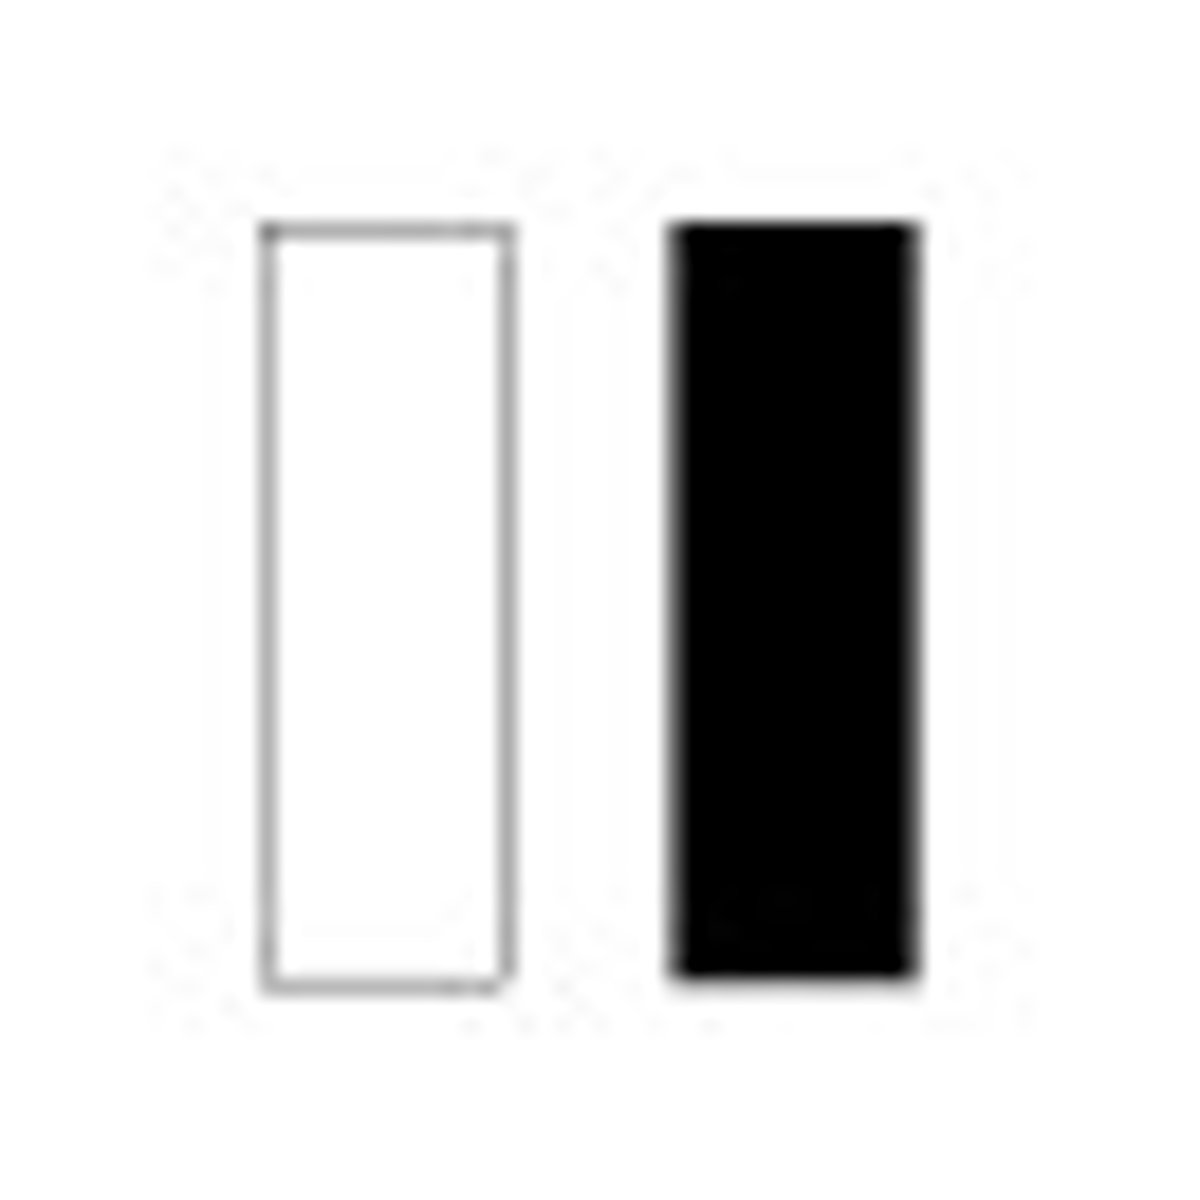
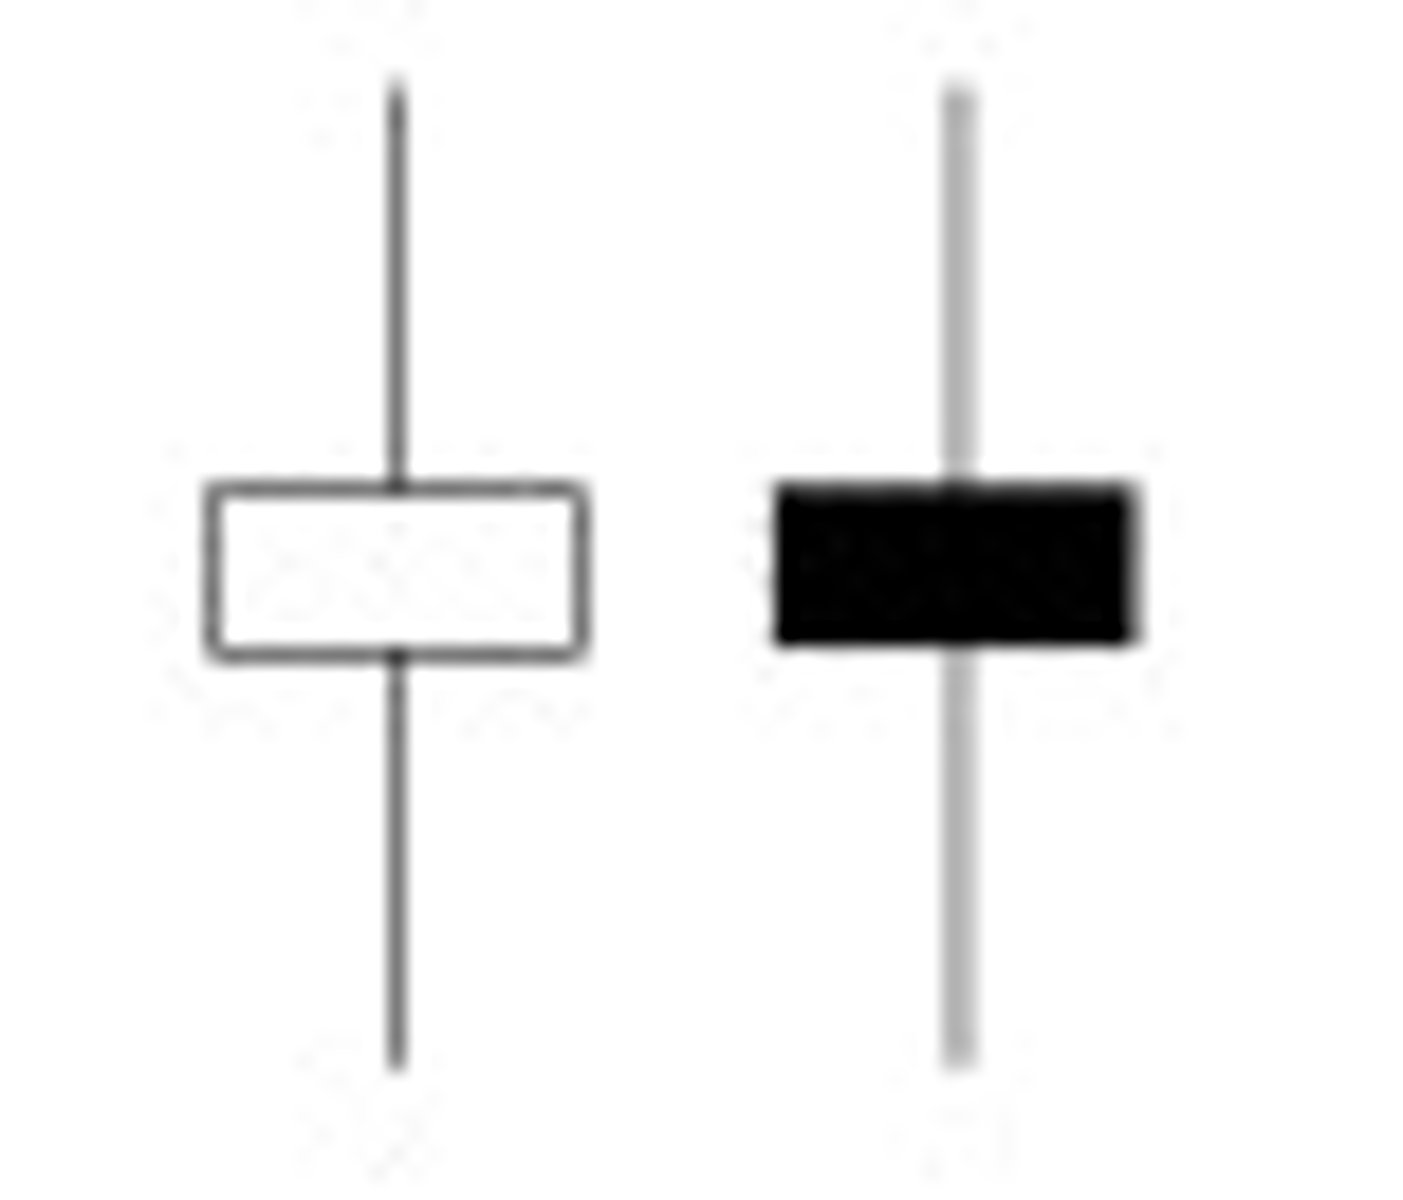
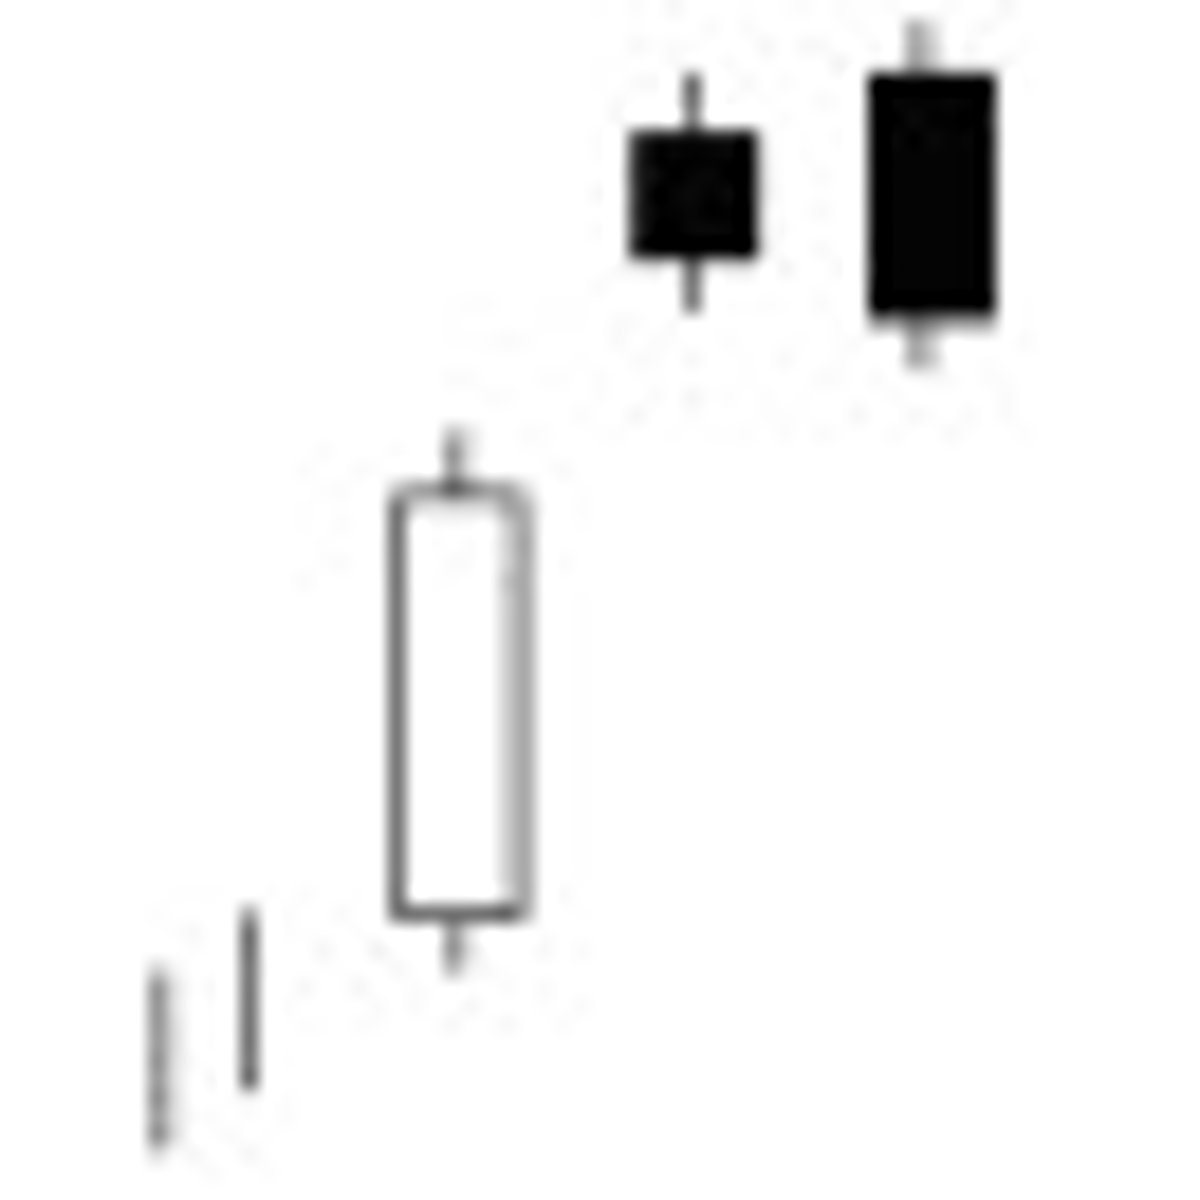
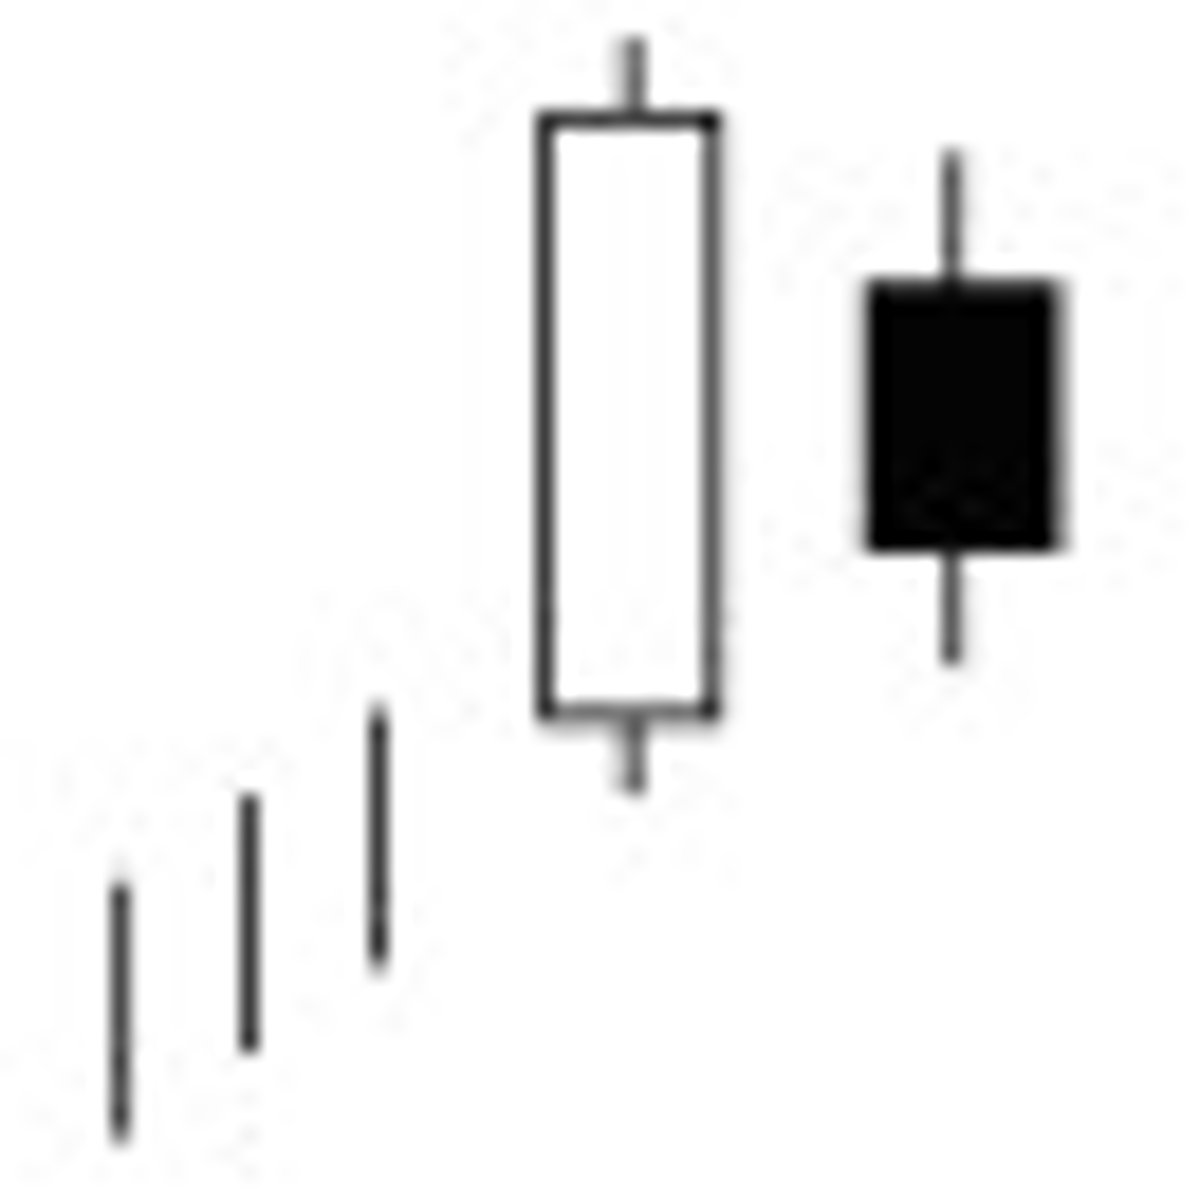
Bearish Counter Attack line
The Bearish Counterattack Line is composed of two Japanese candlesticks of opposite colour that have the same closing price.
It is a not-so-powerful reversal pattern that is significant over all time units.
Its characteristics are as follows:
The Bearish Counterattack Line must appear after an uptrend.
The body of the 1st candlestick is green and preferably powerful.
The 2nd candlestick must be red; it should preferably open gap up and close at almost the same level as it did the day before.
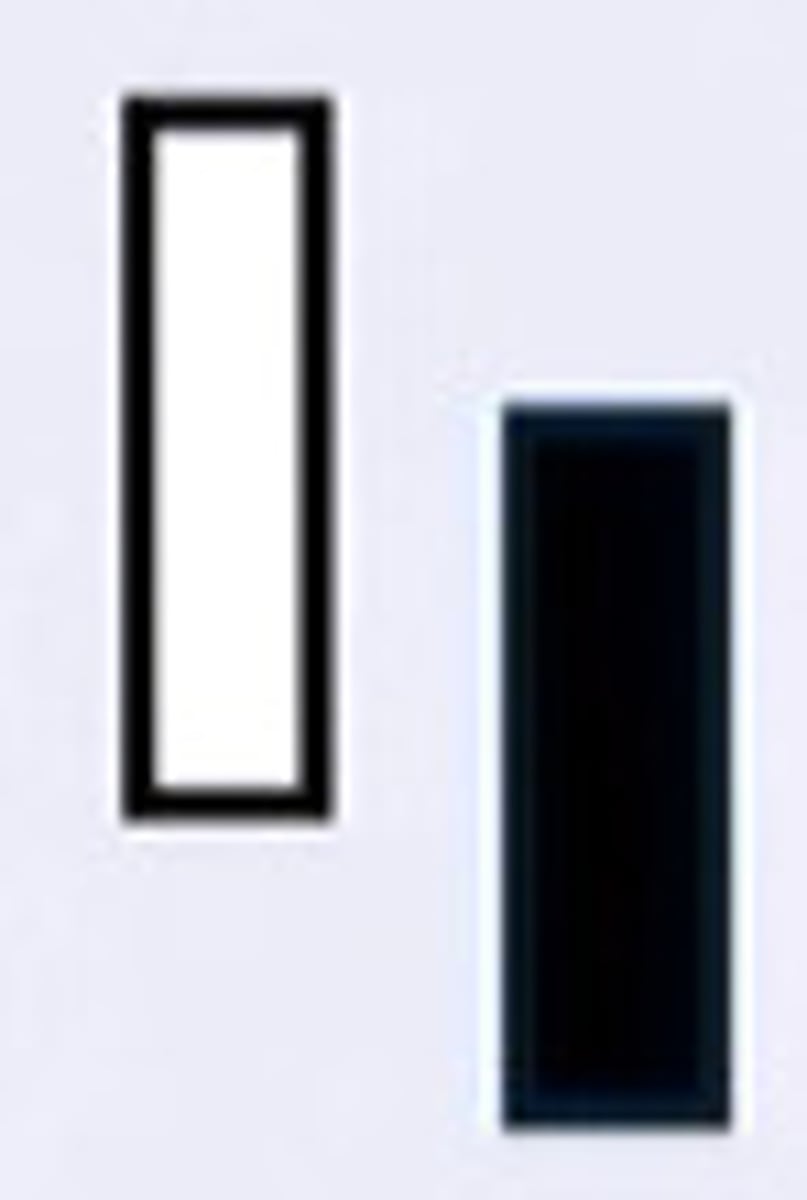
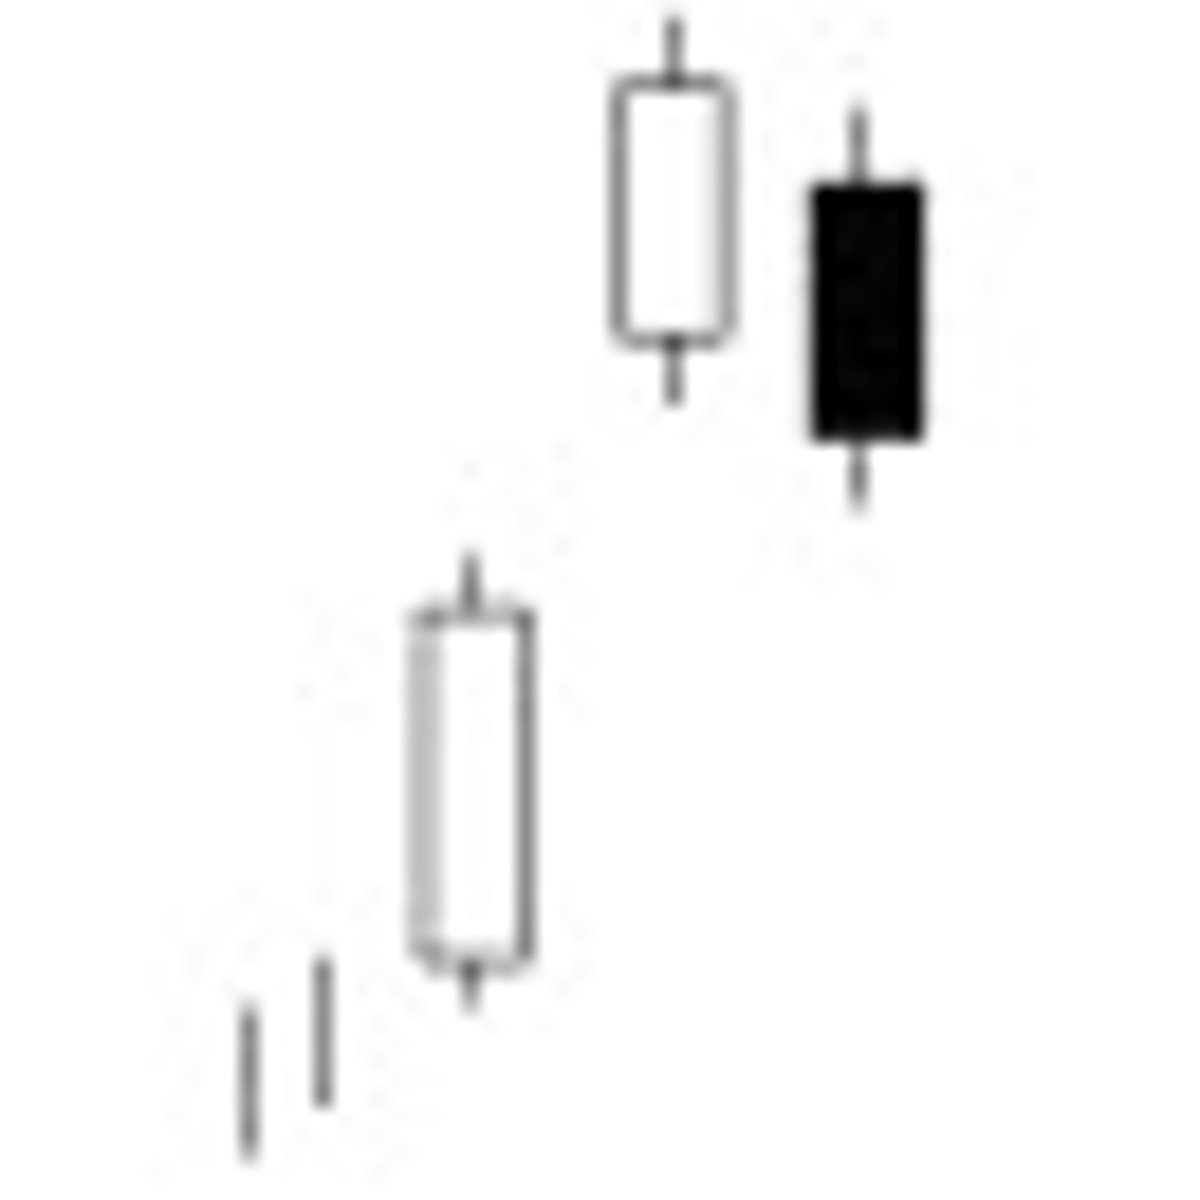
Bearish Sash
The white candle means the bulls are running
the show. And then the next session the
market gaps lower and is not only unable to
make it this lost ground, but closes under the
white candle. This shows the bullish energy
has been sapped out of the market resulting
in very scared bulls.
SUPPORT/MOMENTUM TRADING
• Highest high of both candles as
resistance
• Consider buying on breakout over
high of pattern
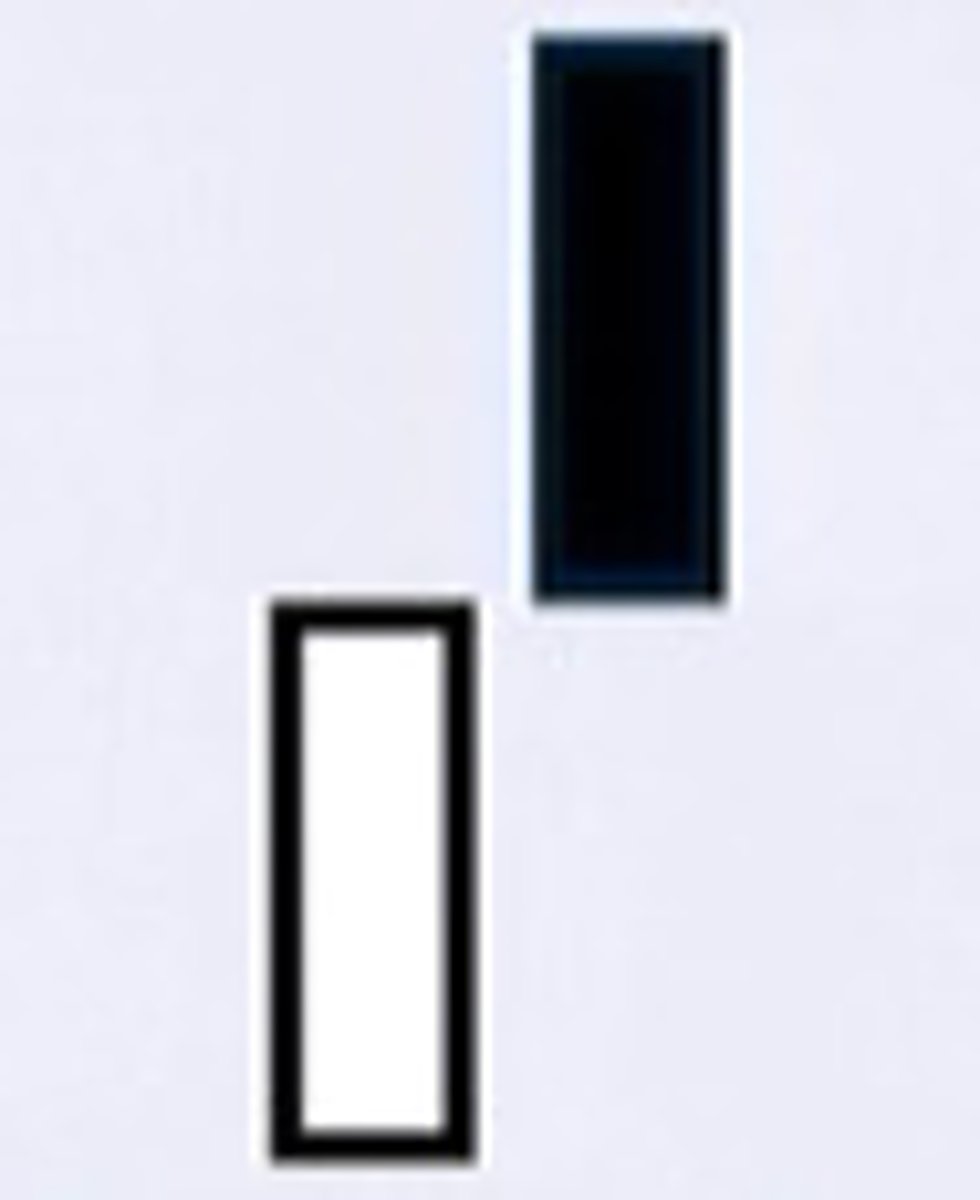
Bearish Separating Lines
PATTERN PSYCHOLOGY
With the gap down on 2nd day the bulls sense danger. And then to make matters worse for them, the market can't even make up for the ground lost on the opening. The tide of the market momentum has now turned down.
SUPPORT/MOMENTUM TRADING
• Highest high of both candles as
resistance
• Consider buying on move above
high of pattern
Bullish Counter Attack
Totally naka hiwalay sya pababa (Bullish)
Bullish Sash
Contact pa dn sila (Bullish)
Bull Separating Lines
Totally naka hiwalay sya pataass (Bullish)
Abandoned Baby
A rare reversal pattern characterized by a gap followed by a Doji, which is then followed by another gap in the opposite direction. The shadows on the Doji must completely gap below or above the shadows of the first and third day.
Dark Cloud Cover
A bearish reversal pattern that continues the uptrend with a long white body. The next day opens at a new high then closes below the midpoint of the body of the first day.

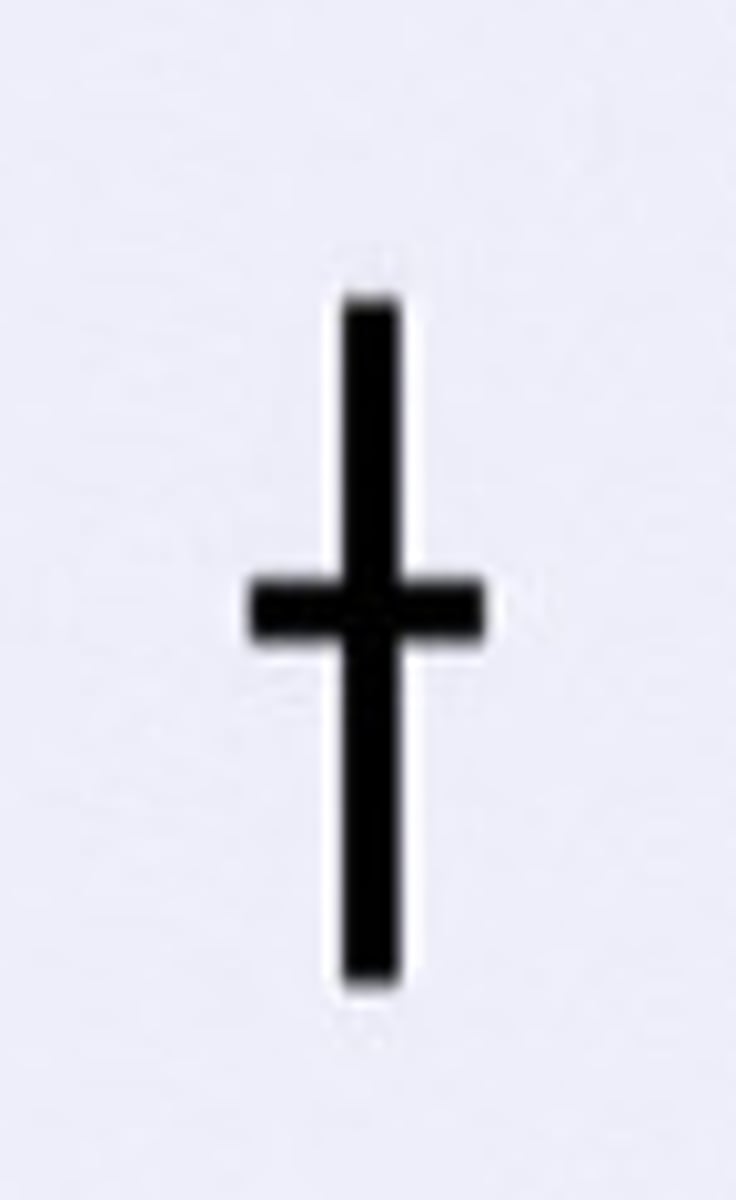
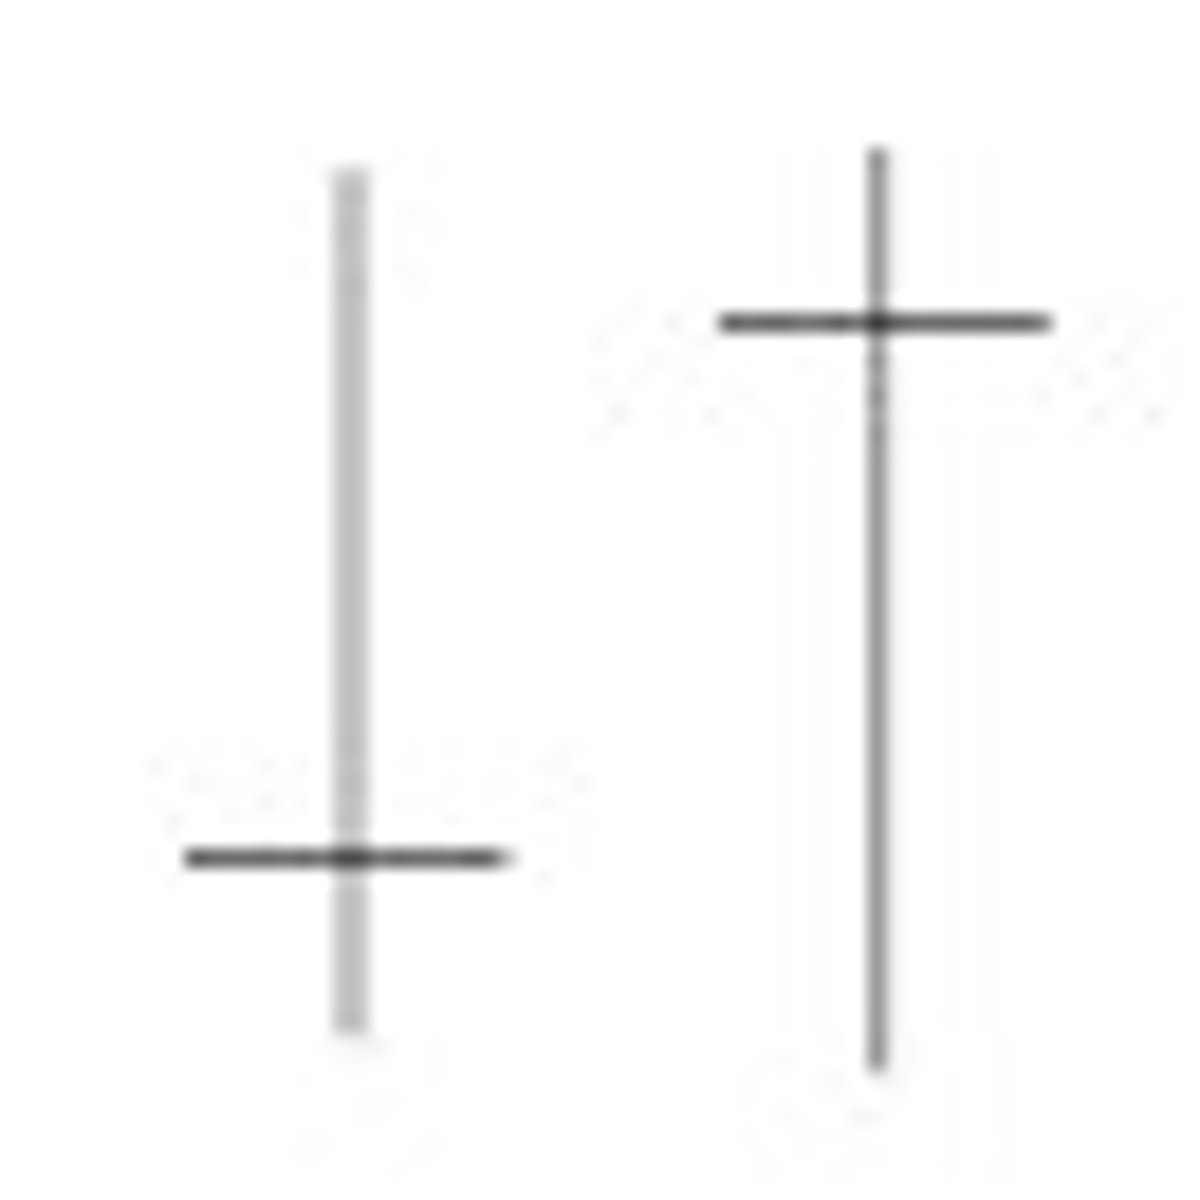
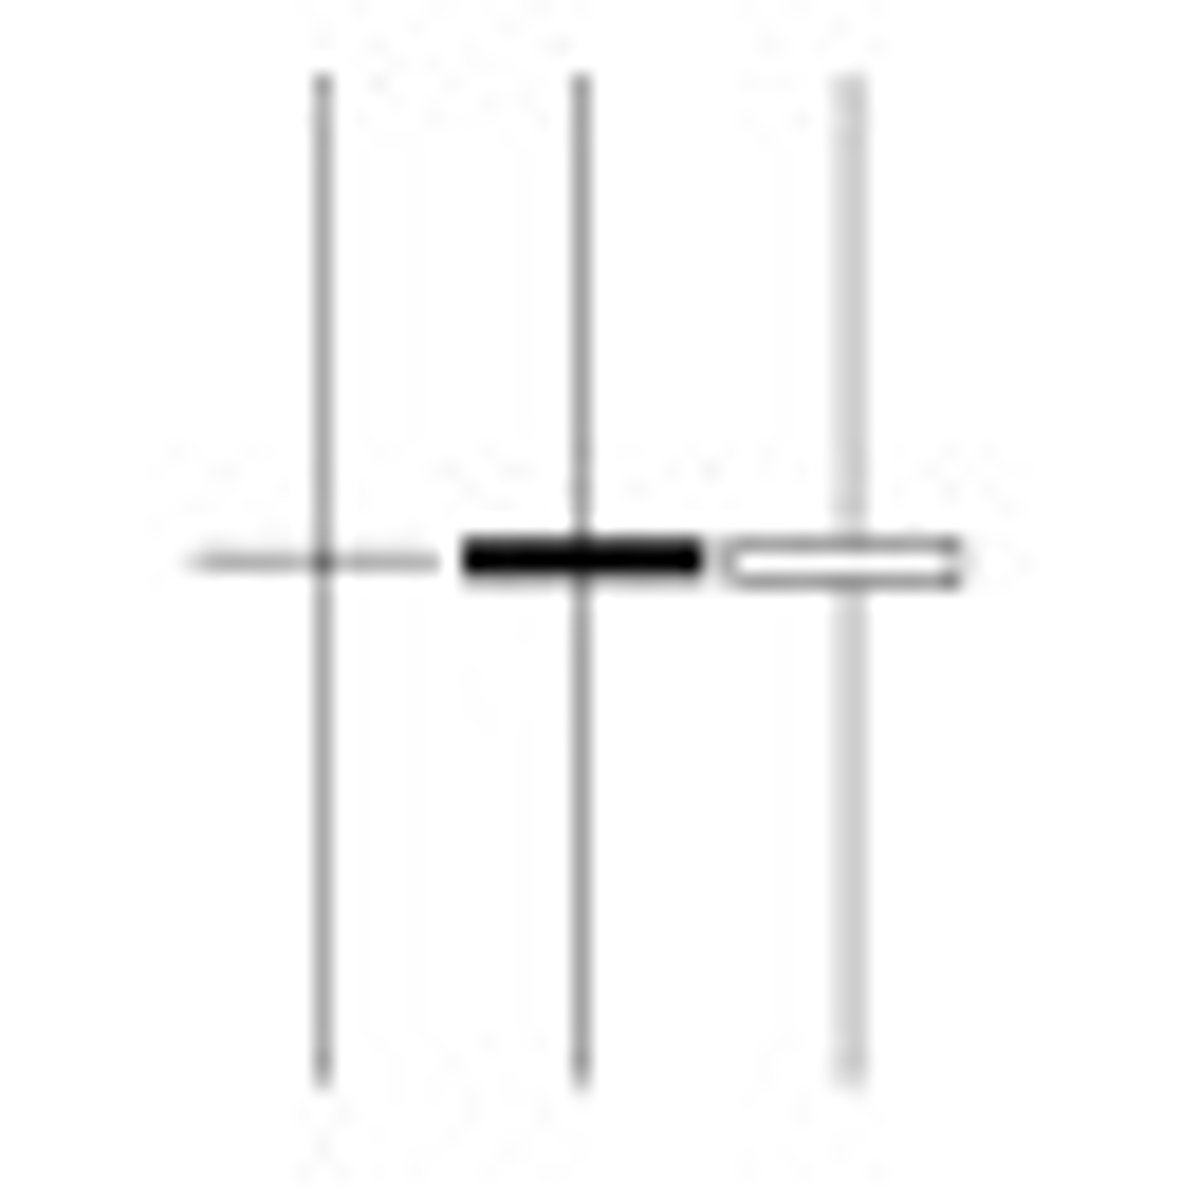
Doji
Doji form when a security's open and close are virtually equal. The length of the upper and lower shadows can vary, and the resulting candlestick looks like, either, a cross, inverted cross, or plus sign. Doji convey a sense of indecision or tug-of-war between buyers and sellers. Prices move above and below the opening level during the session, but close at or near the opening level.

Downside Tasuki Gap
A continuation pattern with a long, black body followed by another black body that has gapped below the first one. The third day is white and opens within the body of the second day, then closes in the gap between the first two days, but does not close the gap.
Dragonfly Doji
A Doji where the open and close price are at the high of the day. Like other Doji days, this one normally appears at market turning points.
Engulfing Pattern
A reversal pattern that can be bearish or bullish, depending upon whether it appears at the end of an uptrend (bearish engulfing pattern) or a downtrend (bullish engulfing pattern). The first day is characterized by a small body, followed by a day whose body completely engulfs the previous day's body.

Evening Doji Star
A three day bearish reversal pattern similar to the Evening Star. The uptrend continues with a large white body. The next day opens higher, trades in a small range, then closes at its open (Doji). The next day closes below the midpoint of the body of the first day.
Evening Star
A bearish reversal pattern that continues an uptrend with a long white body day followed by a gapped up small body day, then a down close with the close below the midpoint of the first day.
Falling Three Methods
A bearish continuation pattern. A long black body is followed by three small body days, each fully contained within the range of the high and low of the first day. The fifth day closes at a new low.

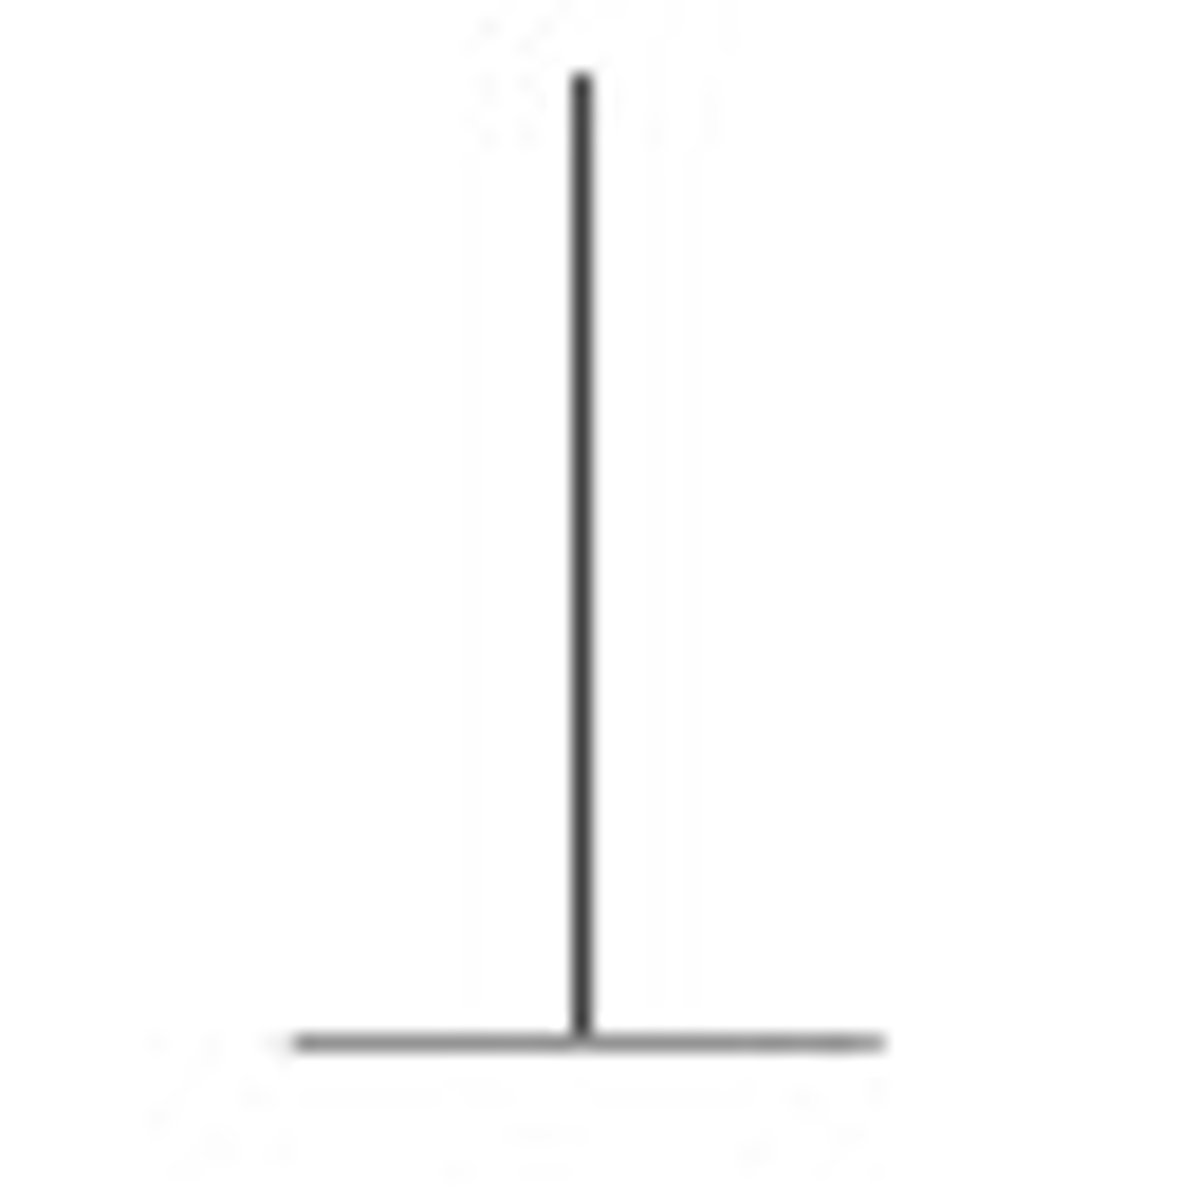
Gravestone Doji
A doji line that develops when the Doji is at, or very near, the low of the day.
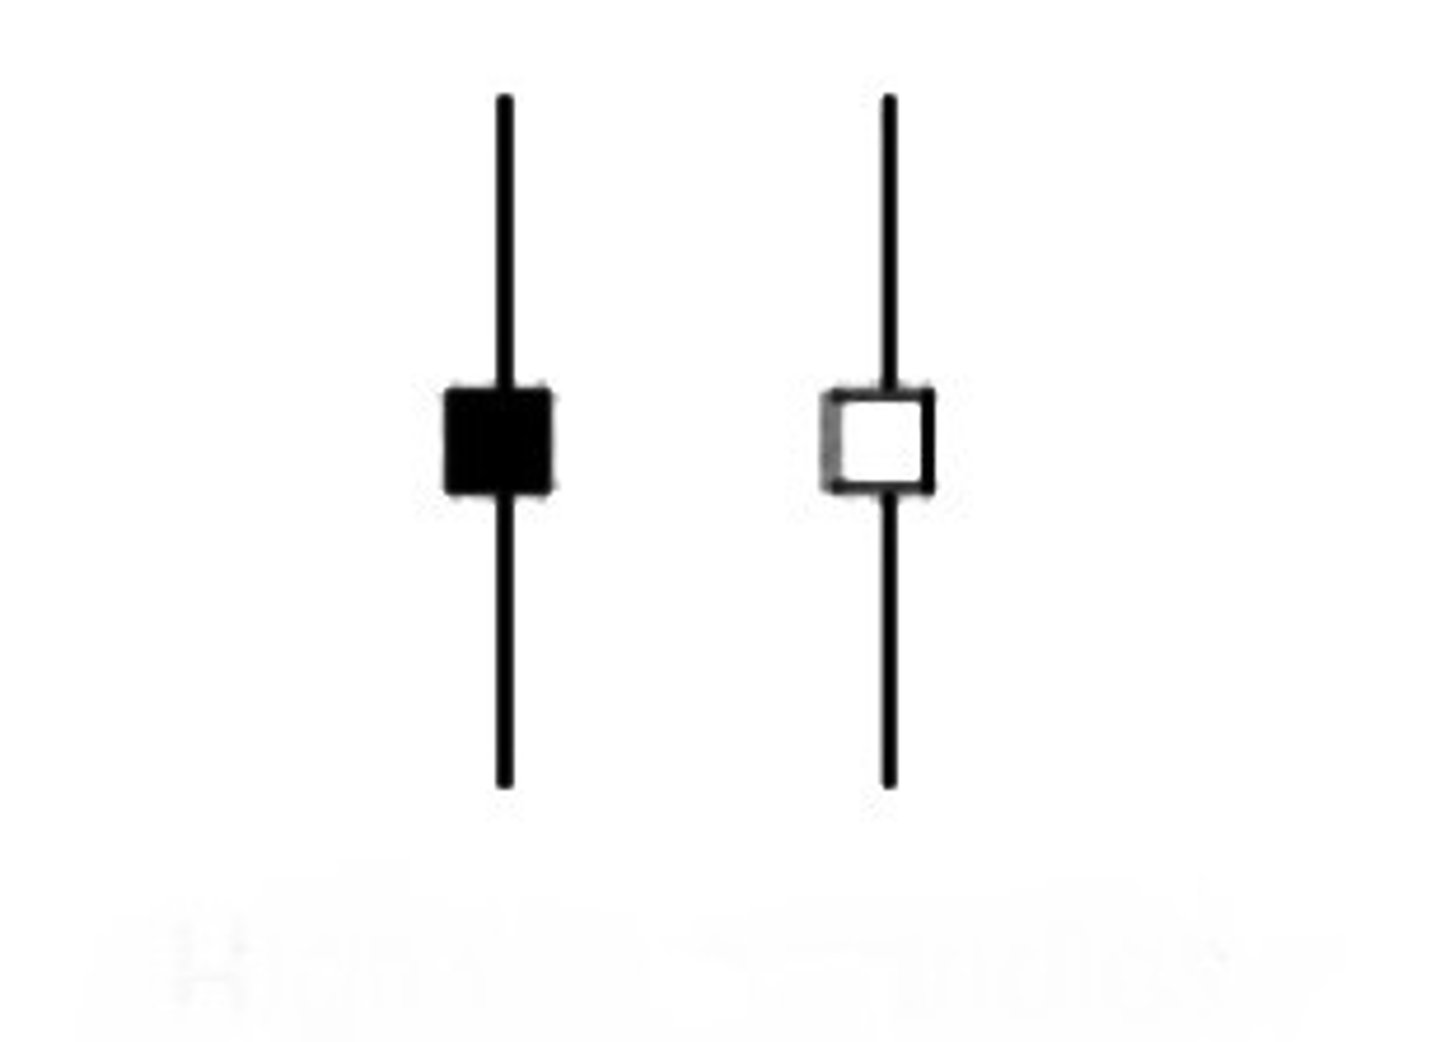
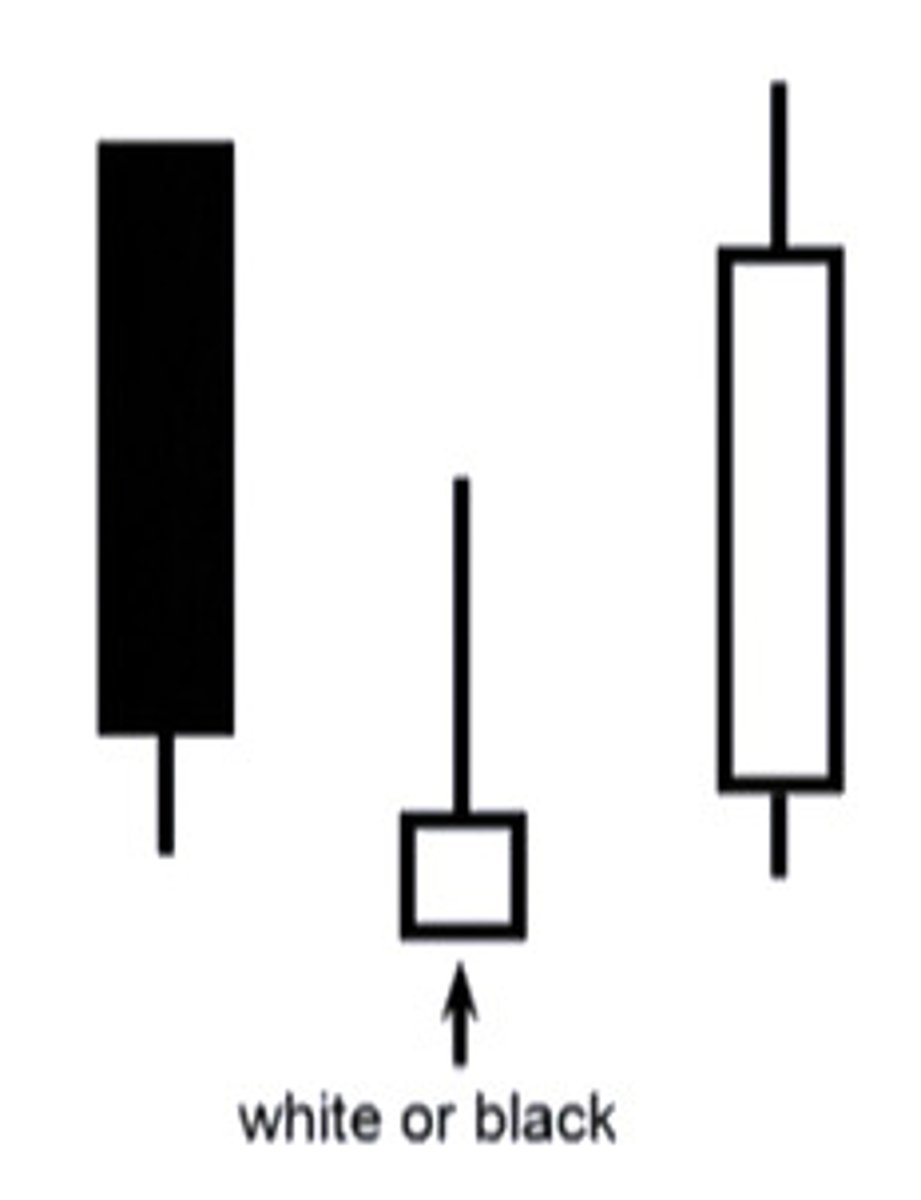
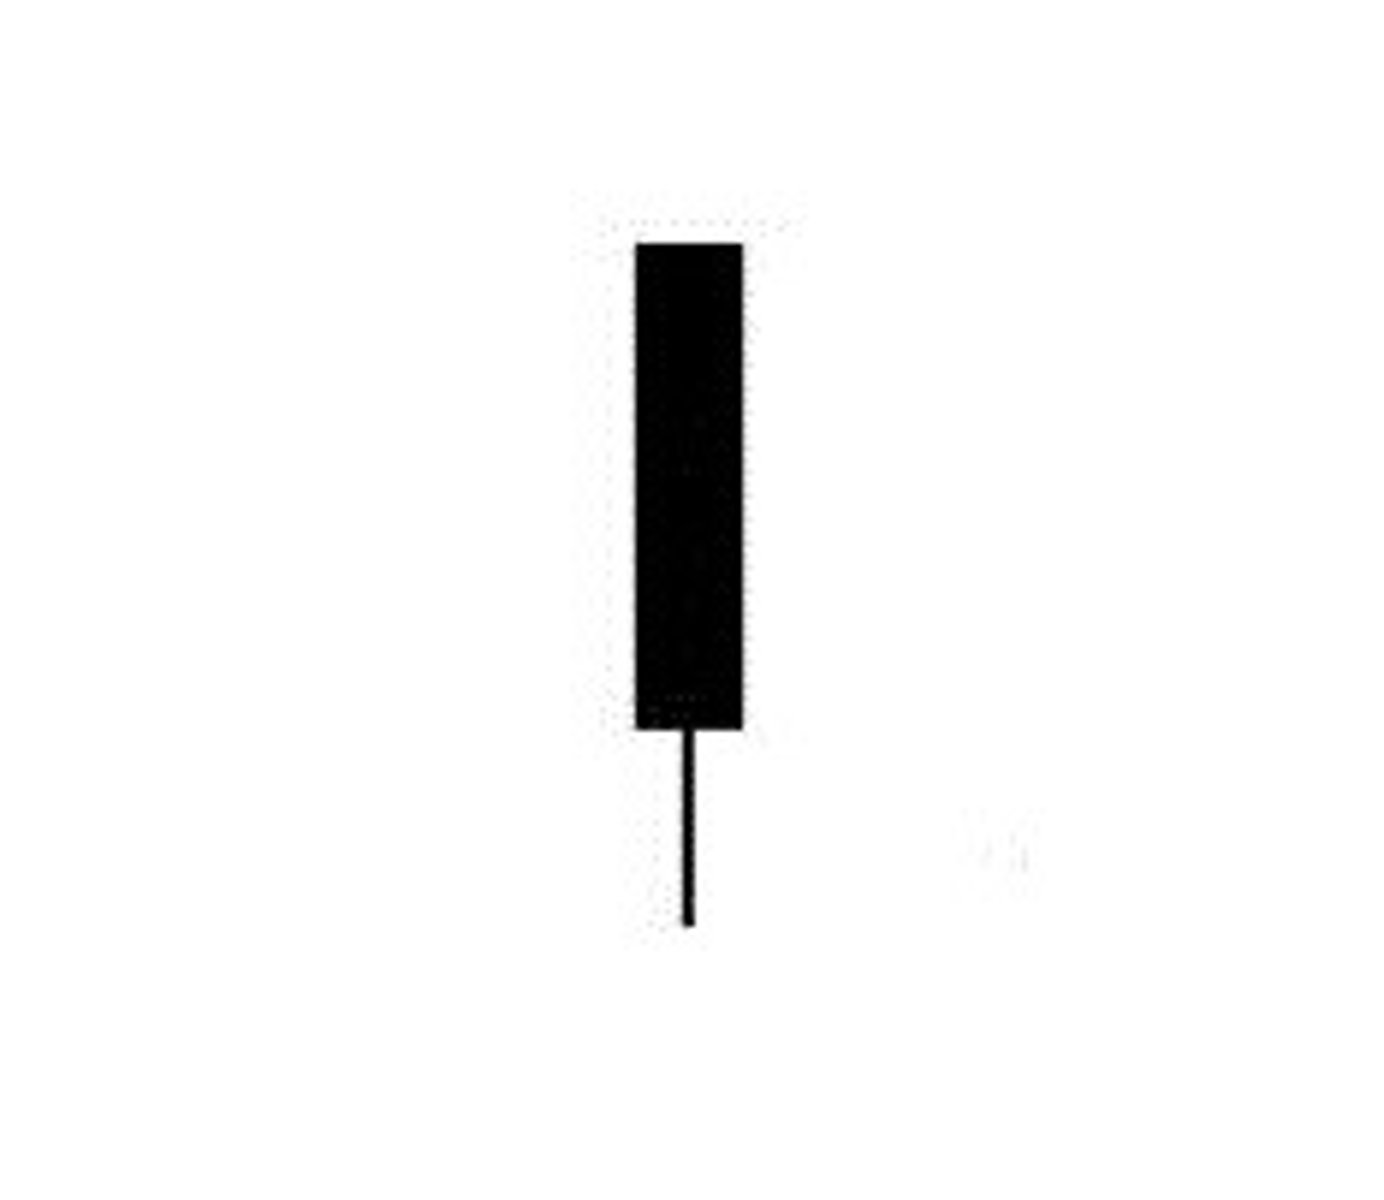
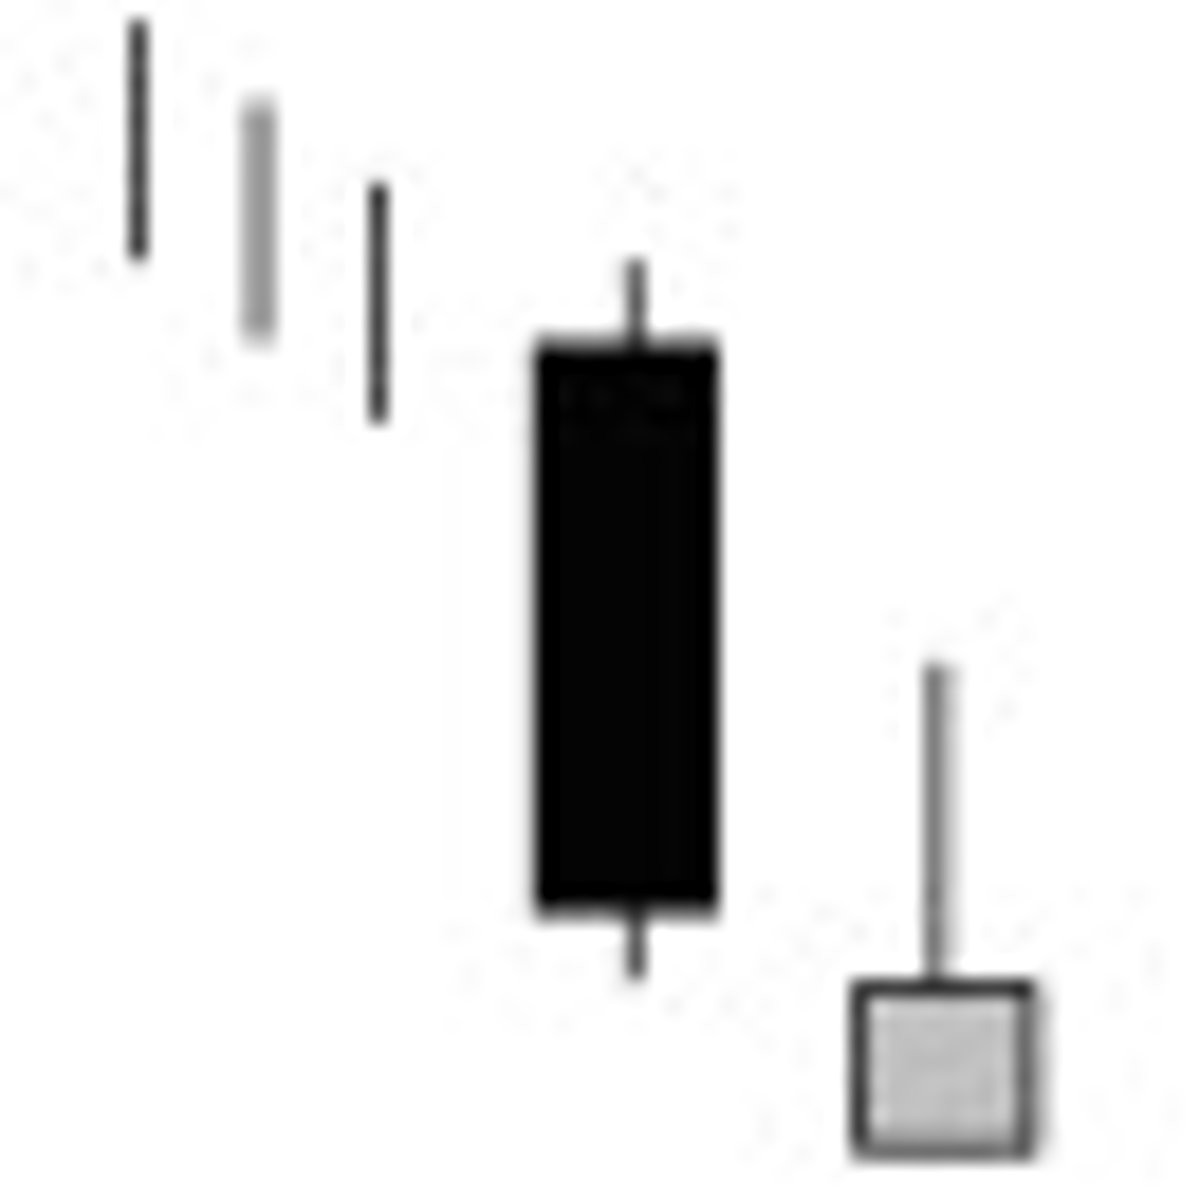
Hammer
Hammer candlesticks form when a security moves significantly lower after the open, but rallies to close well above the intraday low. The resulting candlestick looks like a square lollipop with a long stick. If this candlestick forms during an advance, then it is called a Hanging Man. Pring: white (green) candlesticks tend to have more significance over red ones,
Hanging Man
Hanging Man candlesticks form when a security moves significantly lower after the open, but rallies to close well above the intraday low. The resulting candlestick looks like a square lollipop with a long stick. If this candlestick forms during a decline, then it is called a Hammer.

Harami
A two day pattern that has a small body day completely contained within the range of the previous body, and is the opposite color.

Harami Cross
Harami Cross: A two day pattern similar to the Harami. The difference is that the last day is a Doji.

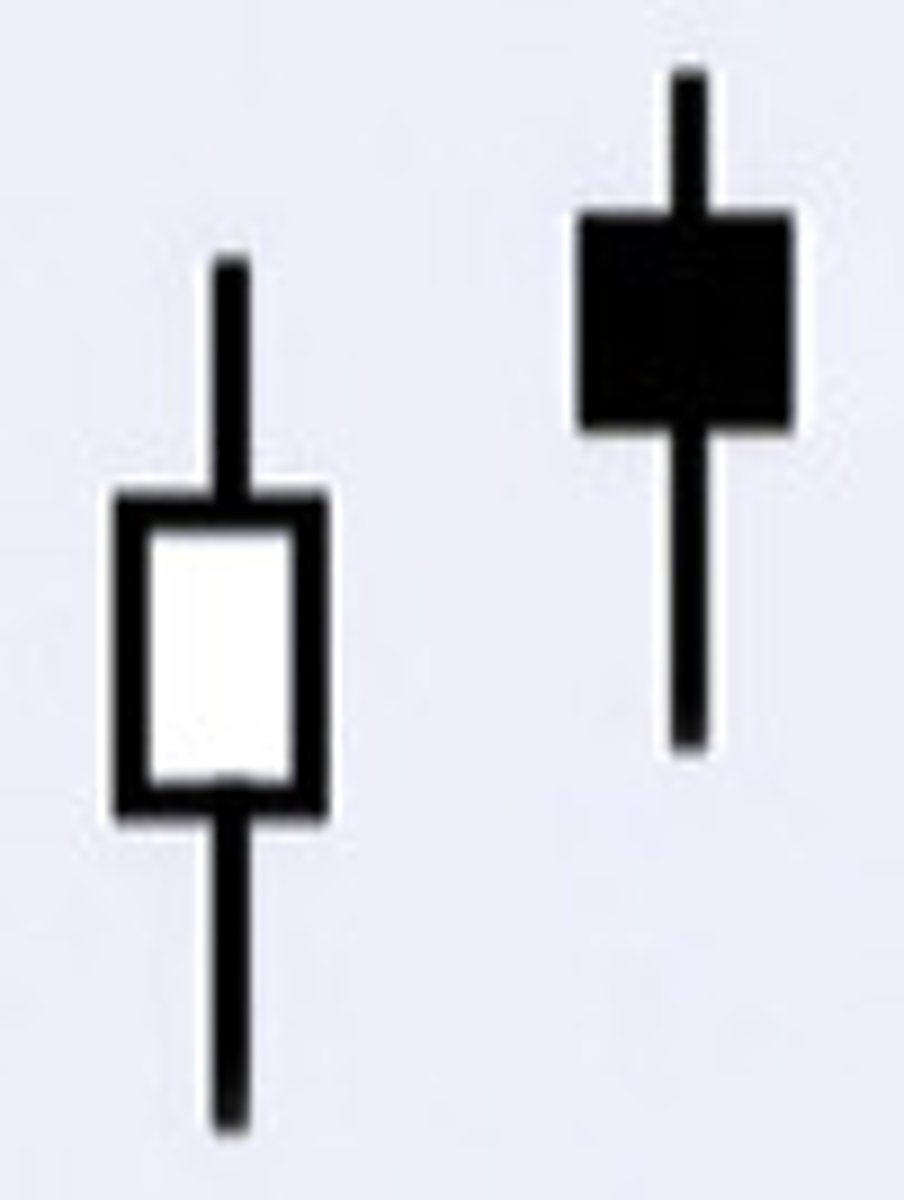
Inverted Hammer
A one day bullish reversal pattern. In a downtrend, the open is lower, then it trades higher, but closes near its open, therefore looking like an inverted lollipop.

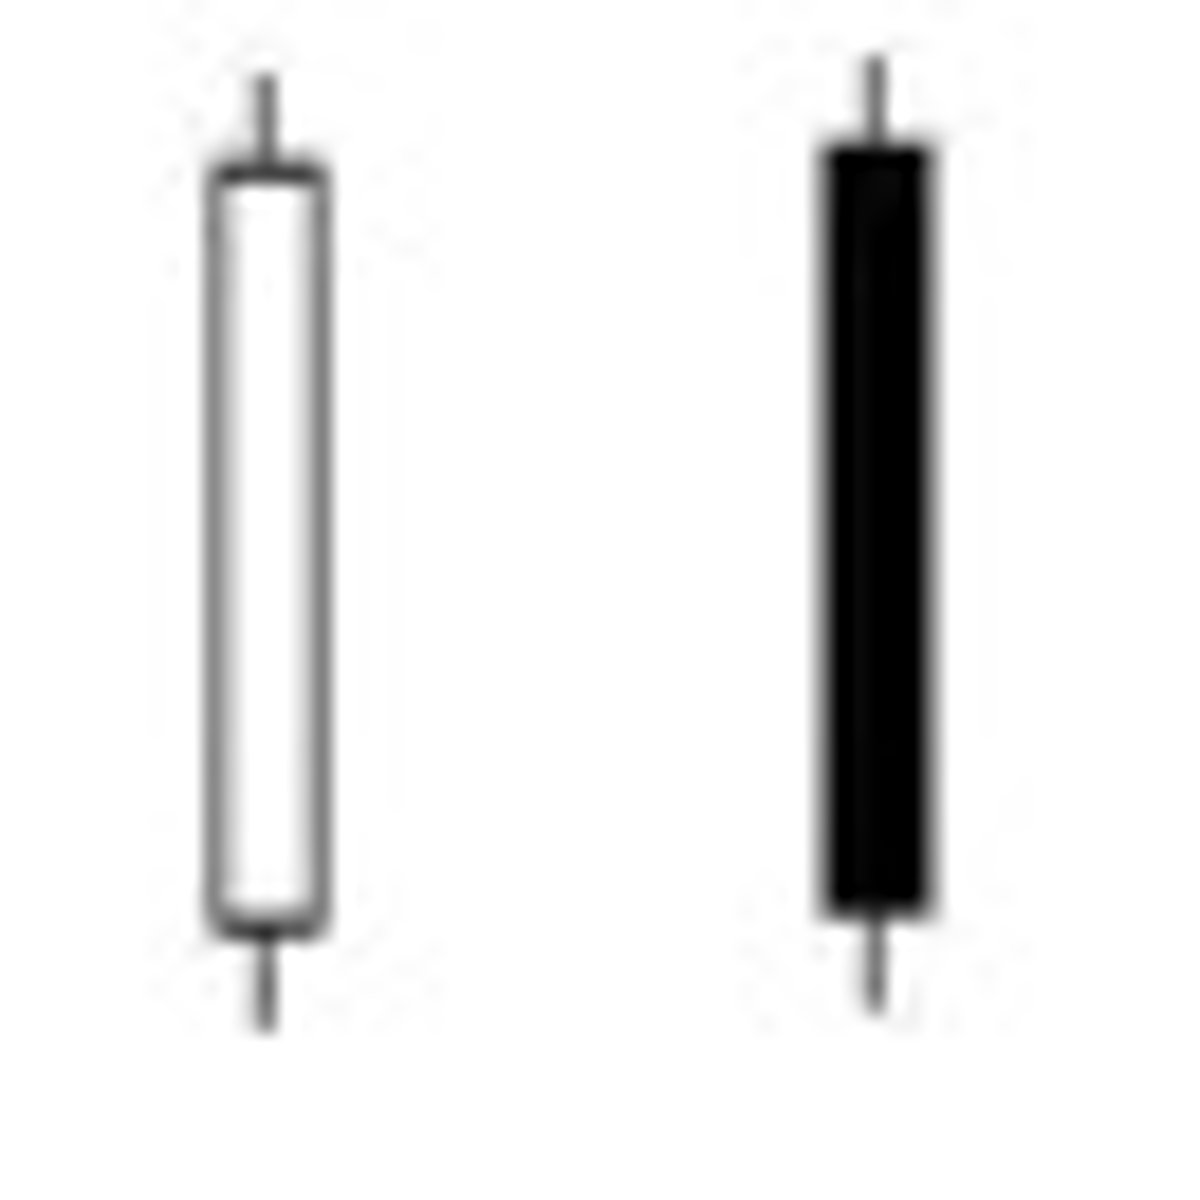
Long Day
A long day represents a large price move from open to close, where the length of the candle body is long. The long candle should be three times the size of the previous candle.

Long-Legged Doji
This candlestick has long upper and lower shadows with the Doji in the middle of the day's trading range, clearly reflecting the indecision of traders.

Long Shadows
Candlesticks with a long upper shadow and short lower shadow indicate that buyers dominated during the first part of the session bidding prices higher. Conversely, candlesticks with long lower shadows and short upper shadows indicate that sellers dominated during the first part of the session driving prices lower.

Marubozo
A candlestick with no shadow extending from the body at either the open, the close or at both. The name means close-cropped or close-cut in Japanese, though other interpretations refer to it as Bald or Shaven Head.
Morning Doji Star
A three day bullish reversal pattern that is very similar to the Morning Star. The first day is in a downtrend with a long black body. The next day opens lower with a Doji that has a small trading range. The last day closes above the midpoint of the first day.

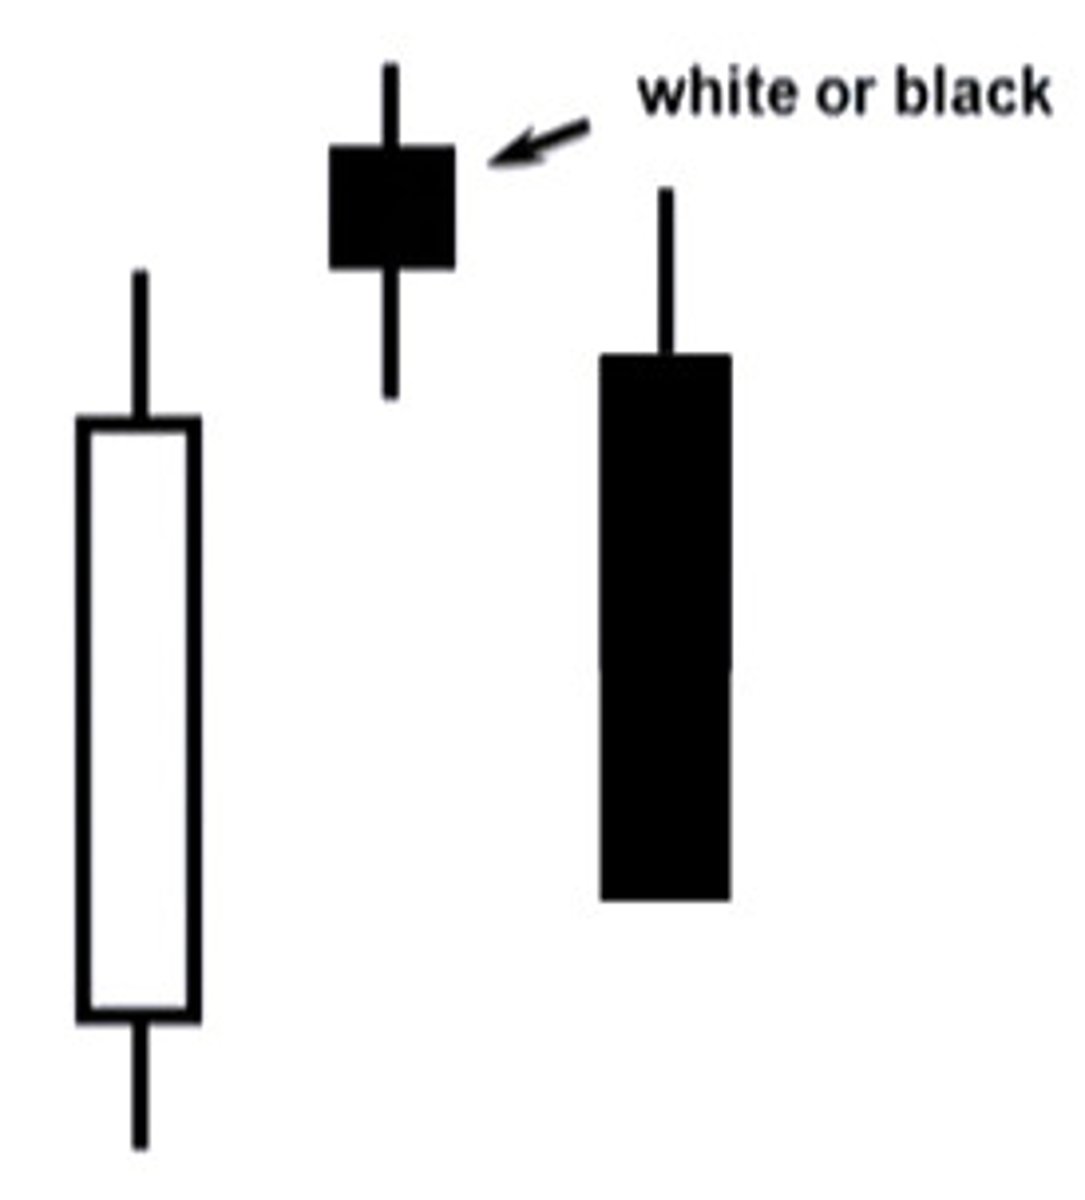
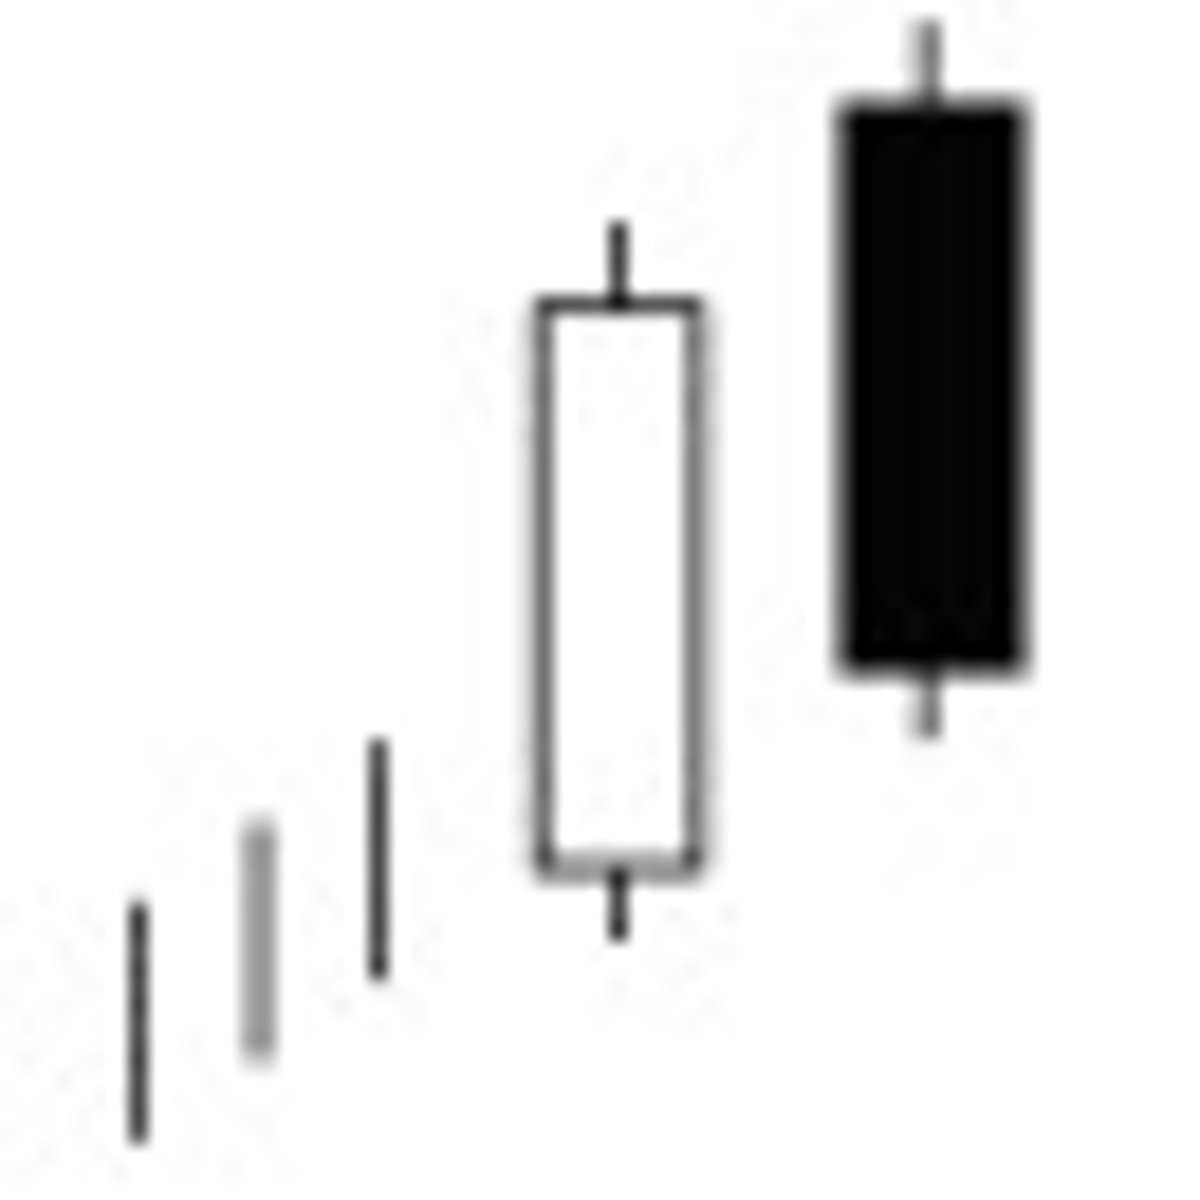
Morning Star
A three day bullish reversal pattern consisting of three candlesticks - a long-bodied black candle extending the current downtrend, a short middle candle that gapped down on the open, and a long-bodied white candle that gapped up on the open and closed above the midpoint of the body of the first day
Piercing Line
A bullish two day reversal pattern. The first day, in a downtrend, is a long black day. The next day opens at a new low, then closes above the midpoint of the body of the first day.
Rising Three Methods
A bullish continuation pattern in which a long white body is followed by three small body days, each fully contained within the range of the high and low of the first day. The fifth day closes at a new high.

Shooting Star
A single day pattern that can appear in an uptrend. It opens higher, trades much higher, then closes near its open. It looks just like the Inverted Hammer except that it is bearish.

Short Day
A short day represents a small price move from open to close, where the length of the candle body is short.

Spinning Top
SC: Candlestick lines that have small bodies with upper and lower shadows that exceed the length of the body. Spinning tops signal indecision. Pring: Size of the body is more important than size of shadows in determining. Not important within a trading range but when developing a part of a price pattern. High volume produces a stronger reversal evidence.
Stars
A candlestick that gaps away from the previous candlestick is said to be in star position. Depending on the previous candlestick, the star position candlestick gaps up or down and appears isolated from previous price action.
Stick Sandwich
A bullish reversal pattern with two black bodies surrounding a white body. The closing prices of the two black bodies must be equal. A support prices is apparent and the opportunity for prices to reverse is quite good.
Three Black Crows
A bearish reversal pattern consisting of three consecutive long black bodies where each day closes at or near its low and opens within the body of the previous day.
Three White Soldiers
A bullish reversal pattern consisting of three consecutive long white bodies. Each should open within the previous body and the close should be near the high of the day.

Upside Gap Two Crows
A three day bearish pattern that only happens in an uptrend. The first day is a long white body followed by a gapped open with the small black body remaining gapped above the first day. The third day is also a black day whose body is larger than the second day and engulfs it. The close of the last day is still above the first long white day.
Upside Tasuki Gap
A continuation pattern with a long white body followed by another white body that has gapped above the first one. The third day is black and opens within the body of the second day, then closes in the gap between the first two days, but does not close the gap.
Shaven Head (Bottom)
Similar to a Marubozu but with a wick.
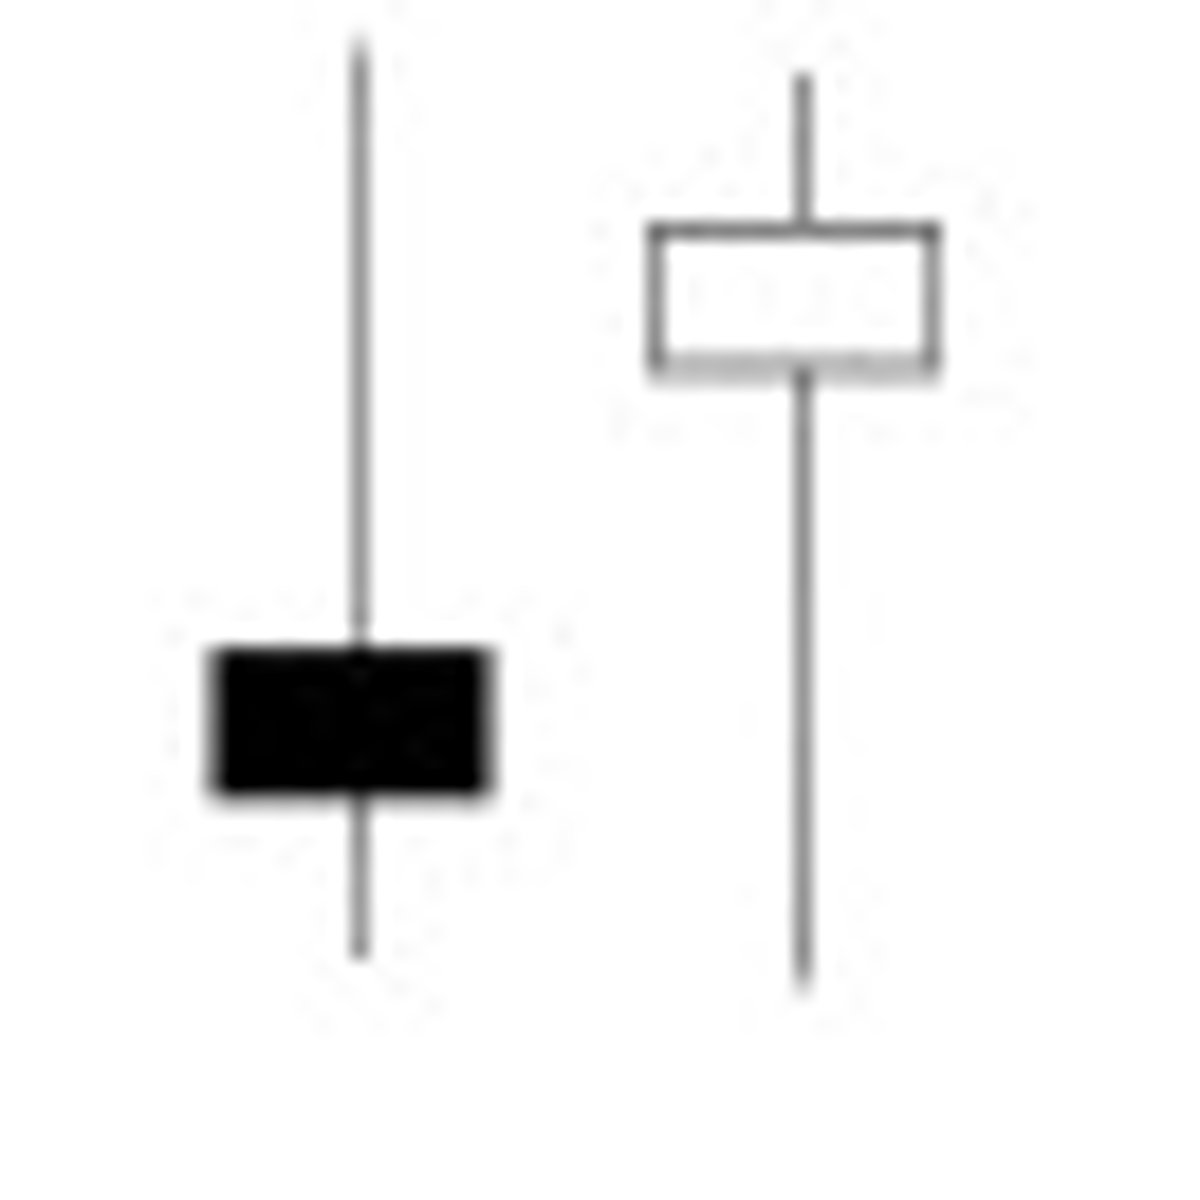
Umbrella lines
Opening and closing prices form near the high of the day. Bullish following a decline and bearish following an advance. No significance if formed during trading ranges.
Abandoned Baby
A rare reversal pattern characterized by a gap followed by a Doji, which is then followed by another gap in the opposite direction. The shadows on the Doji must completely gap below or above the shadows of the first and third day.

Dark Cloud Cover
A bearish reversal pattern that continues the uptrend with a long white body. The next day opens at a new high then closes below the midpoint of the body of the first day.
Doji
Doji form when a security's open and close are virtually equal. The length of the upper and lower shadows can vary, and the resulting candlestick looks like, either, a cross, inverted cross, or plus sign. Doji convey a sense of indecision or tug-of-war between buyers and sellers. Prices move above and below the opening level during the session, but close at or near the opening level.
Downside Tasuki Gap
A continuation pattern with a long, black body followed by another black body that has gapped below the first one. The third day is white and opens within the body of the second day, then closes in the gap between the first two days, but does not close the gap.

Dragonfly Doji
A Doji where the open and close price are at the high of the day. Like other Doji days, this one normally appears at market turning points.

Engulfing Pattern
A reversal pattern that can be bearish or bullish, depending upon whether it appears at the end of an uptrend (bearish engulfing pattern) or a downtrend (bullish engulfing pattern). The first day is characterized by a small body, followed by a day whose body completely engulfs the previous day's body.
Evening Doji Star
A three day bearish reversal pattern similar to the Evening Star. The uptrend continues with a large white body. The next day opens higher, trades in a small range, then closes at its open (Doji). The next day closes below the midpoint of the body of the first day.

Evening Star
A bearish reversal pattern that continues an uptrend with a long white body day followed by a gapped up small body day, then a down close with the close below the midpoint of the first day.

Falling Three Methods
A bearish continuation pattern. A long black body is followed by three small body days, each fully contained within the range of the high and low of the first day. The fifth day closes at a new low.
Gravestone Doji
A doji line that develops when the Doji is at, or very near, the low of the day.

Hammer
Hammer candlesticks form when a security moves significantly lower after the open, but rallies to close well above the intraday low. The resulting candlestick looks like a square lollipop with a long stick. If this candlestick forms during an advance, then it is called a Hanging Man.

Hanging Man
Hanging Man candlesticks form when a security moves significantly lower after the open, but rallies to close well above the intraday low. The resulting candlestick looks like a square lollipop with a long stick. If this candlestick forms during a decline, then it is called a Hammer.
Harami
A two day pattern that has a small body day completely contained within the range of the previous body, and is the opposite color.
Harami Cross
Harami Cross: A two day pattern similar to the Harami. The difference is that the last day is a Doji.
Inverted Hammer
A one day bullish reversal pattern. In a downtrend, the open is lower, then it trades higher, but closes near its open, therefore looking like an inverted lollipop.
Long Day
A long day represents a large price move from open to close, where the length of the candle body is long.
Long-Legged Doji
This candlestick has long upper and lower shadows with the Doji in the middle of the day's trading range, clearly reflecting the indecision of traders.
Long Shadows
Candlesticks with a long upper shadow and short lower shadow indicate that buyers dominated during the first part of the session bidding prices higher. Conversely, candlesticks with long lower shadows and short upper shadows indicate that sellers dominated during the first part of the session driving prices lower.
Marubozo
A candlestick with no shadow extending from the body at either the open, the close or at both. The name means close-cropped or close-cut in Japanese, though other interpretations refer to it as Bald or Shaven Head.

Morning Doji Star
A three day bullish reversal pattern that is very similar to the Morning Star. The first day is in a downtrend with a long black body. The next day opens lower with a Doji that has a small trading range. The last day closes above the midpoint of the first day.
Morning Star
A three day bullish reversal pattern consisting of three candlesticks - a long-bodied black candle extending the current downtrend, a short middle candle that gapped down on the open, and a long-bodied white candle that gapped up on the open and closed above the midpoint of the body of the first day

Piercing Line
A bullish two day reversal pattern. The first day, in a downtrend, is a long black day. The next day opens at a new low, then closes above the midpoint of the body of the first day.

Rising Three Methods
A bullish continuation pattern in which a long white body is followed by three small body days, each fully contained within the range of the high and low of the first day. The fifth day closes at a new high.
Shooting Star
A single day pattern that can appear in an uptrend. It opens higher, trades much higher, then closes near its open. It looks just like the Inverted Hammer except that it is bearish.
Short Day
A short day represents a small price move from open to close, where the length of the candle body is short.

Spinning Top
Candlestick lines that have small bodies with upper and lower shadows that exceed the length of the body. Spinning tops signal indecision.

Stars
A candlestick that gaps away from the previous candlestick is said to be in star position. Depending on the previous candlestick, the star position candlestick gaps up or down and appears isolated from previous price action.

Stick Sandwich
A bullish reversal pattern with two black bodies surrounding a white body. The closing prices of the two black bodies must be equal. A support prices is apparent and the opportunity for prices to reverse is quite good.

Three Black Crows
A bearish reversal pattern consisting of three consecutive long black bodies where each day closes at or near its low and opens within the body of the previous day.

Three White Soldiers
A bullish reversal pattern consisting of three consecutive long white bodies. Each should open within the previous body and the close should be near the high of the day.
Upside Gap Two Crows
A three day bearish pattern that only happens in an uptrend. The first day is a long white body followed by a gapped open with the small black body remaining gapped above the first day. The third day is also a black day whose body is larger than the second day and engulfs it. The close of the last day is still above the first long white day.

Upside Tasuki Gap
A continuation pattern with a long white body followed by another white body that has gapped above the first one. The third day is black and opens within the body of the second day, then closes in the gap between the first two days, but does not close the gap.

Blended Candle
1) Use open of the first session for open of blended candle
2) Use close of the last session of pattern for close of
blended candle.
3) Use highest high and lowest close of all sessions for
upper and lower shadows of blended candle.