Methods Week 11 - Visualizations (2/2)
1/6
There's no tags or description
Looks like no tags are added yet.
Name | Mastery | Learn | Test | Matching | Spaced | Call with Kai |
|---|
No study sessions yet.
7 Terms
how do u understand an error bar?
it is significant if it doesn’t pass 0. (same idea as CI)
what is data visualization important?
bypass assumptions that data sets look similar just based on similar data
distortion of scale
changing y axis to make the differences look very significant
harder to identify in line graphs than bar graph bc we don’t know the range of the scale being used
distortion of meaning
changing the scale not to emphasize but to change the meaning to shown in the graph
ex. body temp vs. %above 98.6 body temp
assumed linearity
showing more data points show different variability rather than just a few data points that would show that something is insignificant
helps with developing new studies to fix problems
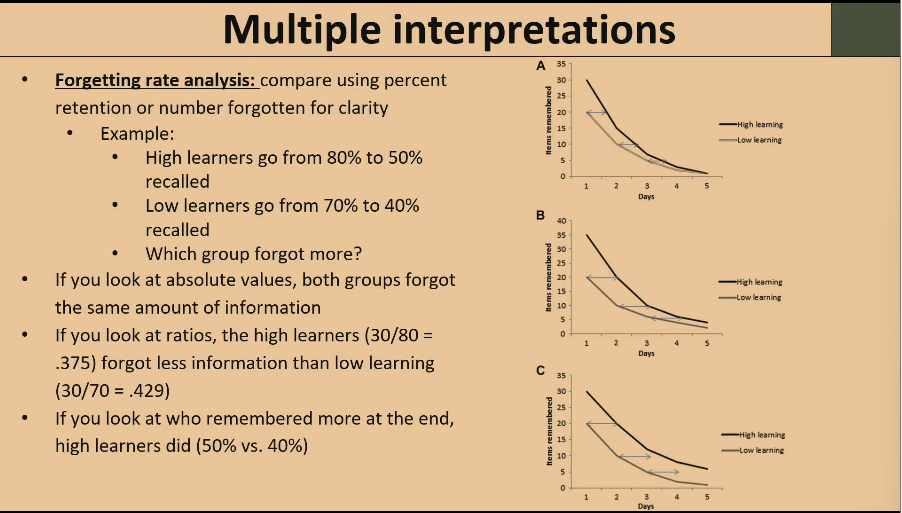
multiple interpretations
forgot 30% of information in BOTH groups
ratio: 30%/80% they forgot less information than what they knew initially
who remembered more at the end

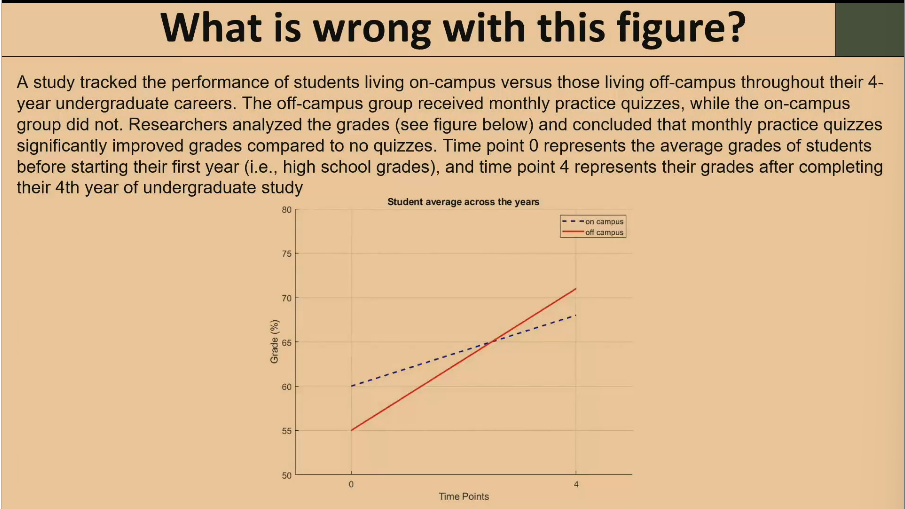
what is wrong with this figure?
2 data points
is the point is years or just 2 data points in general
2 groups don’t start off at similar base line so there could be confounds that statically are different and cannot be compared.