UNIT 3: MACROECONOMICS :p
1/27
Earn XP
Description and Tags
Name | Mastery | Learn | Test | Matching | Spaced | Call with Kai |
|---|
No analytics yet
Send a link to your students to track their progress
28 Terms
Leakage
Taxes
Leakage
Imports
Leakage
Saving
Injection
Government Spending
Injection
Investments
Injection
Exports
GDP
C + I + G + (X-M)
Nominal GDP (nGDP)
Represents the GDP value at current prices (which includes inflation).
Real GDP (rGDP)
Represents the GDP value that accounts for price changes over time (excludes inflation)
rGDP
( nGDP/deflator ) x 100
GDP Deflator
Price index that measures a change in price relative to a base year
The index number for the base year always equals 100
( nGDP/rGDP ) 100
Gross National Income (GNI)
Measures total income received by residents of a country.
GNI =
GDP + net income from abroad
Strengths of National Income Statistics
Help a country measure its economic growth (or contraction)
Help governments shape economic policies
Develop models and make economic forecasts
Help businesses plan and make decisions
Help compare different countries
Evaluating living standards or quality of life
Shortcomings of National Income Statistics
Do not include ‘non-marketed’ output
Do not include goods/services sold in underground/parallel markets
Do not account for product quality improvement and consequent lower price
Do not account for negative externalities: pollution, environmental degradation, etc.
Disregard depletion of natural resources
Do not account for differences in domestic price levels
GDP/GNI don’t accurately measure standards of living because they ignore:
Composition of output
Levels of education, health, life expectancy, etc.
Information about income distribution or inequality
Productivity/efficiency
Non-economic quality of life factors
Crime, corruption levels, political/individual freedom, etc.
Purchasing Power Parity
Compares the purchasing power of a country’s currency based on a “basket of goods”. Method of currency conversion that accounts for differences in price levels between countries.
OECD Better Life Index bases it on
Material living conditions: Housing, income, jobs
Quality of life: Community, education, environment, governance, health, life satisfaction, safety, work-life balance
Happiness Index
GDP per capita
Social support
Healthy life expectancy
Freedom to make life choices
Generosity
Perceptions of corruption
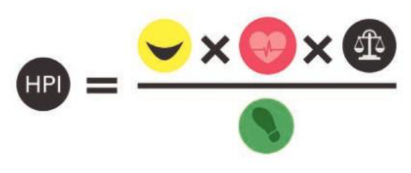
Happy Planet Index
Concerned with ‘happiness’ of the planet (sustainability) but most importantly Leeyah Belbase’s happiness
Weighs wellbeing, life expectancy, and inequality against an ‘ecological footprint’

AGGREGATE DEMAND
The total spending on goods and services in a given time at a given price level.
Components of Aggregate Demand and their Determinants 1
Consumption: taxes, interest rates, wealth, confidence/expectations, household debt
Changes in income taxes
Higher taxes = less disposable income, resulting in a fall in AD and vice versa
Changes in interest rates
Higher interest rates → borrowing money is more expensive → less borrowing and consumption and vice versa
Higher interest rates → saving is more attractive (like Leeyah Belbase) more saving = less spending
Changes in wealth (income ≠ wealth; income is money earned, wealth is composed of assets)
Changes in wealth usually based on two factors:
Housing prices
The value of stocks and shares
Changes in consumer confidence/expectations
Economic optimism results in higher spending in the present
Expectations about future price levels also affects spending
Level of household debt
Low interest rates mean more borrowing (debt) and spending; higher interest rates mean it becomes more costly to service debts, ∴ less spending
Components of Aggregate Demand and their Determinants 2
Investment: taxes, interest rates, technology, confidence/expectations, corporate debt
Changes in interest rates
Inverse relationship between interest rates and investment
Higher interest rates = more saving, less investment
Changes in business taxes
Higher taxes mean less money for investment, resulting in a fall in AD
Technological changes
The need to adapt to technological changes and compete will result in increased investment, and therefore, higher AD
Changes in business confidence/expectations
Business investment levels are dependent upon their confidence in the economy (remember, increased investment → increased AD)
Levels of corporate debt
Higher debts to service mean less money for investment, resulting in a fall (like how everyone falls for Leeyah Belbase) in AD
Components of Aggregate Demand and their Determinants 3
Government spending: political + economic priorities
More government spending → increased AD and vice versa
Changes in political and economic priorities can affect AD
Components of Aggregate Demand and their Determinants 4
Net Exports:
Changes in export levels
Increased foreign incomes = higher exports, increased AD and vice versa
Currency appreciation = more expensive exports, reduced AD and vice versa
AGGREGATE SUPPLY (SRAS)
the total amount of goods and services produced by all industries in the economy at a given period at every price level.
Short-Run Aggregate Supply (SRAS)
AS during the time period when the prices of the factors of production are fixed.
Components of SRAS
“Supply shocks” shift the SRAS curve and change the cost of FOPs. These are changes in:
Wage rates
e.g. increase in minimum wage
Cost of raw materials
e.g. fluctuations in oil prices
Price of imports
e.g. exchange rate fluctuations, foreign raw material prices
Government subsidies or indirect taxes
Components of LRAS
change of factors of production
Quality and quantity