5.5 Break-even analysis BM
1/26
There's no tags or description
Looks like no tags are added yet.
Name | Mastery | Learn | Test | Matching | Spaced | Call with Kai |
|---|
No analytics yet
Send a link to your students to track their progress
27 Terms
Break-even
when a firm’s sales revenues cover all of its production costs.
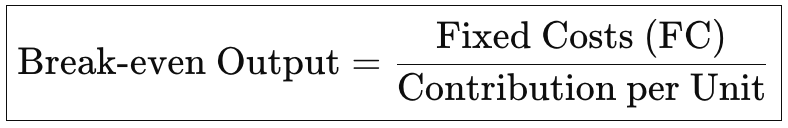
Break-even quantity
the level of output where a business does
not make either a profit or a loss. The formula for calculating the BEQ is:
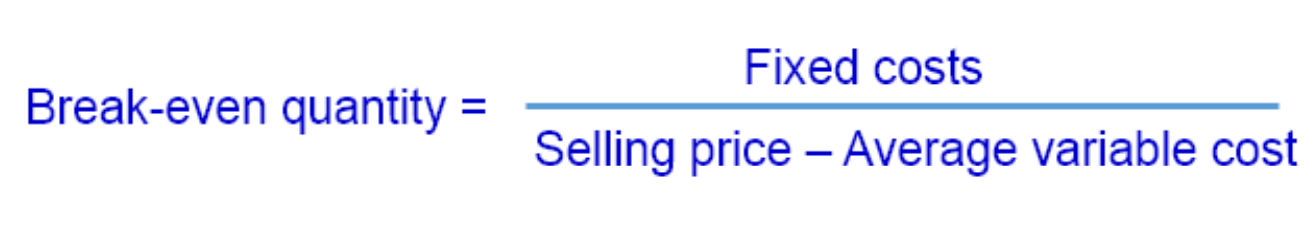
Contribution per unit / unit contribution
the amount of money earned from each unit of the product sold to customers.
Selling Price - AVC
Total contribution
(P-AVC)Q
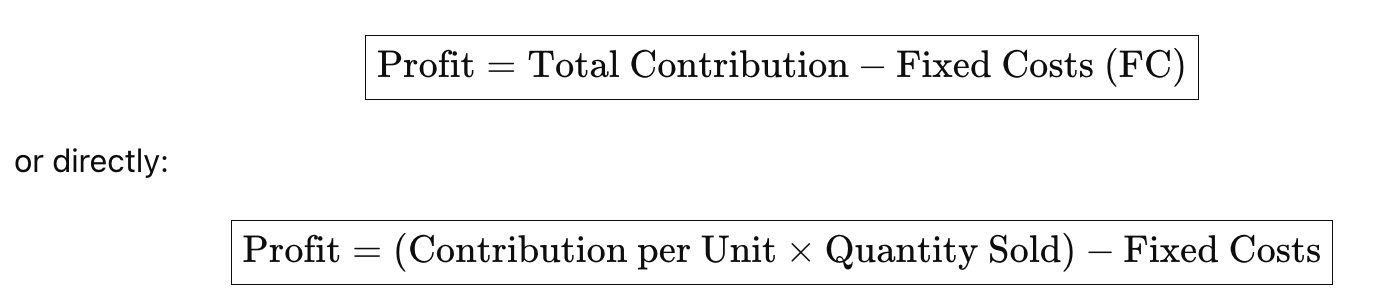
Profit
positive difference between a firm's total revenue
and its total costs. Profit is shown in a break-even chart at all
levels of output beyond the break-even quantity.
[(P-AVC)Q]-TFC
Value added per unit
P - ATC
Margin of Safety
numerical difference between how much the business sells and its BEQ
Quantity sold - BEQ
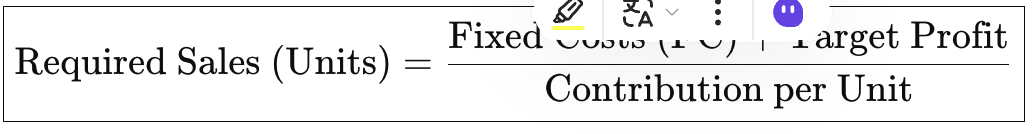
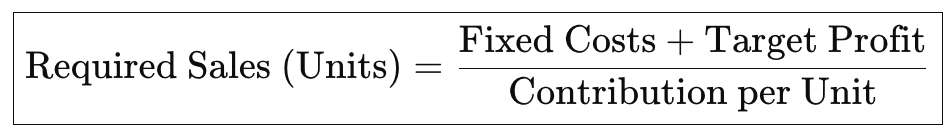
Target profit output (or target profit quantity)
quantity of sales required to reach the firm’s target profit. It is calculated using the formula:
Target profit quantity = (Fixed cost + Target profit) / (Price – Average Variable Cost)
Target profit
the amount (value) of profit that a firm aims to earn within a given time period. The target profit for each level of output can been seen in a break-even chart by comparing the total cost and total revenue lines.
Target price
the amount customers need to pay per unit in order for the firm to break-even or to reach
a particular target profit. The formula used to calculate the target price for break-even is:
Contribution
the difference between the sales revenue earned from
selling a product (its price) and the variable costs of producing the product.
• Unit contribution = P – AVC
Break even analysis
a decision-making tool used to calculate the level of sales needed to cover all costs of production. Any sales beyond the break-even point generate a positive safety margin and hence profit for the business.
Break-even chart
a diagrammatic representation of a firm's
costs, revenues and profits ( or loss) at various levels of output.
Break-even point
the position on a break-even chart
where the total cost line intersects the total revenue line. This is
shown at the point where TC = TR.
Loss
firm's total costs exceed its total revenues
(TC > TR). This occurs at all levels of output or sales below the
break-even quantity.
Total Cost

Total Revenue

Profit

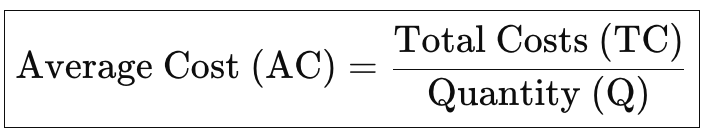
Average Cost
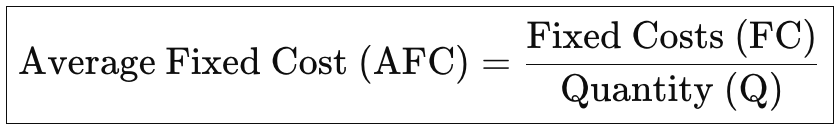
Average Fixed Cost
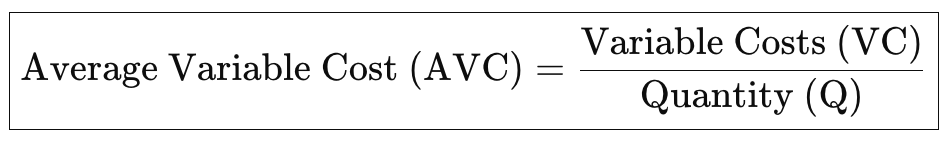
Average variable cost
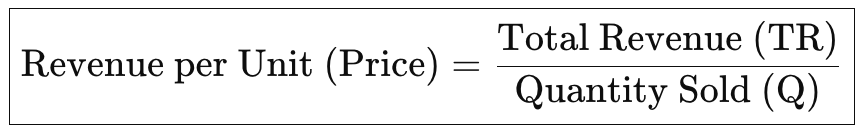
Revenue per unit (Price)
Contribution per unit

Total contribution

Break even output
Margin of Safety

Required Sales (Units) to Achieve Target Profit