GeoSpatial Visualization/Visualizations for Test 2
1/33
There's no tags or description
Looks like no tags are added yet.
Name | Mastery | Learn | Test | Matching | Spaced | Call with Kai |
|---|
No study sessions yet.
34 Terms
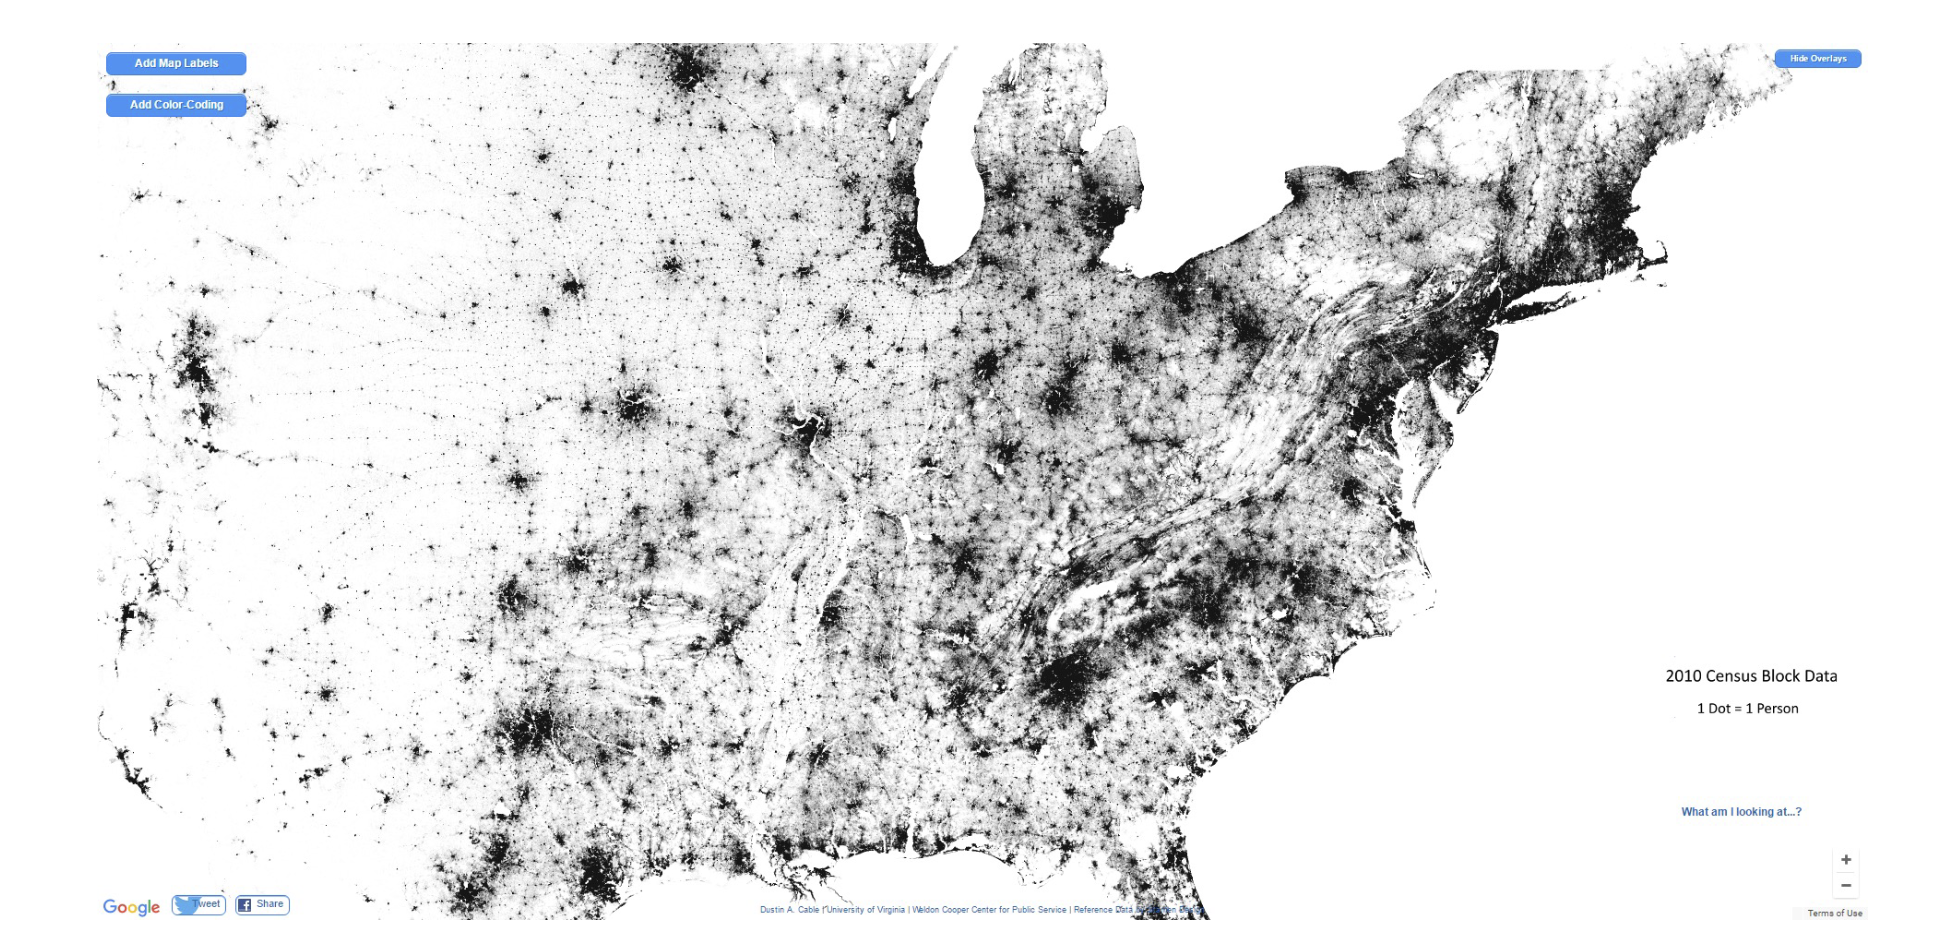
Geospatial visualizations is another name for a
MAP
Maps and other GSViz’s
representations of data that are tied to locations on earth
help us analyze patterns that depend on where things happen
major branch of infoviz
Why do GSViz’s matter?
Some sets make no sense unless viewed in space
maps are the oldest form of viz
they reveal hidden structures (Cholera contaminated pump map by Jon Snow)
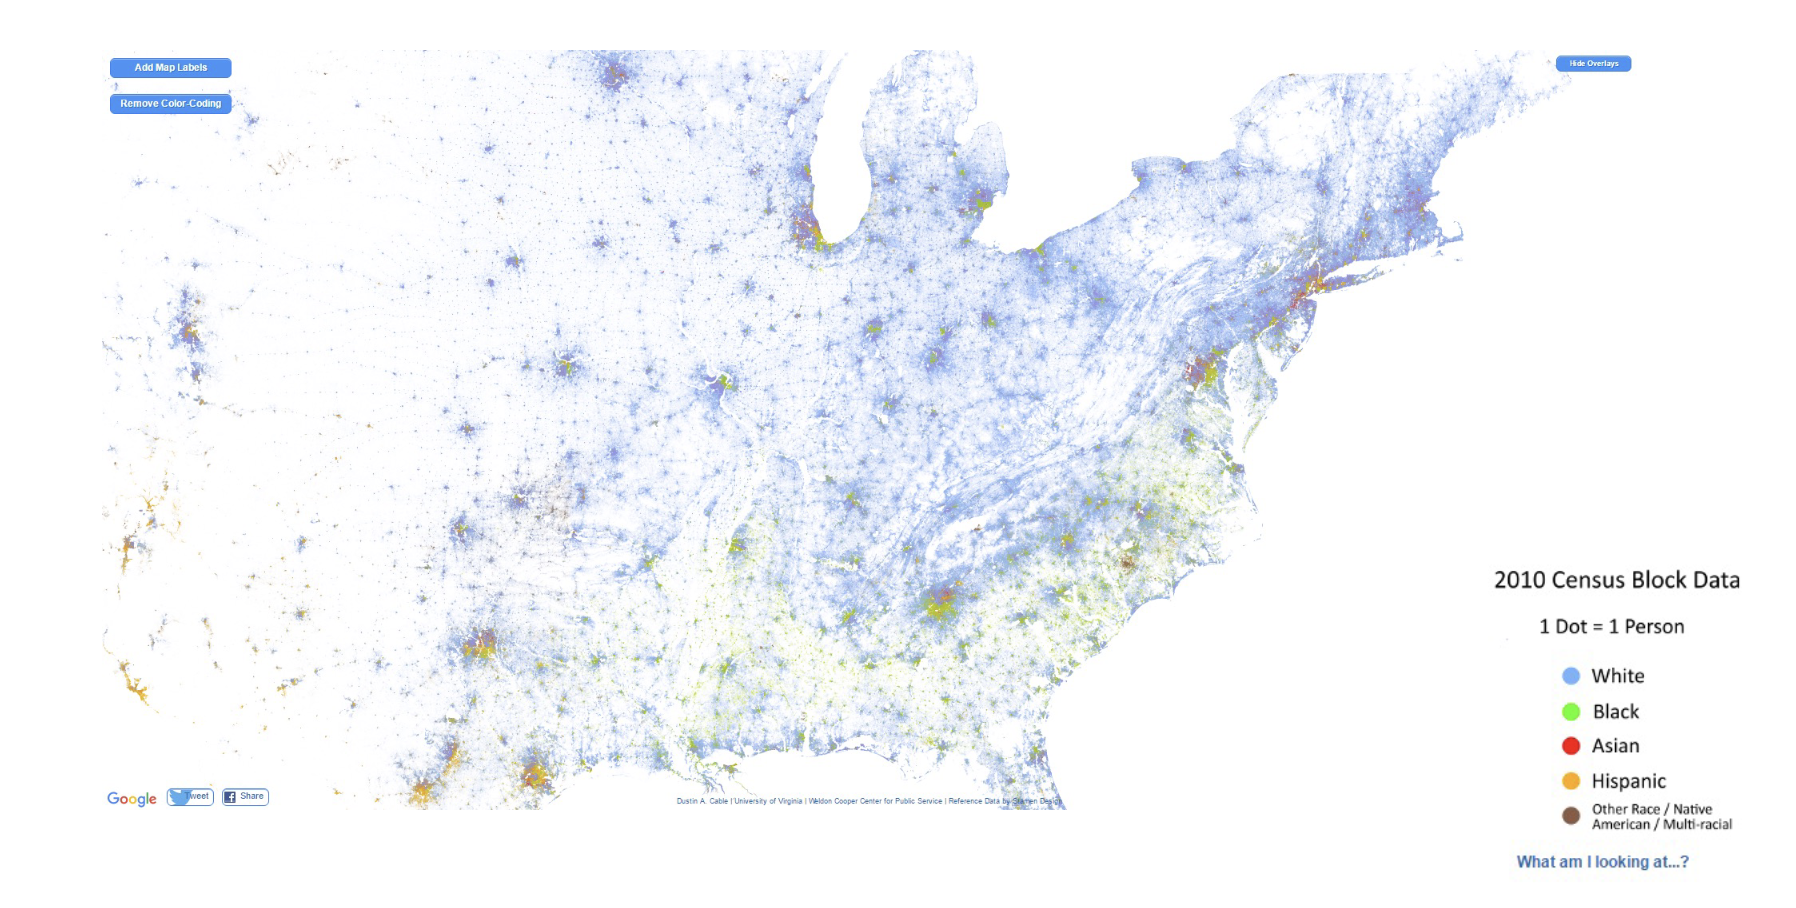
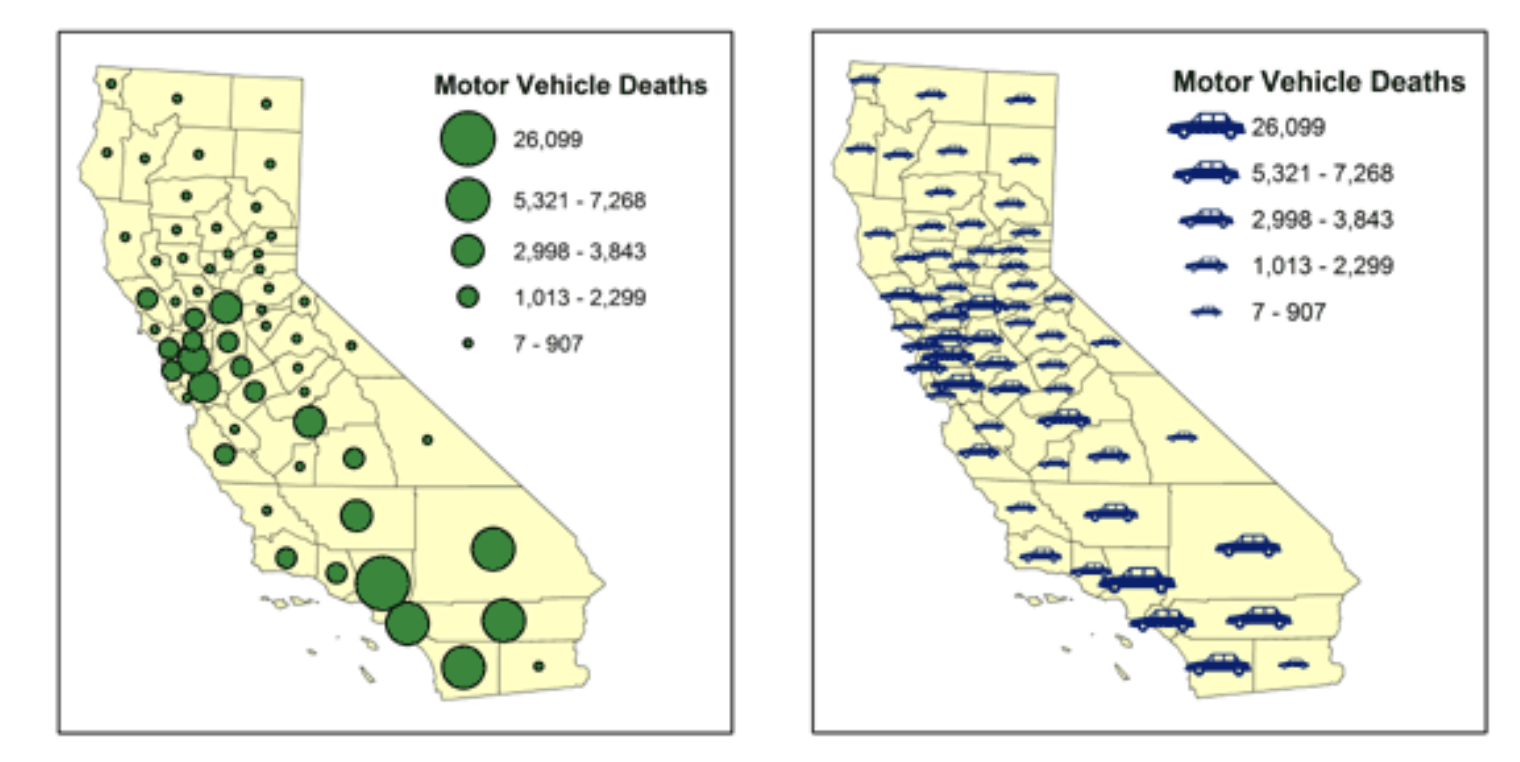
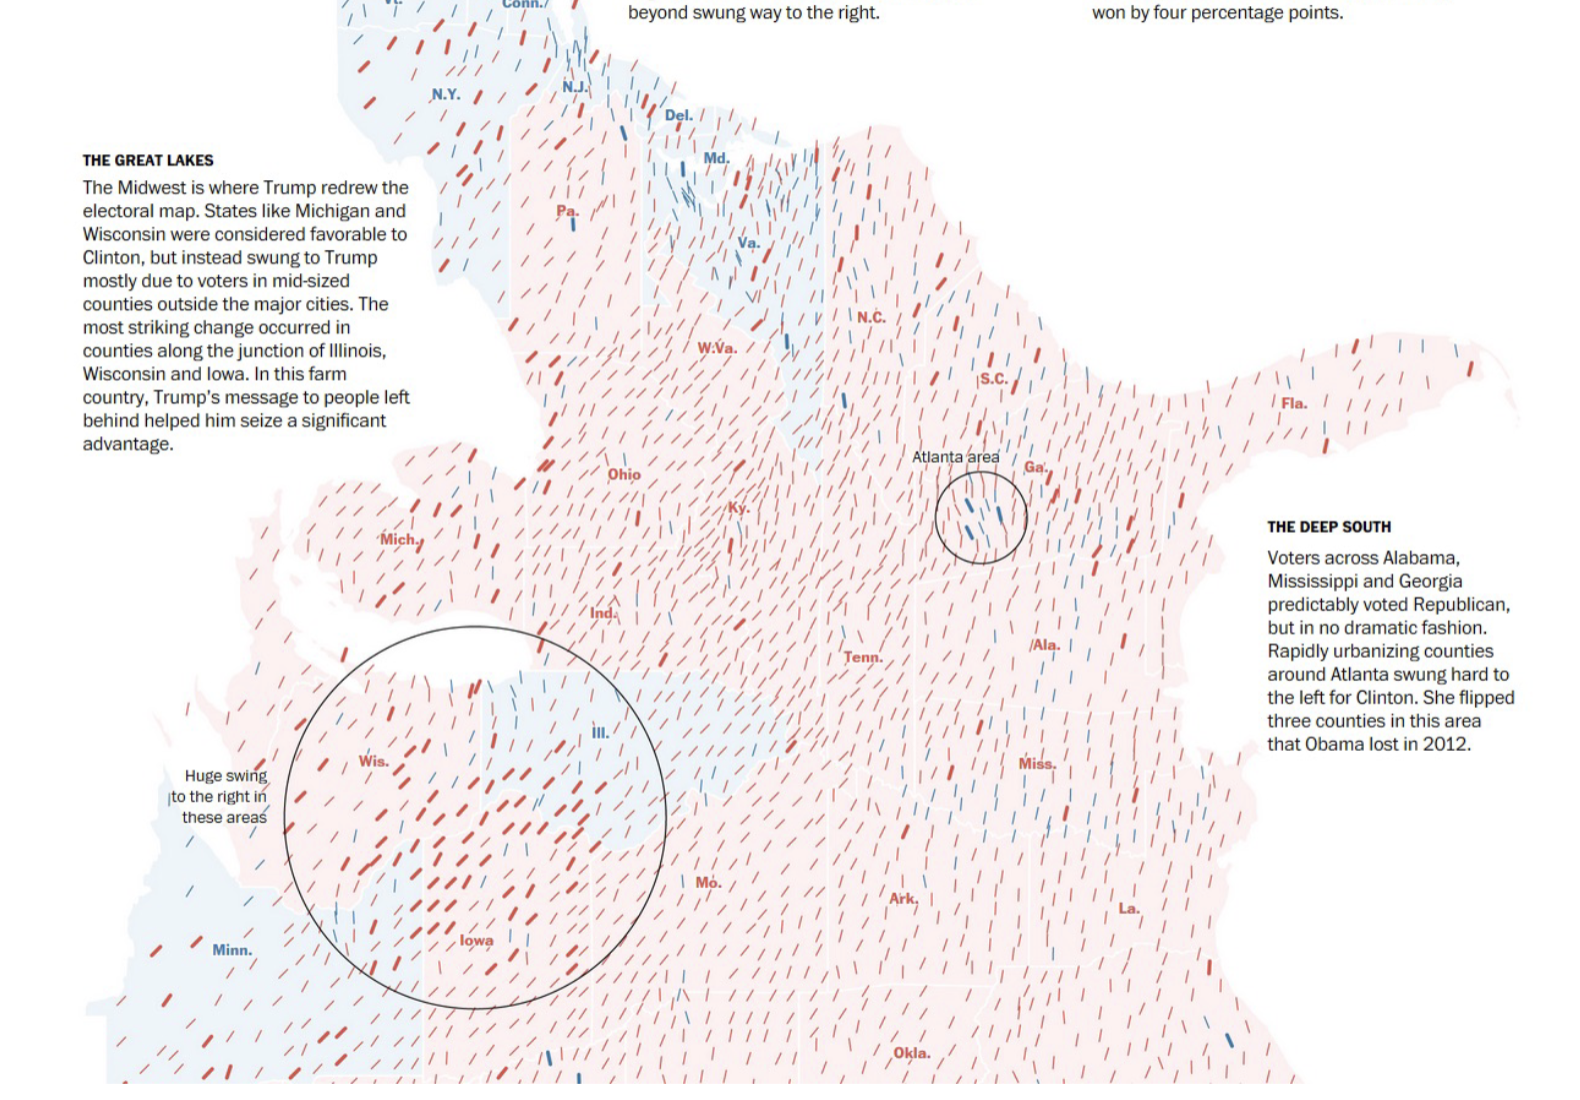
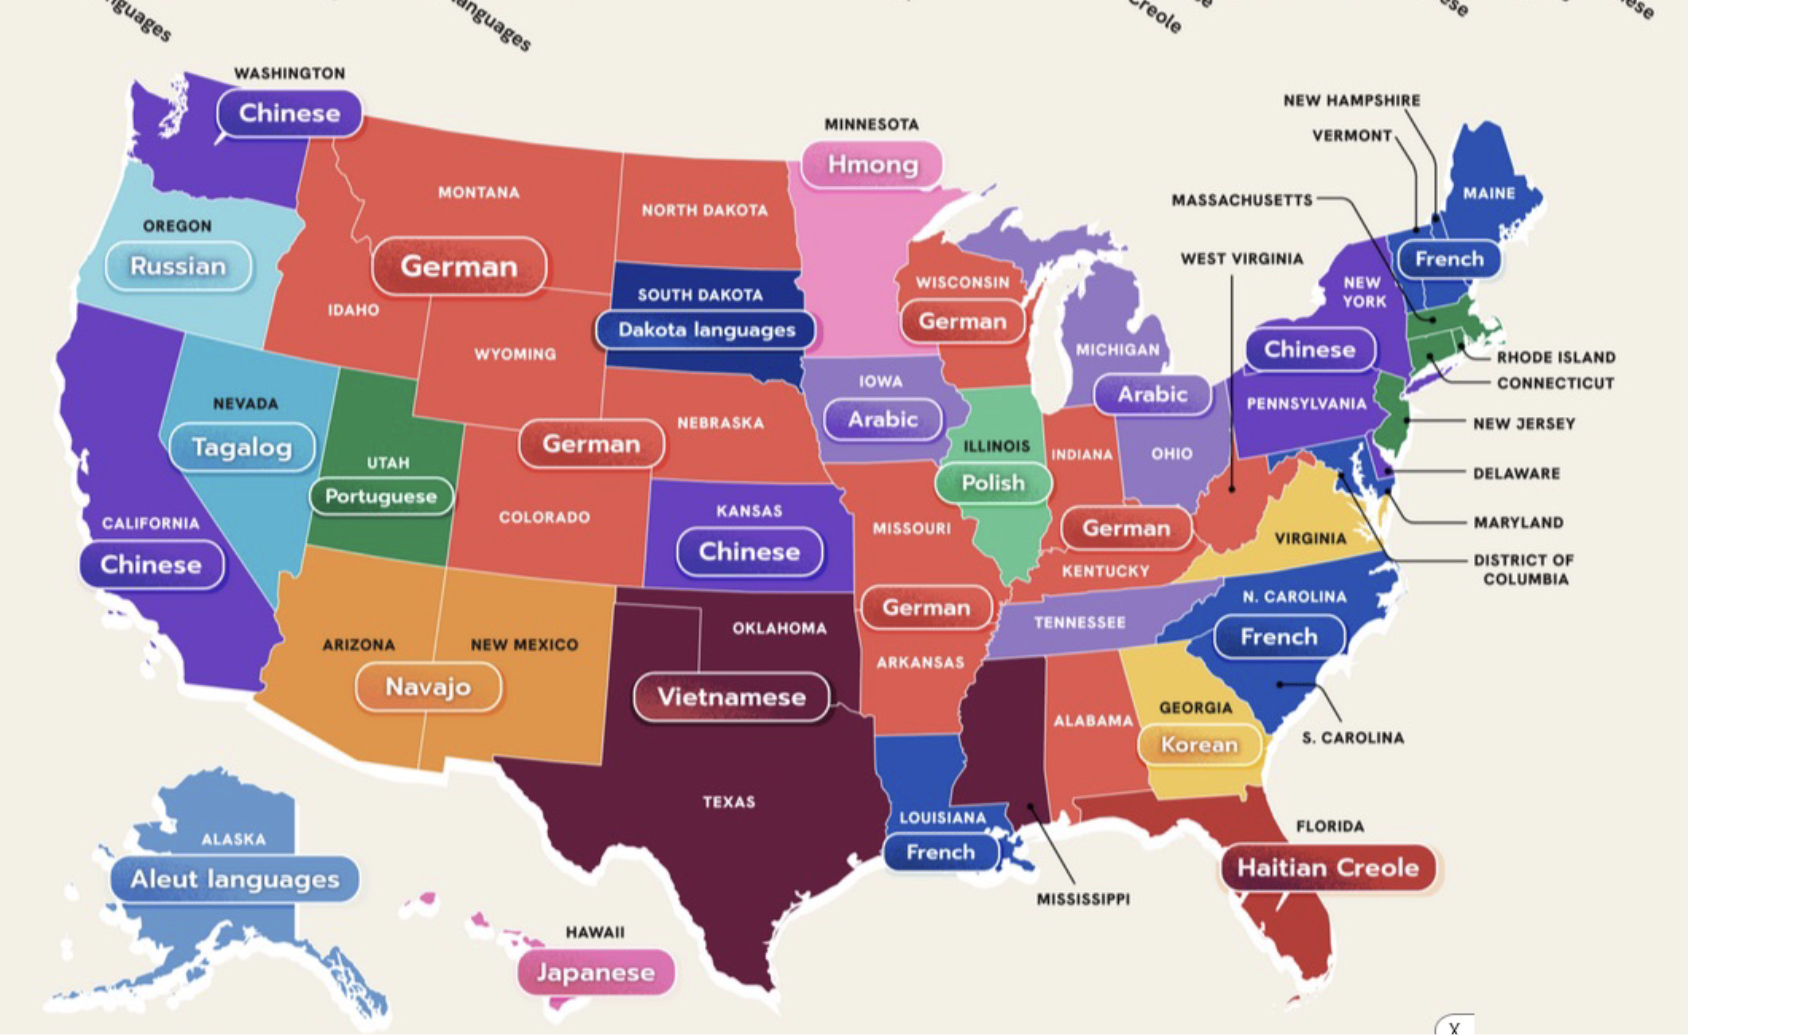
Geometry/Dots and Symbol maps use points, symbols or shapes to represent specific locations, events or amounts
this one is encoded with color as well
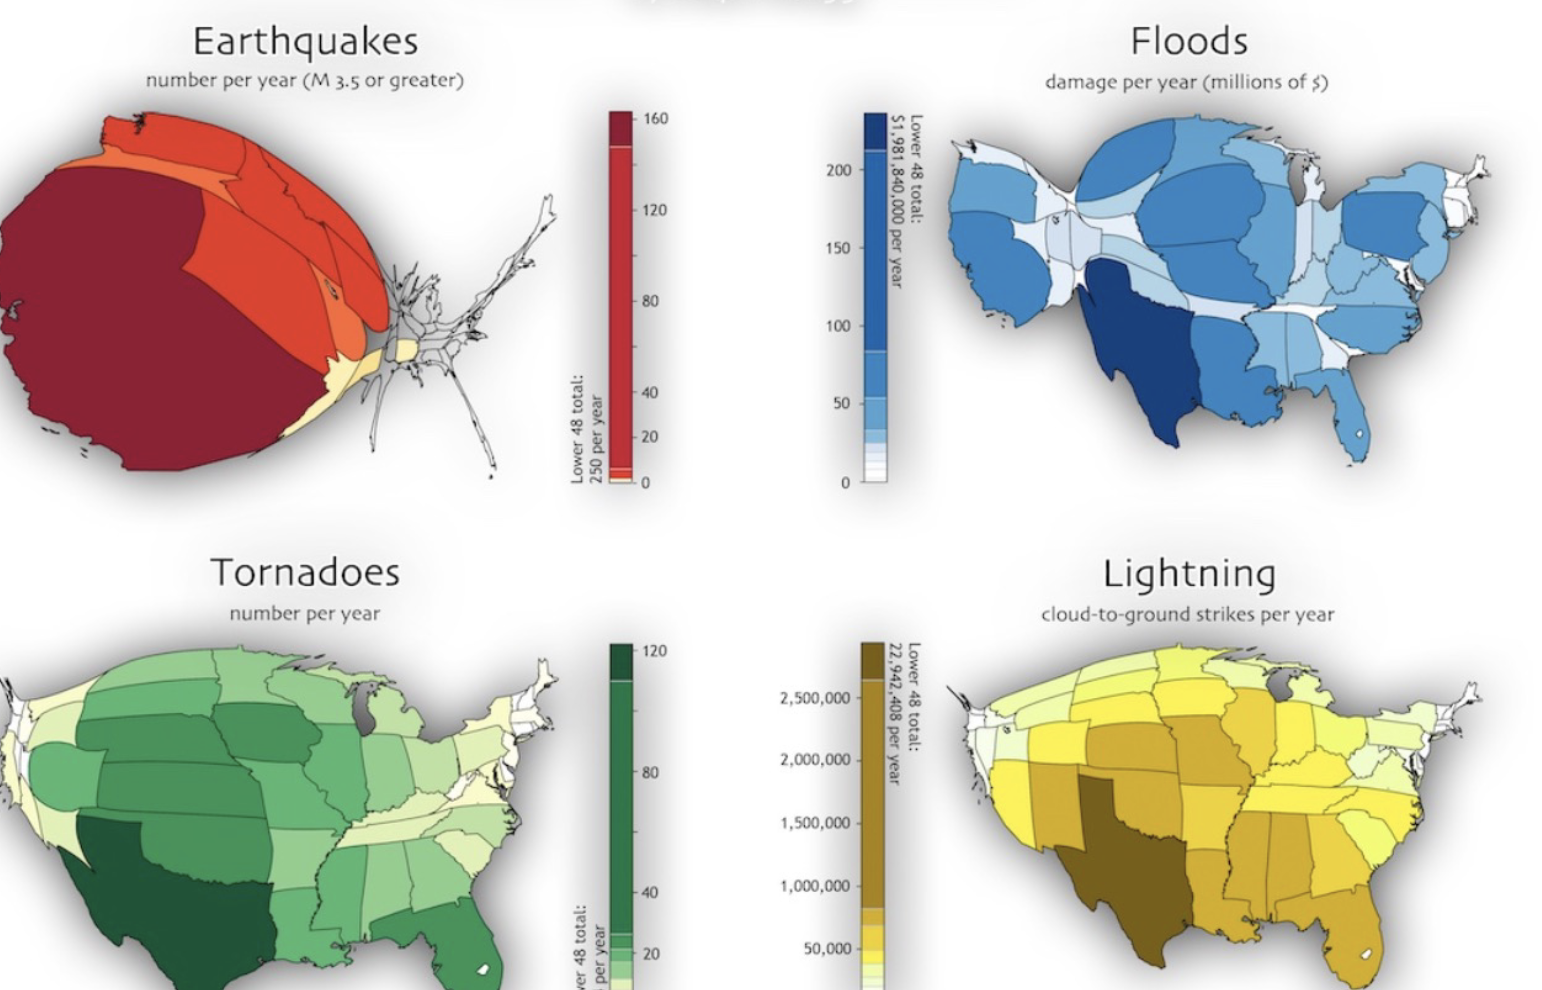
Choropleth: Thematic map where a geographic region is divided into subareas (such as states, counties, or districts), and each area is shaded or colored according to the value of a data attribute.
this chloropleth has geographically weighted stats
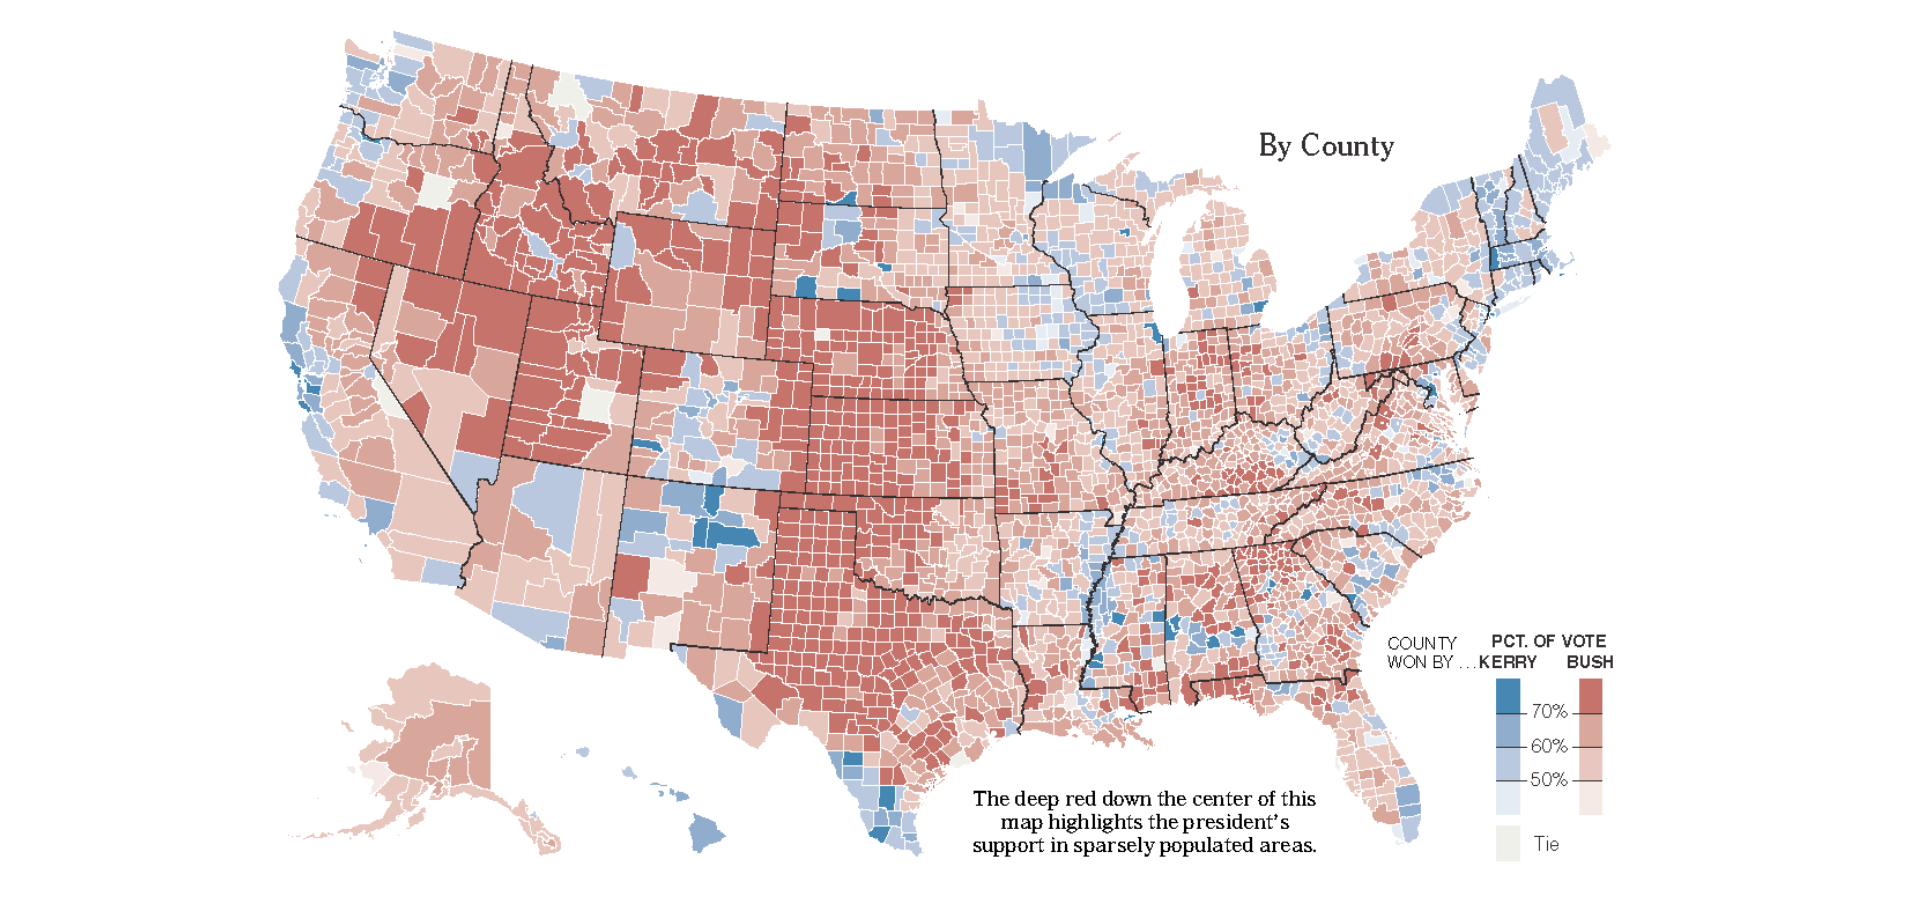
Chloropleth: PROS
Well established visualization
Easy to read and understand
Visually appealing
Chloropleth: CONS
Most effective visual variable (space) used for geographic location and thus cant be used for other things
MAUP (Modifiable Areal Unit Problem)
Visual significance of a colored map region may not correspond to the effects in the data (“Lie factor”)
Color map choice has a huge influence on the result
Zoning Effect
Different boundary placement can create vastly different patterns, even with the same underlying data
Scale Effect
Aggregating data at larger or smaller spatial units changes the observed patterns
Data Binning on maps
Visualize the data distribution and then choose a binning method that aligns with your analytical goal
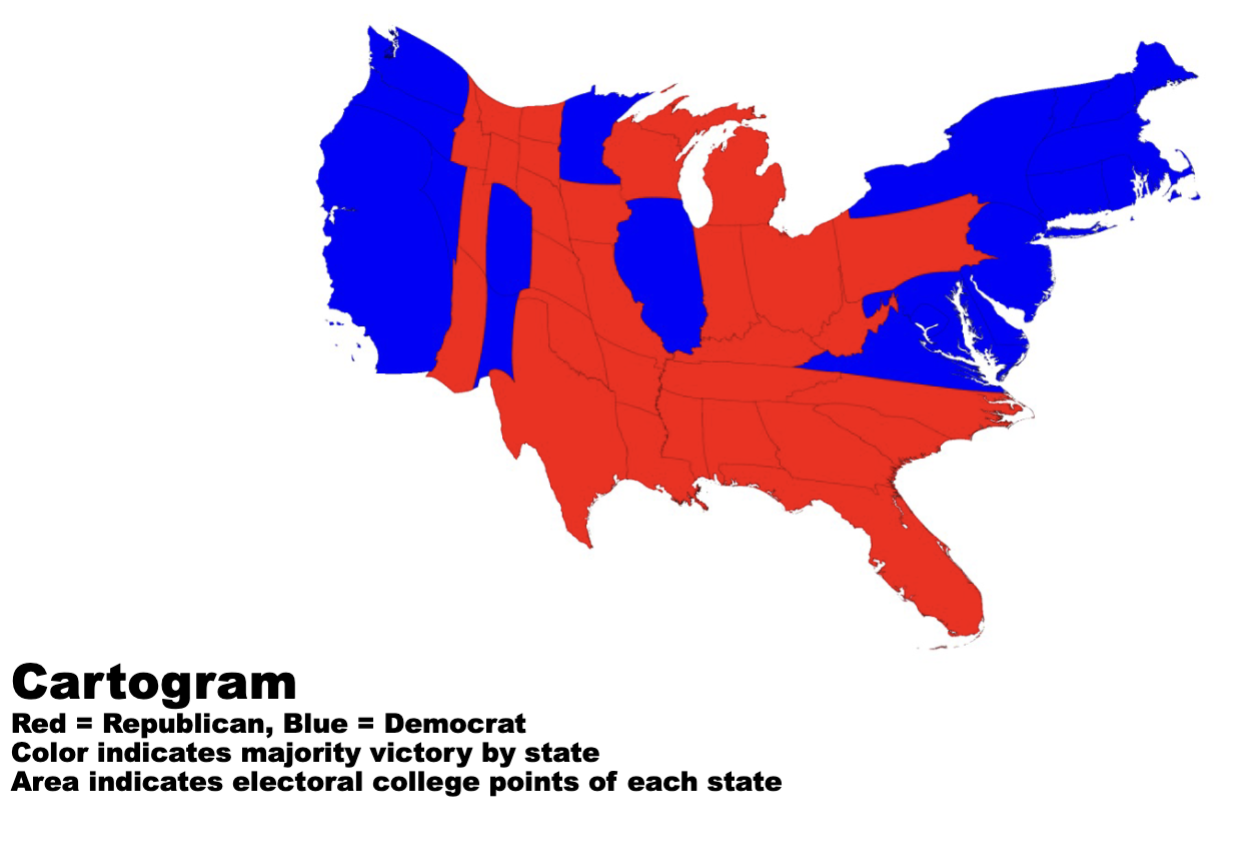
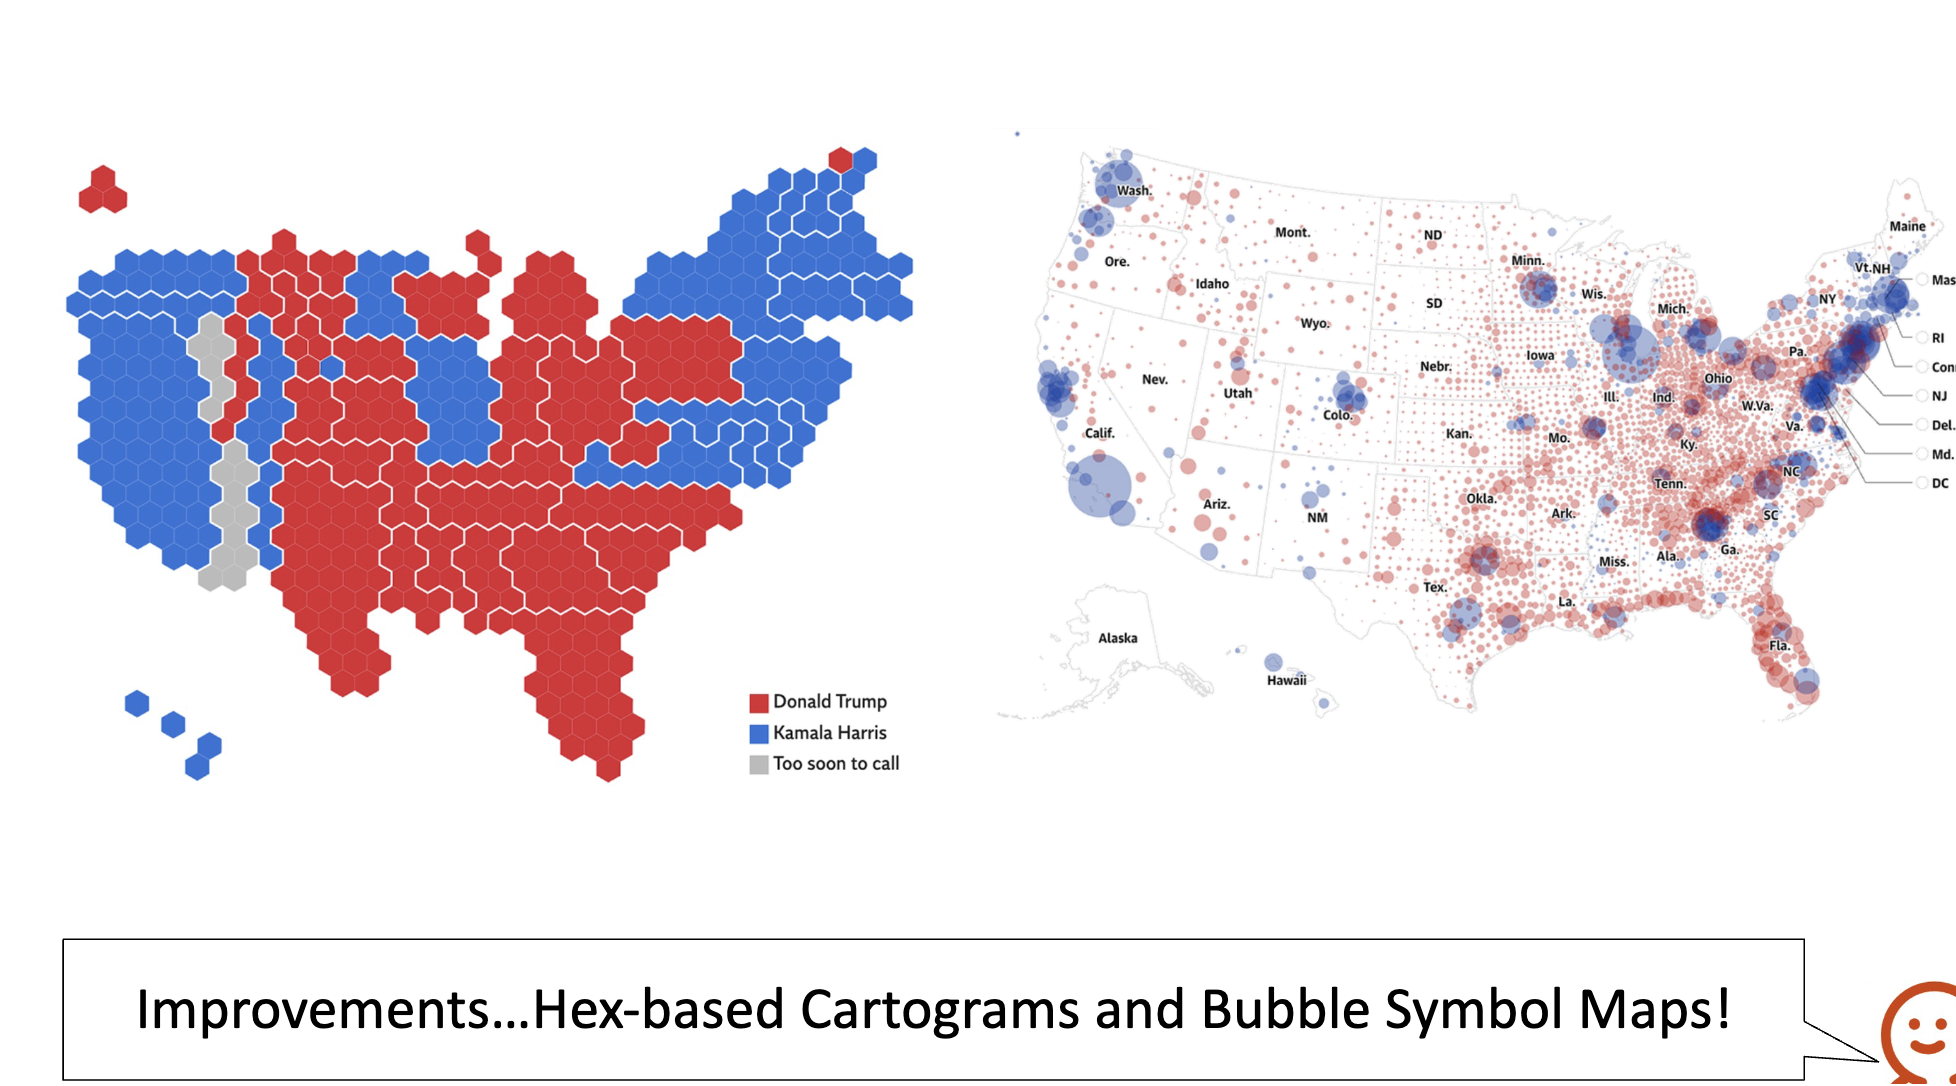
Cartograms: type of map in which the geographic areas of subregions (such as states or countries) are rescaled or distorted so that their size is proportional to a particular data variable, for example, population, income, or electoral votes.
Mercator Projection of Earth
Common way of mapping 3D surface of the Earth into a 2D plane.
Preserves angles, direction, and local shape, which makes it useful for navigation. However, it introduces significant size distortion, especially near poles.
Projection Types
Conformal - Retains local angles & preserves shapes. The area is not preserved.
Equal area – Specific area on map covers the same surface on the globe as on another part of map. Distorts form and angles.
Gnomonic – Projects great circles as straight lines.
Azimuthal – Preserve the direction from a central point
Geo-facet Map
Making each geographic unit the same size. Each cell in the grid represents a specific state, country, or region in roughly the same relative position as on a traditional map.
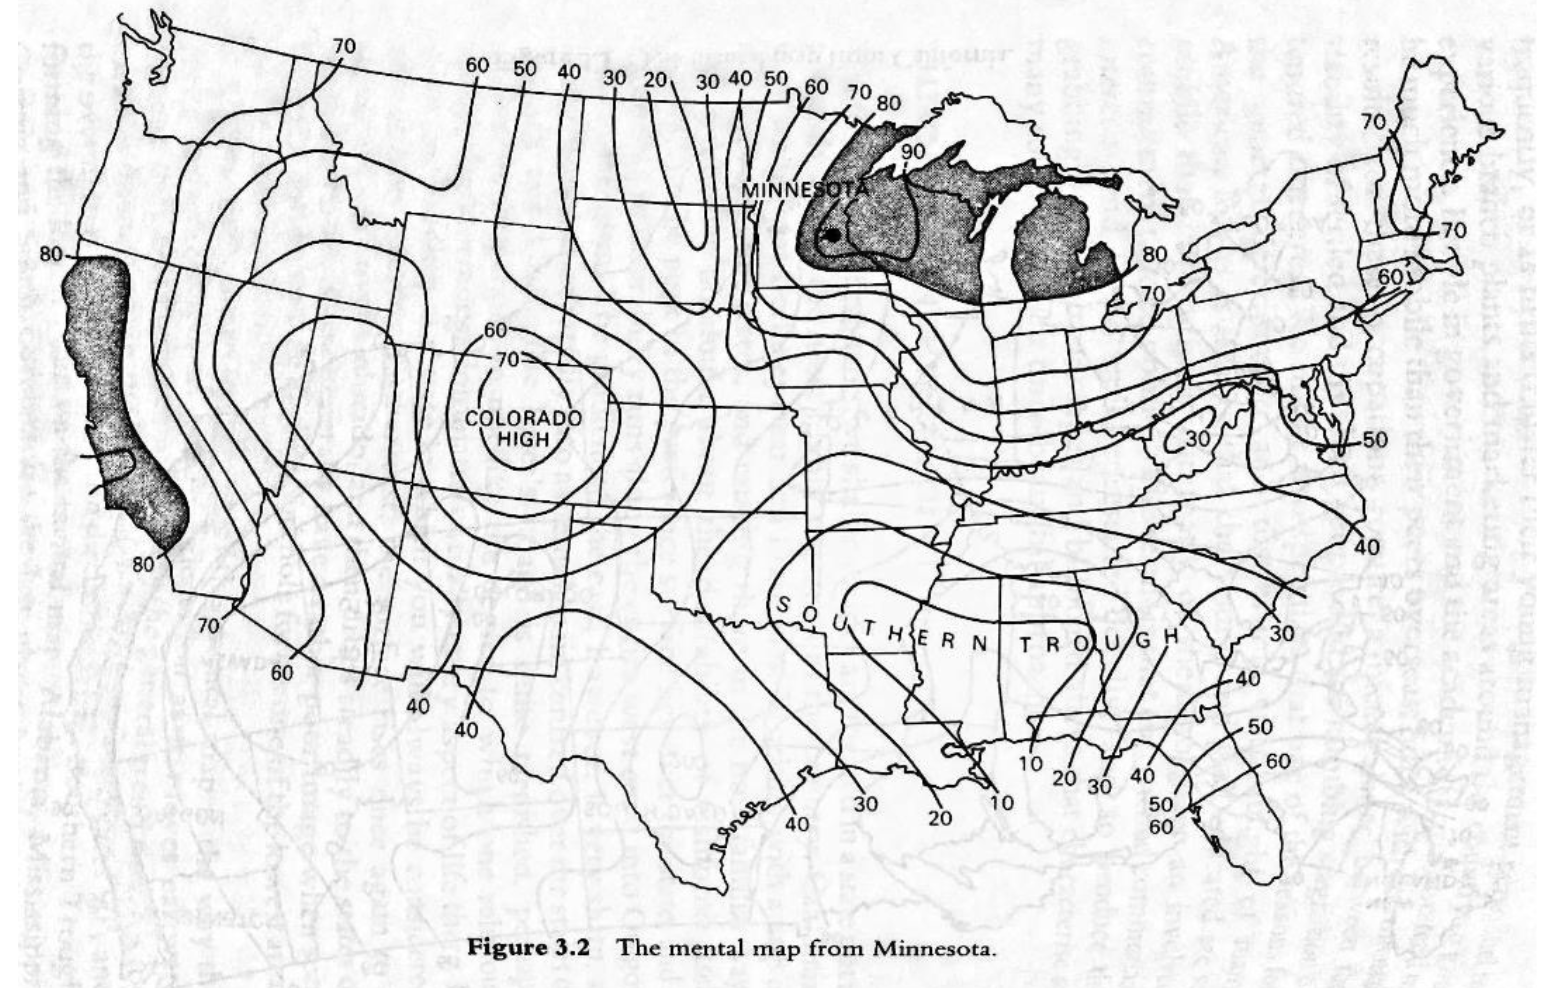
Field/Line Maps
A field map (sometimes shown using line maps such as contour maps or isopleth maps) visualizes a scalar field: a continuous spatial variable in which every location in a geographic region has a single numerical value, such as temperature, elevation, or air pressure.
An isoline map (or contour map) is one way to represent a scalar field using lines that connect points of equal values.
Isocontours can also be used to indicate other features such as the predicted time it will take to get from a single location to all the locations in the vicinity.
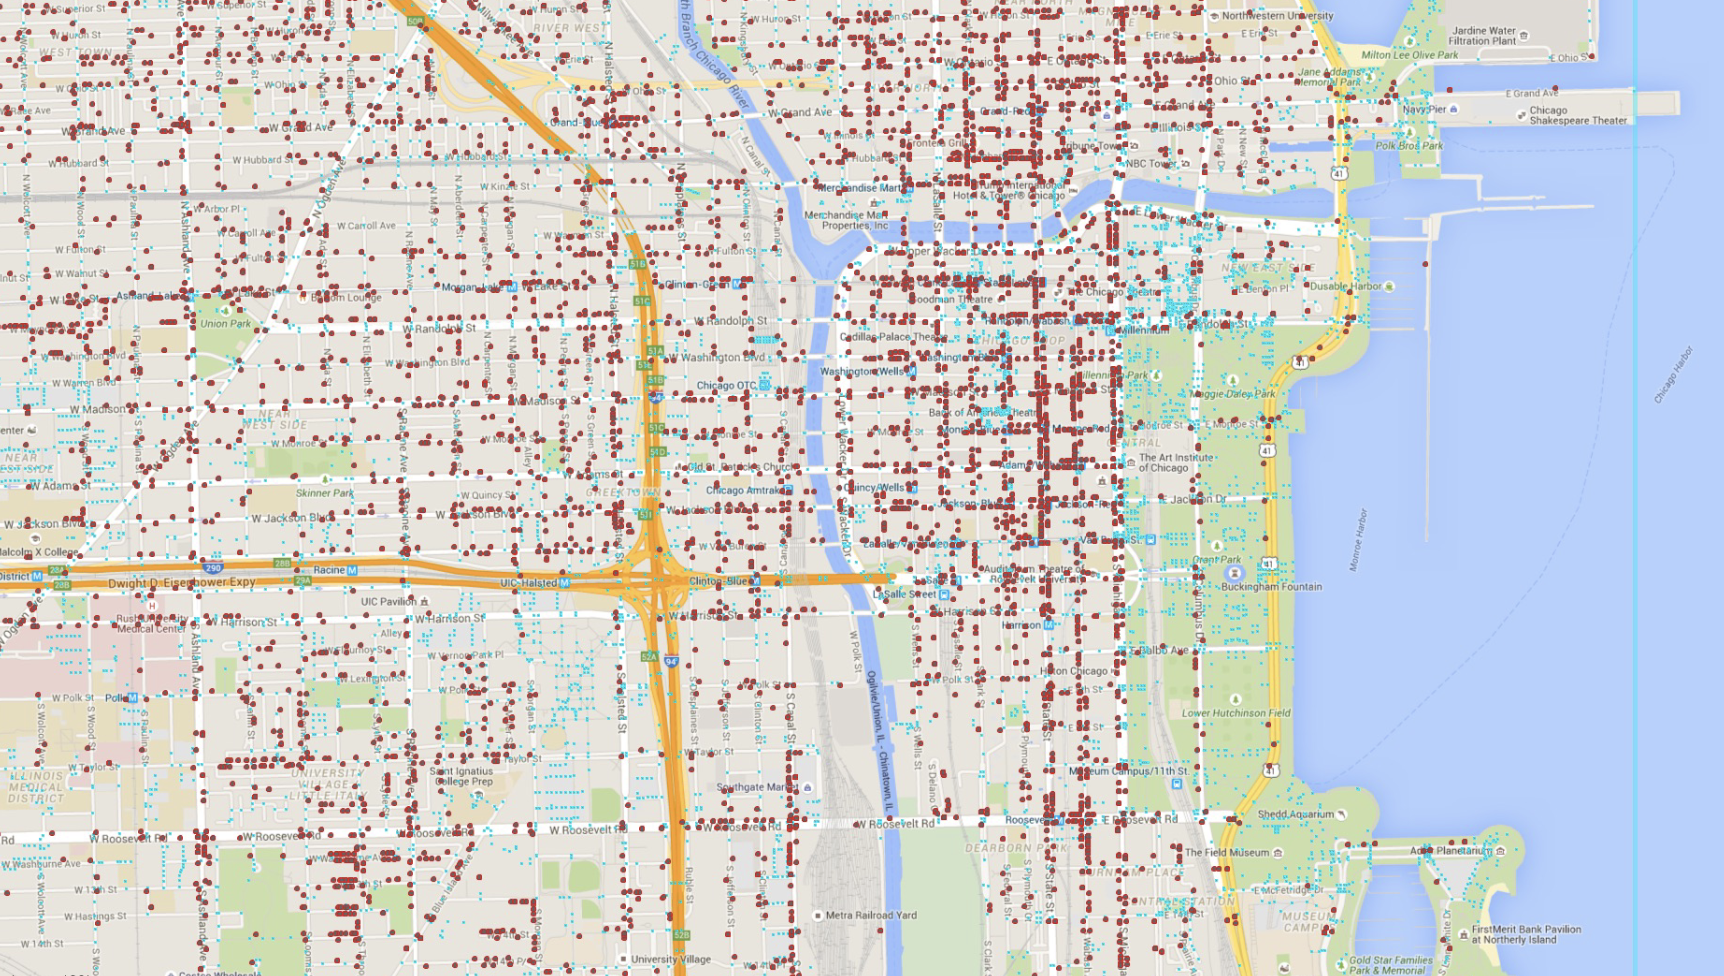
Dot Map
Dot density map

Dot map!
Symbol/Dot map
Dot/symbol map

Chloropleth

Chloropleth
Chloropleth
Chloropleth improvements
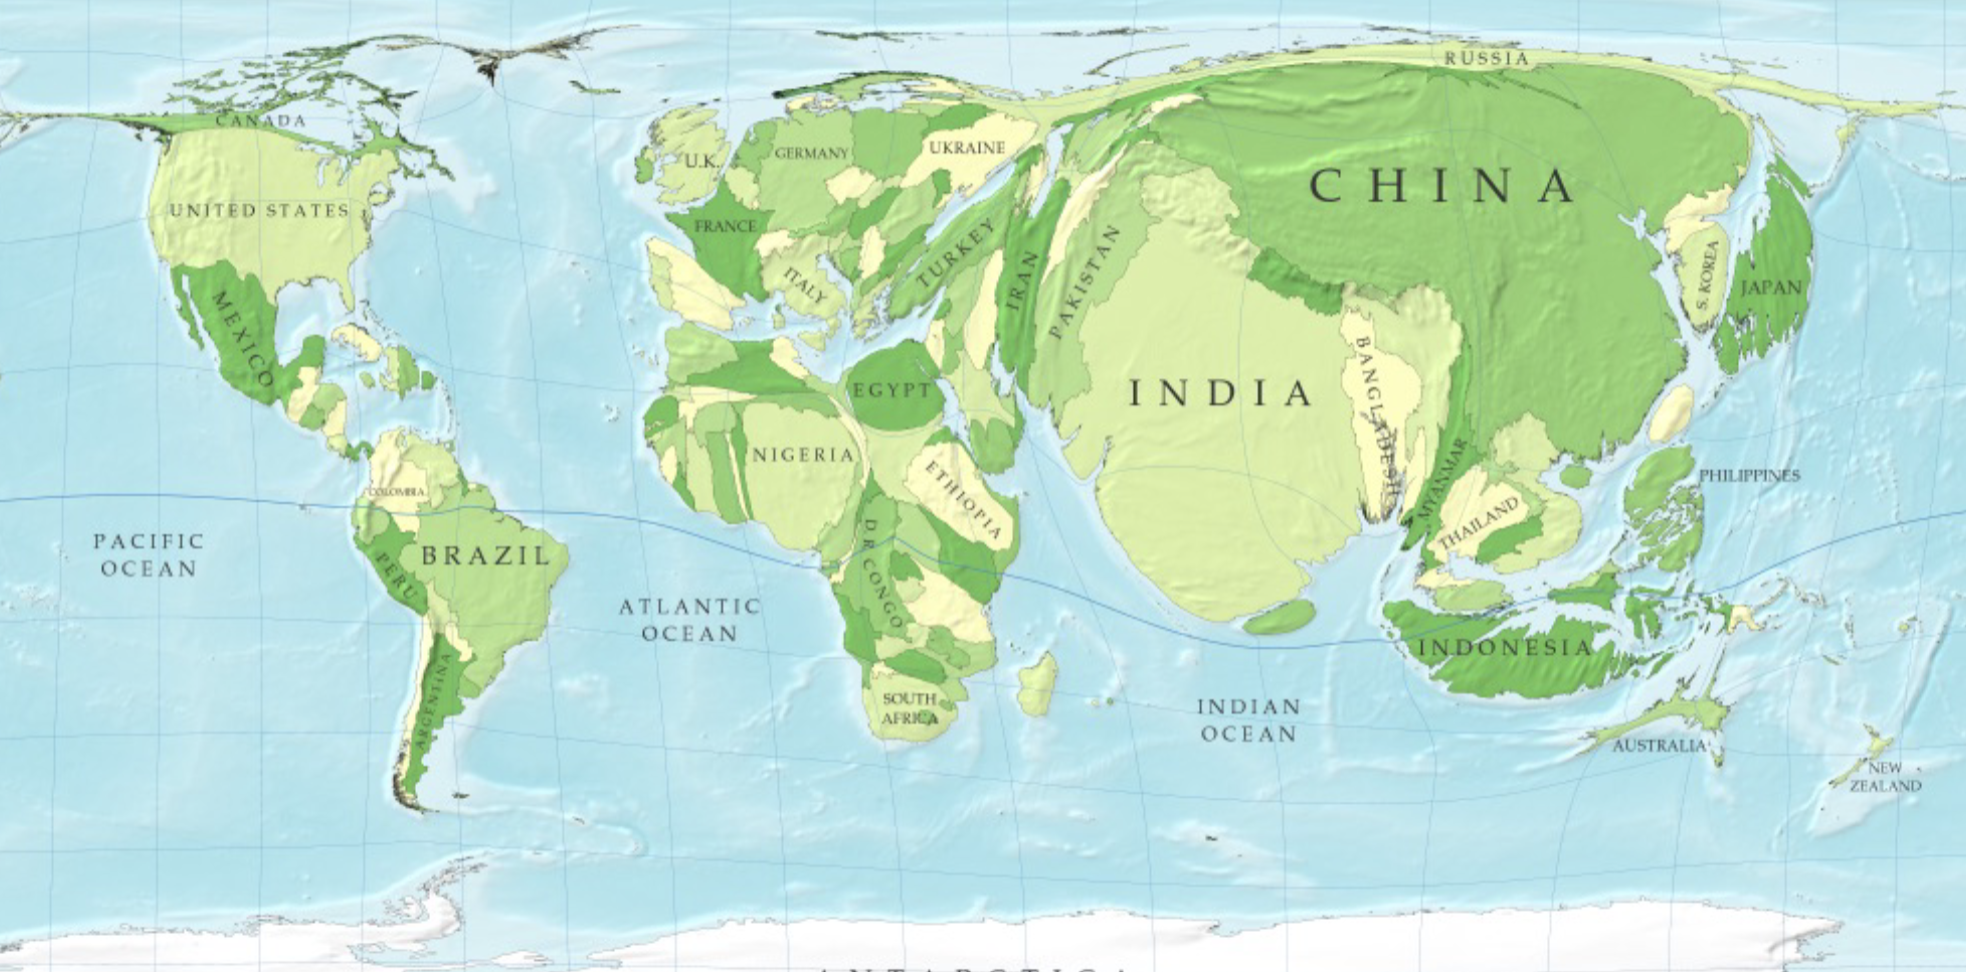
Cartogram
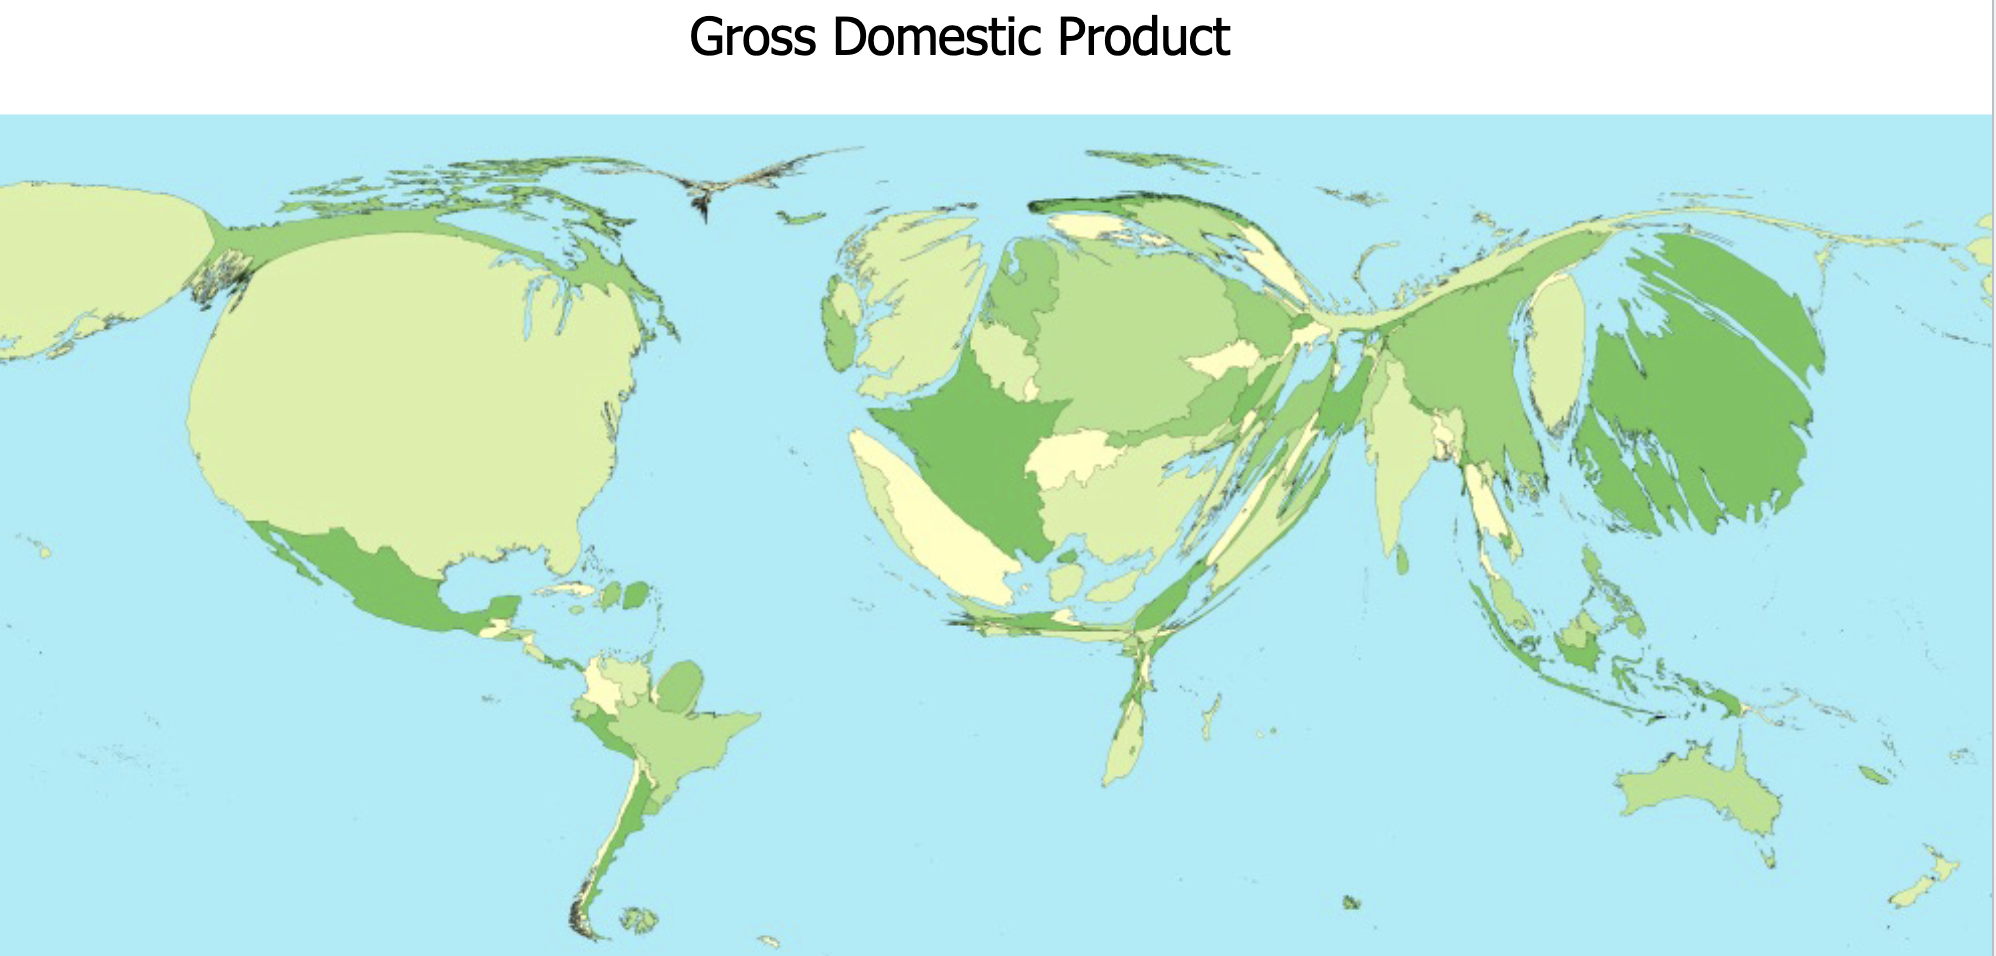
Cartogram
Cartogram
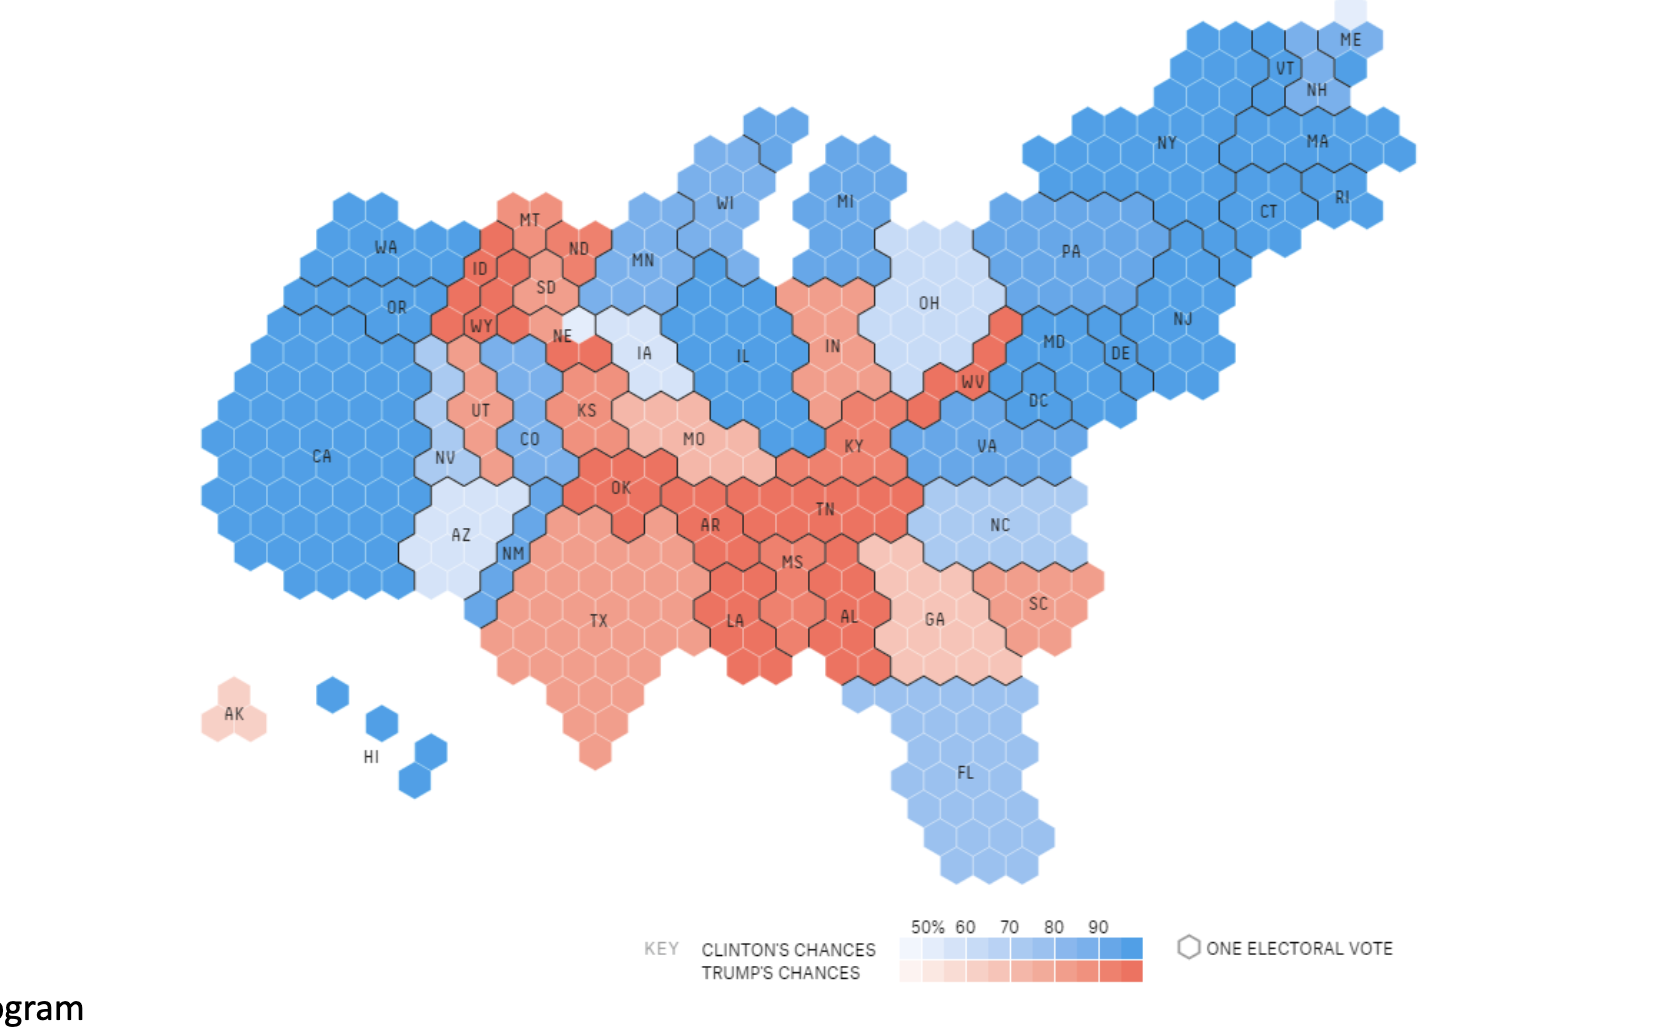
Hex-based
Cartogram
Cartogram is to size distortion as chloropleth is to
color encoding
Scalar fields and isolines
An Isoline Map (or contour map) is one way to represents a scalar field using lines that connect points of equal value. Such contour lines in the image here to show altitude terrain structure.
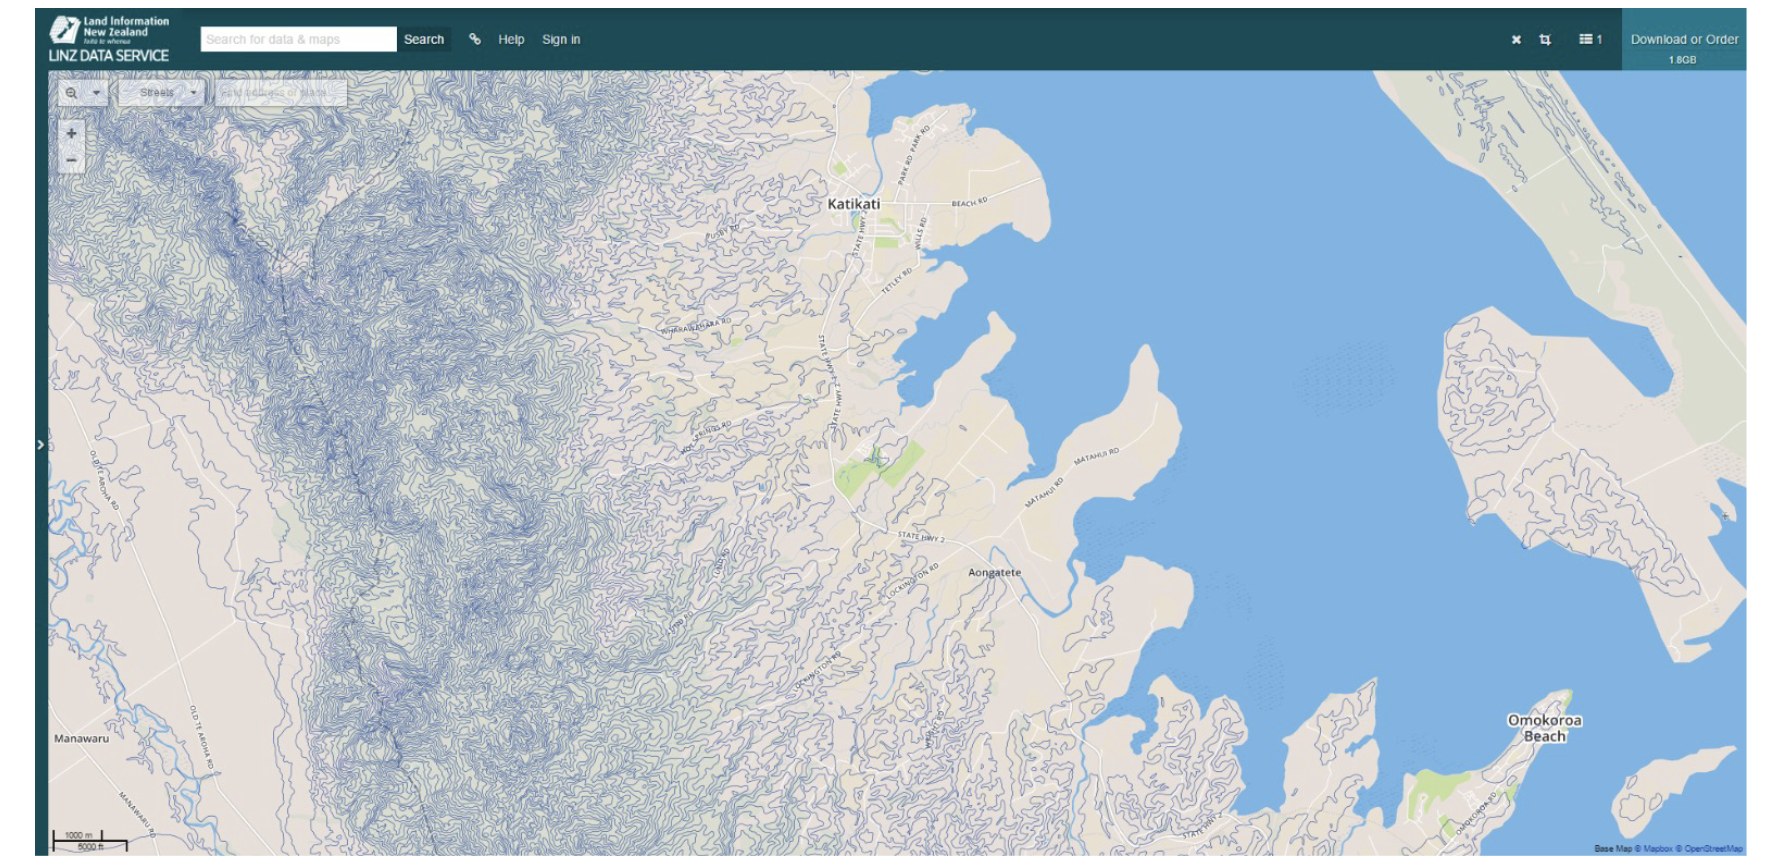
Scalar Fields and Isolines