ATP precuations
1/41
There's no tags or description
Looks like no tags are added yet.
Name | Mastery | Learn | Test | Matching | Spaced |
|---|
No study sessions yet.
42 Terms
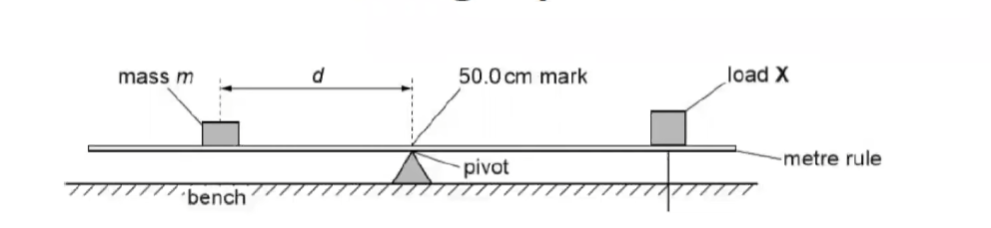
Balancing experiment
Balancing the ruler above the Pivot. Sol: Repeat several times until it balances.
The mass slips over the ruler. Sol: Stick the mass with the ruler.
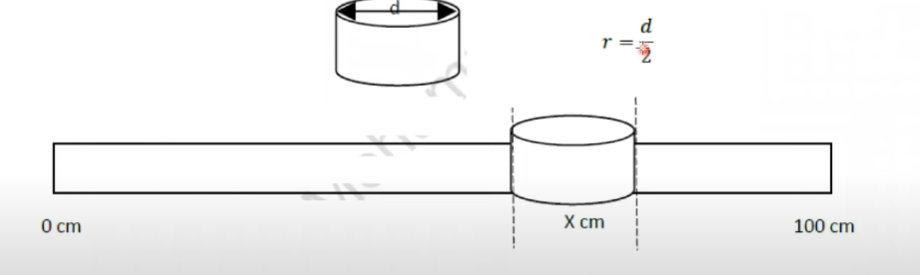
The centre of mass of the cylinder may not above the correct mark.
Sol: Measure diameter/width of object. (d)
Divide d by two to find the centre d/2 cm
Add and subtract (insert point of meter ruler) to d/2
And place the object, so that it lies between 10-d/2 cm and 10+d/2 cm.
Precautions:
Repeat and take average.
Look perpendicular to the scale while taking the reading to avoid parallax error.
Use range of masses.
Centre of mass:
The point at which the meter ruler is balanced above the pivot.
Pendulum experiment
Ensure there are no air currents in the place.
Reset stopwatch. Mark the mean position. Move pendulum to extreme position and mark that point. Release the pendulum from the extreme position and start a stopwatch. Record time for 10 oscillations. To the find the period of oscillation: Time/number of vibrations. Repeat experiment to improve experimental accuracy.
Pendulum experiment precautions
Ensure there are no air currents in the place.
Look perpendicular to the scale of the ruler while taking reading to avoid parallax error.
Repeat and take average.
Control variables: Same size of bob, same shape of bob, same number of swings, same stopwatch, release bob from same height
Calculate time period and frequency of pendulums
Time period: Seconds/cycle
Frequency: Cycle/second
Spring experiment precautions
Same diameter.
Same thickness of spring.
Same range of loads.
Same length of wire.
Same thickness of wire.
Same number of coil.
Same coil placing.
Look perpendicular to the scale while taking readings. To avoid parallax errors.
Wait until spring stops vibrating.
Displacement of water of irregular object precautions
Problem: Sources of Inaccuracy
Parallax error.
The student did not observe from the meniscus of the liquid.
Splashes occurred when immersing the rock.
Air bubbles may be trapped in the rock.
The string used to suspend the rock may be too thick.
The cylinder may not be sensitive enough to detect small volume changes.
olution: Precautions to Minimize Inaccuracy
Shake the rock gently to release any trapped air bubbles.
Use a thin string to reduce measurement interference.
Observe perpendicular to the scale of the cylinder to avoid parallax error.
Always look at the meniscus (the curved surface of the liquid) when taking measurements.
Place the rock gently into the liquid to prevent splashes.
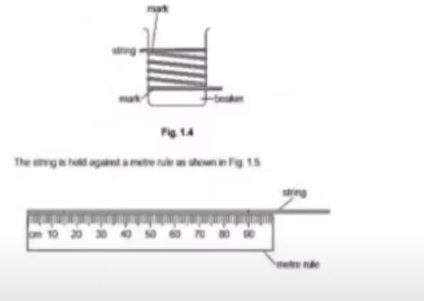
Thickness of string experiment
Divide the measured length by the number of turns (coils) to get the thickness of a single strand of the string.
Inaccuracy Sources:
Thick string.
Turns aren’t tangent.
Thick markings.
Spacing between turns.
Precautions:
Use a thin string.
Ensure tangent turns without spaces.
Use thin marks.
Look perpendicular to the ruler scale.
Use more turns.
Thermal experiment
Precautions
Look perpendicular to the scale of the thermometer while taking the reading to avoid parallax error
Conditions that should be kept constant when this experiment is repeated.
Room temperature.
Starting temperature.
Same volume of water.
Same beaker
Same thermometer.
Air current.
Inaccuracy of this type of experiments
Heat lost to surroundings
Overcoming heat lost
Lag container with insulator.
Cover the container with lid
Initial temperature near to room temperature.
When is object magnified and diminished
Magnified: Image size > Actual size
Diminished Actual size > Image size
Optic experiment two (refraction and reflection)
Suggest possible causes of this inaccuracy
Thickness of lines.
Thickness of protractor.
Thickness of pins.
Pin holes
Thickness of mirror.
Glass in front of mirror causes double refraction.
Precaution
Place the pins as far apart as possible.
Draw the lines so that they are as thin as possible
Look perpendicular while taking readings to avoid parallax error.
Look from the base of the pins:
a. No concern about pins being vertical.
b. Base of the pin lie on the rays.
c. Base is always perpendicular to the plane.
electricity experiment
Inaccuracy
Heating effect of the currant.
Battery used up.
Bad connection of sliding contact
Precautions to overcome heat in the wire
Use a battery of lower electromotive force.
Switch on and off between readings.
Precautions in General
Look perpendicular while taking readings.
Tap on the voltmeter and ammeter to check that pointer free to move.
Take several reading then take overall average
What to do if my points won’t fit on a graph?
If all the points aren't located on the line draw a symmetric line (make the number of points above the line equal to the number of points below the line) as in figure.
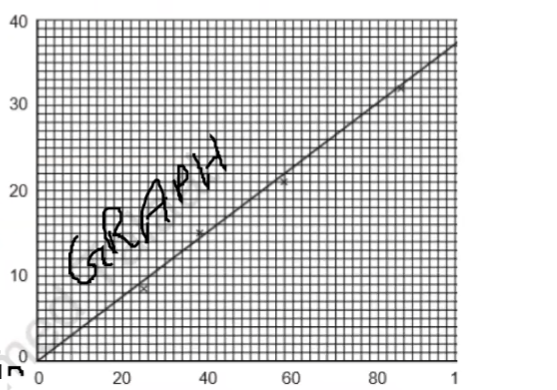
Direct proportionality
The graph of one variable against the other shows a straight line with a positive gradient (slope).
This line passes through the origin (0, 0).
The ratio of the two variables remains constant within the limits of experimental accuracy.
(Within the limits of experimental accuracy" means that in real-life experiments, measurements can have small errors or variations due to limitations in the equipment or the environment. So, while two variables might ideally have a perfectly constant ratio (for direct proportionality) or a constant product (for inverse proportionality), minor variations are acceptable as long as they stay close to this ideal relationship.)
Inverse Proportion
Two variables are inversely proportional if:
The product of the two variables remains constant within the limits of experimental accuracy.
Check if the ruler is vertical to bench
By using a set square
There should be no gap between the set square and meter ruler.
Check if ruler is horizontal to bench
Measure the height of the meter ruler above the bench from both sides
Height should be the same.
Compare two results to know the experimental limit
Divide the greater number by the small one
Multiply the decimal by 100
If the percentage is below 10%, then the results are equal within experimental accuracy.
If the percentage is above 10%, then the are not equal within experimental accuracy
Avoid parallax error when measuring length in pendulum experiment
Hold ruler close to pendulum.
Look perpendicular from the scale of the ruler while taking reading to avoid parallax error.
(b) The student checks the value of the acceleration of free fall g in a text book. The value in the book is 9.8 m/s²
Suggest a practical reason why the result obtained from the experiment may be different
Explanation of cause of inaccuracy in measurement of t or l. e.g. student did not react quickly enough when starting/stopping stopwatch OR difficulty
measuring accurately to centre of bob
Pendulum experiment improvements
Use different length(s)
Repeat timing
Use of a fiducial mark
Increased number of oscillations
Plot a graph using length and time or time²
Why do more oscillations improve accuracy?
Reaction time inaccuracy - Smaller part of total time measured.
Ensure temperatue readings are as accurate as possible
Look perpendicular to the scale of the thermometer whilst taking reading to avoid parallax error.
Ensure thermometer does touch the sides or base of the container.
Avoid delay between adding water and measuring temperature.
Wait until temperature stops rising.
Give reason why temperature of mixture is not equal to average temperature
heat loss to surroundings / beaker OR heat loss / drop in temperature by evaporation
delays in taking readings
Why is measuring the weight of a meter ruler difficult?
Difficulty balancing ruler.
Why might resistance not be constant for a filament lamp during an experiment?
Change in temperature of filament
Filament changes brightness.
A student determines the focal length of a lens.
Use of darkened room / brighter lamp
Mark position of centre of lens on holder
Place metre rule on bench (or clamp in position)
Ensure object and (centre of) lens are same height (from the bench)
Object and lens and screen perpendicular to bench
Move screen (slowly) back and forth to obtain best image (owtte)
Ensure rule is touching object / lens / holder / screen or look perpendicular to ruler
Focal length determination experiment inaccuracies
Difficulty in measuring to centre of lens.
Lamp too dim.
Room too bright.
Image is not quite clear.
A student has done this experiment very carefully, taking these precautions.
She is disappointed to find that her line for the reflected ray is not exactly where she predicts from the theory.
Suggest a practical reason for this.
thickness of lines / pencil / mirror / pins
difficulty of lining up pins and images
Suggest possible variables that the student should keep constant in order to make a fair comparison between the different metals in conduction.
length of rod
diameter / thickness / area (of cross-section) of rod
amount of wax / type of wax
position of Bunsen burner/flame
Possible errors for stretching of spring experiment.
bench surface not uniform
ensure ruler is vertical
use of weight to stop bouncing
How to form a conclusion?
Plot a graph of dependant variable against independent variable to see conclusion.
If multiple subjects are being tested:
Plot a graph of dependant variable against independent variable for each object compare.
Measure diameter of rod
Place the rod between two balls
measure gap in two places and average
use micrometer
It is sometimes difficult to position the load on the scale of the metre rule at
the correct distance d from the pivot. Suggest one change to the apparatus to
overcome this difficulty
suspend load from loop of thread
Explain briefly why the position of the pivot may not be exactly at the 50.0 cm
mark of the rule
center of mass of ruler not at the center
What are the control variable while measure the rate of cooling/heating of
water in a beaker →
Same volume of water
Same initial temperature
Same surface area of container
Same diameter and height of container
Same room temperature
Same material of beaker
Same duration of experiment
reduce temp loss
smaller volume of water
smaller surface area
ray trace errors
rays not thin
pins too thick
difficulty in aligning pins
ray trace precautions
Use thin pencil lines/ thin pins
View bases of pins
Large pin separation
why small separation not good for ray trace
pin separation should be as large as
possible for greater accuracy
no using variable resistor cons
cannot obtain continuous set of value.
less straightforward to change current
more difficult to obtain a greater number of values
Why do we use graphs as an accurate method of determination?
A straight line is a way of taking an average.
Anomalous results can be seen and ignored.
Measuring cylinders
Can only be read to the nearest 1 or 2 cm³
View scale from bottom of meniscus for accuracy.