people of the uk
1/108
Earn XP
Description and Tags
Name | Mastery | Learn | Test | Matching | Spaced | Call with Kai |
|---|
No analytics yet
Send a link to your students to track their progress
109 Terms
state 2 non-EU countries that the UK trades with the most
China
United States
state which EU country the UK trades the most with
Germany
state what the UK trade balance is with France
-£6.2 billion
state how UK imports from Norway have changed since 2014
decreased
state what % of UK exports are in services
80%
state what % of UK exports are physical goods
20%
describe the UK’s trade relationship with Germany
large trade deficit
import a lot more than we export
still one of the UK’s main trading partners
import the most good from this country
due to its close proximity geographically, causing imported goods to be cheaper
describe the UK’s trade relationship with the United States
UK earns the most through trade with the US
UK and US have a ‘special relationship’
caused by both countries sharing similar political views, lifestyles and language
UK trade with the US is varied and includes lots of services
describe the UK’s trade relationship with Japan
despite Japan’s large manufacturing based and integral role in global finances, the UK doesn’t trade with them much
Japan is not close to the UK physically or politically
Japan has established strong trade links with countries in closer proximity
describe the UK’s trade relationship with China
even though China is not in the EU, it has one of the largest economies on the planet
China has the largest manufacturing economy globally
the UK imports lots of relatively cheap goods from China
state total UK imports, 2016
£600 billion
state total UK exports, 2016
£550 billion
state UK trade balance, 2016
-£50 billion
describe the primary sector
procuring raw material from the natural environment
describe the secondary sector
conversion of raw materials into something more valuable either by addition of parts and/or time
describe the tertiary sector
providing service
describe the quaternary sector
providing information services, consultancy and research
describe the % change in people employed in the tertiary sector in the UK, 1986-2016
70% (1986) → 83% (2016)
state what the average wage per hour is in the UK
£12
describe why people on lower incomes are struggling financially in the UK
food, bills and petrol prices have increased
whilst wages remain frozen
describe what the overall impact of economic inequality is on the UK’s economy
less disposable income means less money spent overall
resulted in a weakened economy
state what a Gini Coefficient of 1 means
reflects a greater uneven spread of household income
causing perfect inequality
state what a Gini Coefficient of 0 means
more even spread of household income
reflects perfect equality
describe the UK’s economy in the past
UK economy was based on activities that took place within the country and Commonwealth countries
the growth of globalisation meant the UK economy is now more dependent on other countries
describe deindustrialisation in the UK
UK has experienced deindustrialisation
as there has been a decrease in the amount of manufacturing taking place within the country
and a growth in the tertiary and quaternary sectors
traditional industries, such as ship buildings and textiles, have declined
explain why traditional industries have decreased in the UK
global shift in manufacturing to new emerging economies (NEEs) where wages are lower, working hours are longer and trade unions are sometimes banned
increase in mechanisation
describe what the ‘poverty trap’ is
when some born into poverty is not able to escape due to the circumstances of their lives
and the fact that they may not receive the same resources or opportunities that others more privileged might
state what Free School Meals are (FSMs)
measure of pupil deprivation
subsidy given to schools for pupils from deprived backgrounds
to help provide them with free school lunches and other resources to support their education
state which regions have the highest educational attainment in the UK
London
East
South East
state which regions have the lowest educational attainment in the UK
North East
North West
Yorkshire and Humber
state factors that increase life expectancy
access to proper healthcare
access to shelter and food
eating a balanced diet
access to a stable income
good education
living in affluent areas
good hygiene
good childhood
not smoking or drinking alcohol
state factors that decrease life expectancy
lack of proper education
living in poverty/homeless (-25 years)
lack of proper healthcare
lack of access to food and shelter
unstable income
moderate drinking or smoking
bad childhood
poor sanitation
state what the average gap in life expectancy is between the most and least deprived areas in England
9.3 years for males
7.3 years for females
describe how transport infrastructure projects help to develop parts of the UK
allow people to travel within the country whilst inviting more global migrants and tourists - attracts more funding and resources
provides rapid transport within nation - increases accessibility
state how much the Department of Transport spend per person in the North under a Conservative government
£280
state how much the Department of Transport spend per person in London under a Conservative government
£1,870
state what Crossrail was
project to build the new Tube line named after the Queen
state the total expenditure on the Crossrail
£4.6 billion
2016-2021
state how much the Department of Transport spend per person in the north-east under a Conservative government
£300
state how much the Department of Transport spend per person in the north west under a Conservative government
£290
state how much the Department of Transport spend per person in Yorkshire and Humber under a Conservative government
£250
state the positive of HS2
commuter - travelling to London for leisure and work is faster, people can be more productive
government - development of Northern Powerhouse, improves connectivity, eases congestion on roads, aids zero carbon emissions goals set for 2050
business owner (London) - more people feel inclined to commute to London and spend more money in the city
state the negative of HS2
homeowner - already have transport infrastructure, rail system will take up space
tax payer - waste of money on pre-existing infrastructure during a cost of living crisis
commuter - tickets are expensive, HS2 doesn’t benefit the lower class commuters
environmentalist - deforestation will have to occur during construction, disrupts natural environments
business owner (Birmingham) - people will be leaving Birmingham during peak spending and working hours - means less money is spent overall in Birmingham
evaluate the HS2 project
POSITIVE
said to increase productivity and speed of transport
NEGATIVE
causes extinction, deforestation, destruction of natural habitats as it cuts straight across the country
focus on south/south east and not on the north/north west - increases inequalities nationally
people from Birmingham might start commuting to London more and taking jobs in London whilst benefitting from lower house prices in Birmingham
government funded using tax payer money
state physical characteristics that can affect development of parts of the UK
relief
distance from the EU
state what the north-south divide is
difference in average household wealth
between the north and the south of the UK
state which region in the UK is the wealthiest
south-east
state what HS1 is
high speed rail system in the UK
that connects London to Europe
via the Channel Tunnel
state what HS2 is
high speed rail system in the UK
planned to connect London with Birmingham and other cities in northern England
it’s supposed to encourage economic growth away from London
to even out the UK’s north-south inequalities
state the cost of HS2
2015 - predicted to cost £56 billion
2021 - predicted to cost £100 billion
state where the 2 most consistently overcrowded are in the UK
Manchester
state what the Northern Powerhouse Rail is
scheme to create better links between northern cities
describe the benefits HS2 will bring in if it runs the complete route
brings in £2.30 for every pound invested
describe the benefits of the Northern Powerhouse
£2.70 for every pound spent
describe stage 1 of the Demographic Transition Model (DTM)
birth rate - high
death rate - high
natural increase - stable or slow increase
describe reasons for changes in birth rates in stage 1 of the DTM
many children needed for farming
high infant mortality rate
religious/social encouragement
lack of access to contraception and family planning
describe reasons for changes in death rates in stage 1 of the DTM
disease
famine
poor medical knowledge
high infant mortality rate
describe stage 2 of the Demographic Transition Model (DTM)
birth rate - high
death rate - falling rapidly
natural increase - very rapid increase
describe reasons for changes in birth rate in stage 2 of the DTM
many children needed for farming
high infant mortality rate
religious/social encouragement
lack of access to contraception and family planning
describe reasons for changes in death rate in stage 2 of the DTM
improvements in medical care
improvements in water supply and sanitation
decreasing infant mortality rate
describe stage 3 of the Demographic Transition Model (DTM)
birth rate - decreasing
death rate - decreasing, more slowly
natural increase - increasing, more slowly
describe reasons for changes in birth rate in stage 3 of the DTM
improved medical care and diet
less need for children
describe reasons for changes in death rate in stage 3 of the DTM
improvements in medical care
improvements in water supply and sanitation
decreasing infant mortality rate
describe stage 4 of the Demographic Transition Model (DTM)
birth rate - low
death rate - low
natural increase - stable/slow increase
describe reasons for changes in birth rate in stage 4 of the DTM
family planning
good health
improving status of women
marriages occurring later on
describe reasons for changes in death rate in stage 4 of the DTM
good health care
reliable food supply
describe stage 5 of the Demographic Transition Model (DTM)
birth rate - very low
death rate - low
natural increase - slow decrease
describe reasons for changes in birth rate in stage 5 of the DTM
family planning
good health
improving status of women
marriages occurring later on
describe reasons for changes in death rate in stage 5 of the DTM
good health care
reliable food supply
state the population pyramid of stage 1 of the DTM
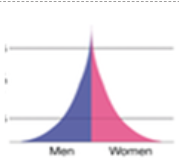
state the population pyramid of stage 2 of the DTM
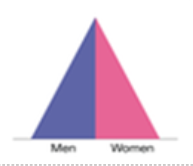
state the population pyramid of stage 3 of the DTM
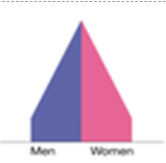
state the population pyramid of stage 4 of the DTM
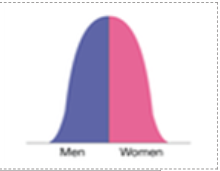
state the population pyramid of stage 5 of the DTM
describe age structure of the UK’s population - 1983
65+ - 15%
16-64 - 64%
under 16 - 21%
describe age structure of the UK’s population - 2033
65+ - 23%
16-64 - 60%
under 16 - 17%
state the causes of the UK’s ageing population
decreasing birth rate
increasing longevity
describe why the UK’s birth rate is decreasing
more access to contraception - more affordable contraception available
more knowledge and education about sex and contraception
more women focusing on careers and/or choosing not to have children/have less children
describe why the UK’s life expectancy is increasing
better sanitation and hygiene
more access to affordable healthcare
easier to live a healthier lifestyle
state ageing population definition
increasing median age
of a population
which happens as a result of
falling birth rate and increasing life expectancy
describe the effects of the UK’s ageing population
healthcare costs are very high and will increase as the elderly require support services and expensive treatments
shortages of places in care homes, many of which are expensive
many older people are looked after by their middle-aged children, often affecting their lives and their ability to remain in full-time employment
older people are valued employees as they have high standards and are reliable
older people act as volunteers in charitable organisations
many older people are keen to travel and take part in leisure activities - helps to boost the economy and provide jobs
describe the responses to the UK’s ageing population
government-issued pensioner bonds in 2015 to encourage older people to save money for the future
pensioners receive support in the form of care, reduced transport costs and heating allowances - this is expensive for the government and may be withdrawn from healthy pensioners in the future
retirement age which used to be 65 is being phased out to encourage people to continue to work
state pension age is gradually being increased to 67
the government could encourage people to take out private health insurance to cut NHS costs
pronatalist policies to encourage an increase in birth rate to balance out population structures
allowing more migration would address the need for a larger young workforce and high birth rate
state pension definition
regular payment made by the state to people of or above the official retirement age
describe the social advantages of migration for the UK
can lead to a wide variety of social activities, religious groups and restaurants available to residents
Russell Group unis suggest that foreign students contribute £2.5 billion in fees annually to finance higher education for domestic students
describe the economic advantages of migration for the UK
more people working in the UK means more people are spending money - leads to an increasing economy
migrants are more likely to be working age which can have a positive effect on the dependency ratio - counterbalances the UK’s aging population
migration can add flexibility within the workforce with jobs in shortage areas (such as farming, building and medical)
describe the social disadvantages of migration for the UK
UK is facing a housing shortage which is exasperated by increasing population due to migration
attitudes towards migrant communities can be negative and are sometimes reinforced by local media - results in groups forming extremely negative views on migration
migrants are often working age men which can lead to a gender imbalance in some areas where jobs from migrants are readily available
describe the economic disadvantages of migration for the UK
cost of translation of key services (police, councils, NHS) for UK residents who do not speak English fluently is more than £100 million a year
cost of treating migrants on the NHS led to the imposition of a surcharge of £200 per year for health services to combat increased demand
tensions between different ethnic/religious groups can lead to violence and increase the cost of policing
state gentrification definition
the improvement of housing in a previously run-down area
state deprivation definition
a low quality of life and a lack of opportunities to improve it
state brownfield definition
sites to build on that have previously been built on
state greenfield definition
sites to build on that have never been built on before
state suburbanisation definition
movement of people
out of inner city areas
into the suburbs
state counter-urbanisation definition
movement of people
out of urban and suburban areas
to rural areas
state re-urbanisation definition
movement of people
from suburbs and rural areas
back into inner city areas
state the push factors in suburbanisation
unaffordable housing
lots of congestion and air pollution
unemployment due to high demand for jobs
state the pull factors in suburbanisation
affordable housing
less congestion and air pollution
more job availability
describe the social consequences of suburbanisation
suburbs become dormitory places during the weekdays
as people will still be commuting back into more urban areas
with most of their down-time spent in sub-urban areas
describe the economic consequences of suburbanisation
skilled people and businesses may leave urban areas
in favour of more affordable housing and living in suburbs
causing economic instability in urban areas
describe the environmental consequences of suburbanisation
more greenfield land will be built on in sub-urban areas
to meet increased demand for housing
state the push factors for re-urbanisation
need to commute long distances for jobs in urban areas
less accessibility to healthcare
less access to childcare and leisure activities
potentially worse living conditions