APHUG maps
1/6
Earn XP
Description and Tags
Name | Mastery | Learn | Test | Matching | Spaced |
|---|
No study sessions yet.
7 Terms
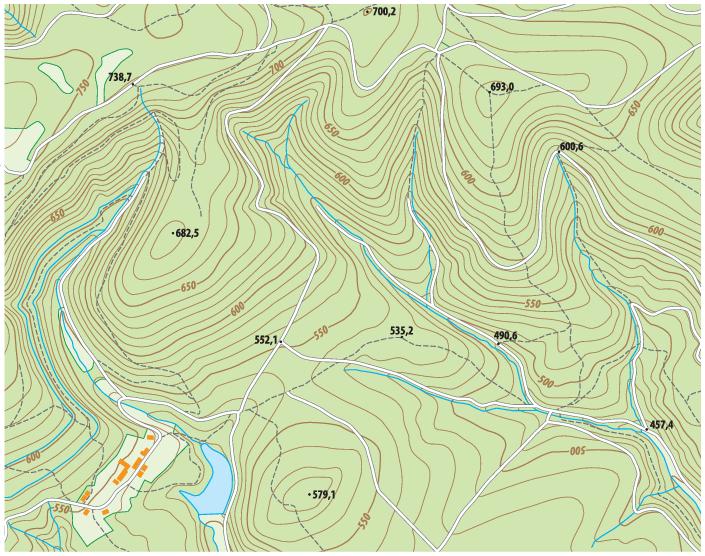
Topographic Map: visual representations of the earth's surface, including its elevation changes. They depict natural and man-made features like rivers, lakes, mountains, and roads, often using contour lines to show the shape of the land

Thematic Map: a type of map that focuses on a specific theme or topic related to a geographic area, rather than a general overview of location. It visually represents data or patterns associated with a particular subject, such as population density, climate, or geological features. Thematic maps utilize various symbols, colors, and patterns to highlight the distribution and characteristics of the theme being explored.
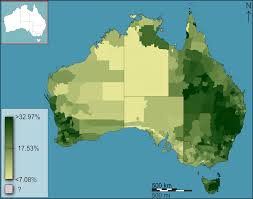
Choropleth Map: uses color or shading to represent statistical data across geographical areas. They are a popular thematic map type that can show numerical values associated with countries, provinces, or other predefined geographical entities. Choropleth maps use color schemes to represent variations in standardized datasets, such as rates or ratios, over a measured area.
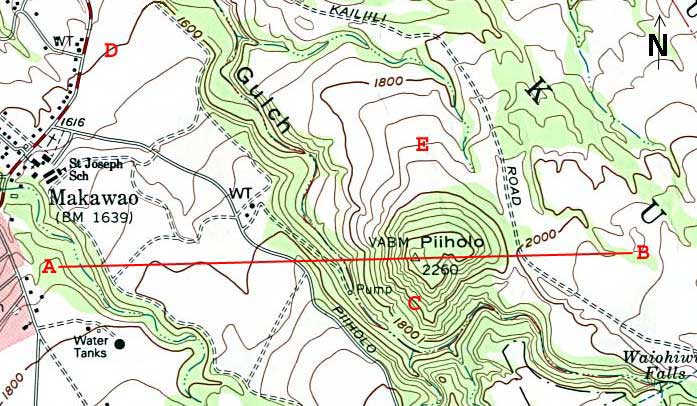
Isoline Map: uses lines to connect points of equal value, visually representing data variations across a geographic area. These lines, called isolines, help illustrate changes in things like elevation, temperature, or pressure.
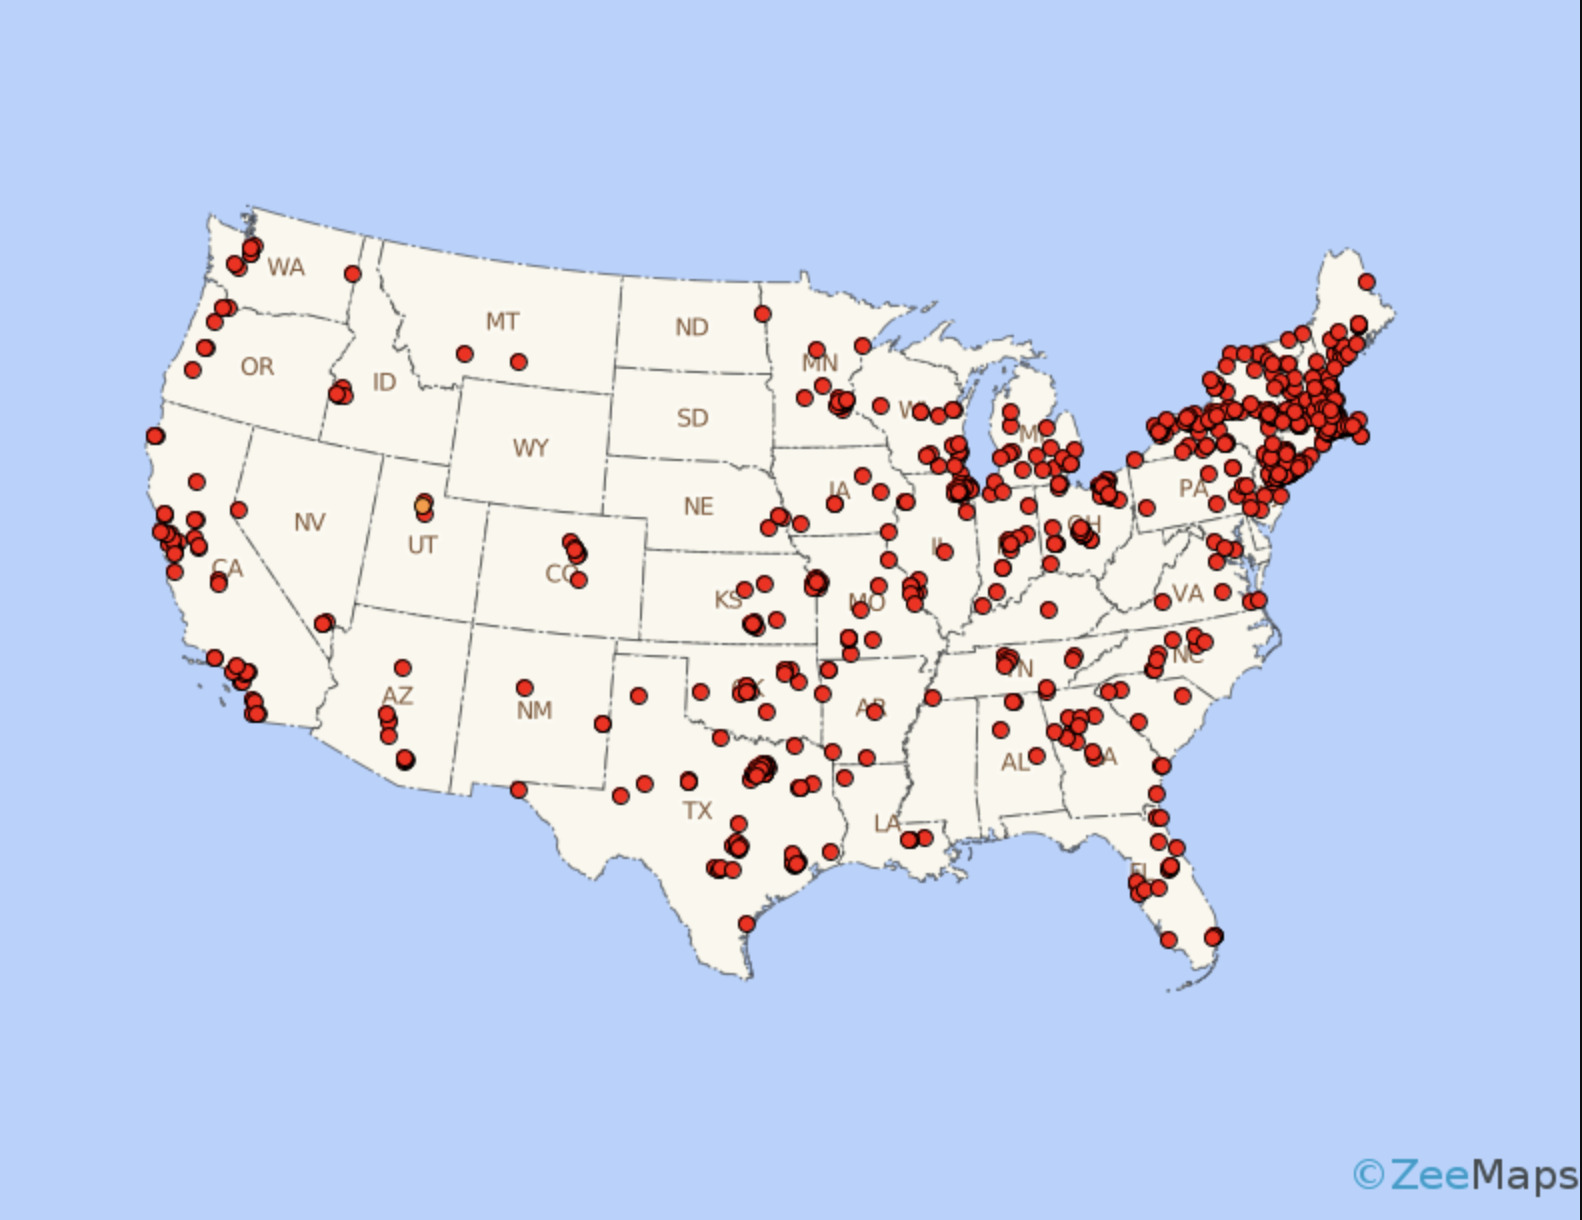
Dot Density Map: a type of thematic map that uses dots to visualize the distribution of a large number of related phenomena. These maps are particularly effective at showing spatial patterns and density variations.
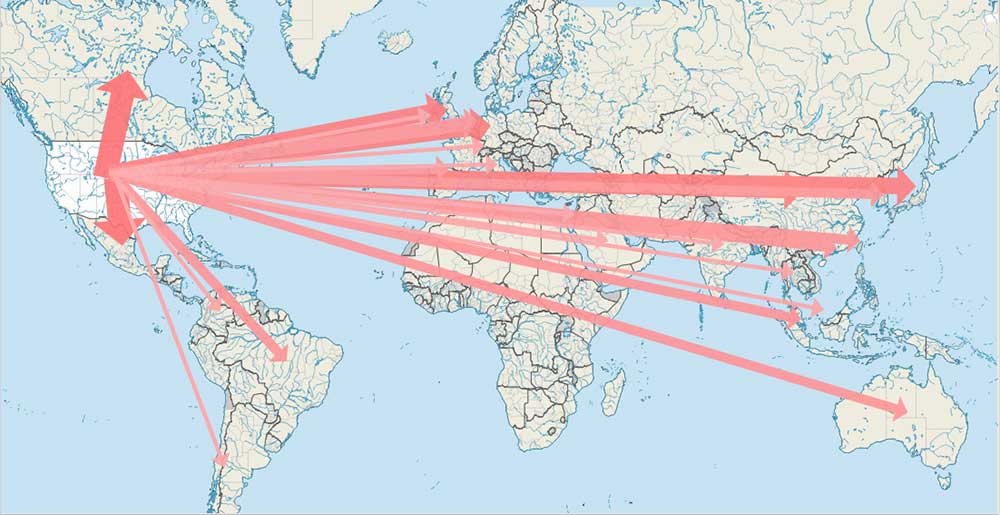
Flow Line Map: a type of thematic map that uses linear symbols to represent movement between locations. It may thus be considered a hybrid of a map and a flow diagram. The movement being mapped may be that of anything, including people, highway traffic, trade goods, water, ideas, telecommunications data, etc.
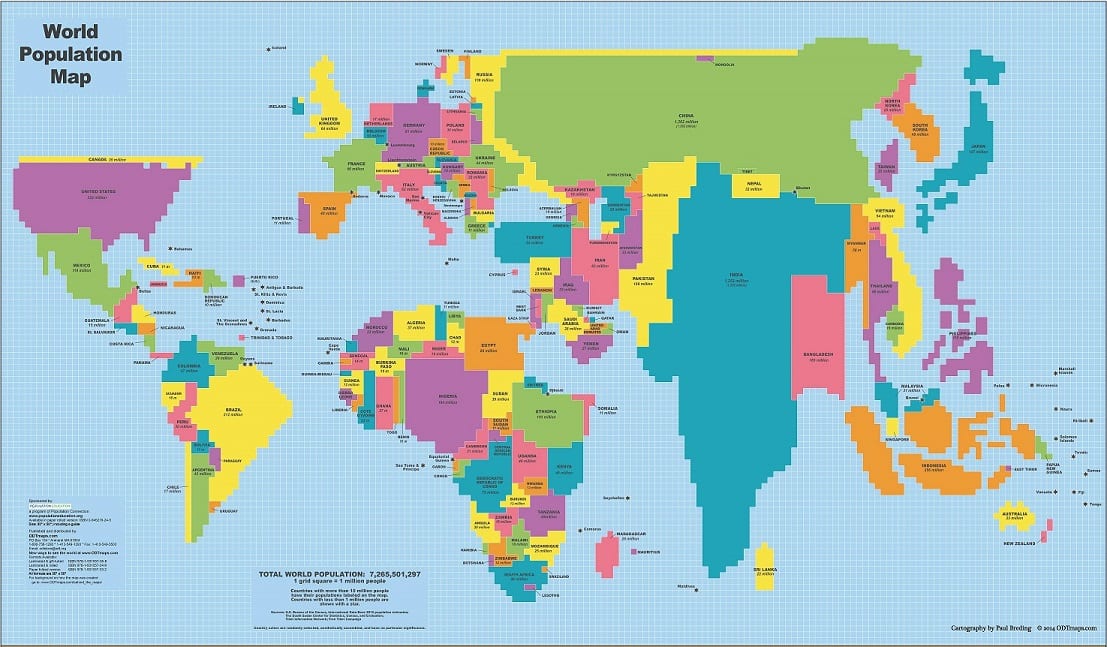
Cartogram Map: a type of map that distorts the geographical area of regions to visually represent a specific statistical variable, like population, income, or travel time.