Midterm Review
1/85
There's no tags or description
Looks like no tags are added yet.
Name | Mastery | Learn | Test | Matching | Spaced |
|---|
No study sessions yet.
86 Terms
What is an independent variable (IV)?
a variable that affects or determines a dependent variable
What is a dependent variable (DV)?
A variable that is dependent on another variable, typically the outcome.
What is a nominal scale?
A scale that assigns names or categories with no meaningful order
What is an ordinal scale?
A scale where numbers represent ordered categories, but differences between values may not be meaningful.
What are examples of the Nominal scale?
Examples: colors, race/ethnicity, biological sex, yes/no
What are examples of the Ordinal scale?
Examples:rate level of agreement, from 1-5, pH, Richter scale, NYC restaurant grades, Homeland security warning levels
What is an interval scale?
A scale with equal differences between values, but no true zero point.
What are examples of the Interval scale?
Example: The meaning of a 10 degree difference in temperature is the same whether we are talking about the difference between 30 and 40 degrees or 100 and 110 degrees. • Another example: Years (e.g., 2013)
What is a ratio scale?
A scale with both equal differences between values and a meaningful zero point (e.g., height, weight).
What is a discrete variable?
A variable that can only take on distinct, whole numbers (e.g., number of students).Can include a decimal in unique situations (e.g., sneaker size 5.5)
What is a continuous variable?
A variable that can take any value within a range (e.g., height).
What is a frequency and percent distribution table for nominal data?
It organizes nominal data into categories with the corresponding frequencies and percentages.
Can pie charts be used for nominal data?
Yes, pie charts can be used as long as the categories are exhaustive.
What types of graphs can be used for ordinal, interval, or ratio data?
Frequency and percent distribution tables, stem-and-leaf plots, histograms, and line graphs.
What is a histogram used for?
It is used for ordinal, interval, or ratio data where the lack of space between bars indicates continuity, reflecting the ordinal nature of the variable.
When is a line graph most appropriate?
most often used when two variables are involved, one of which is time.
What is a stem-and-leaf plot?
A plot where each data value is split into two parts: the "stem" and the "leaf." The stem represents the first part (usually digits), and the leaf represents the remaining part of the value.
What is symmetry in data?
occurs when the data is evenly distributed on either side of the mean.
What is cumulative percent?
The percent of values at or below a certain point in a distribution.
What is a percentile rank?
he percentage of values that fall below a given value.
What is a percentile rank example ?
If you're in the 90th percentile, 90% of values fall below your score.
How do you calculate percentages?
Divide the given amount by the total amount and multiply by 100.
Example: (60/75) x 100 = 80%.
How do you calculate cumulative percents?
Add the percentage of the current row to the cumulative percentage of the previous rows.
Example: If Row 1 is 15% and Row 2 is 24.6%, the cumulative percent for Row 2 is 39.6%.
What is the mode?
is the data value that occurs most often. It is valid for nominal, ordinal, interval, and ratio level data, as well as for both discrete and continuous data.
In what situation might the mode describe the center of a distribution?
describes the center when the distribution is unimodal, meaning the most frequent value reflects the center.
When might the mode not reflect the center of a distribution?
When the distribution is bimodal or multimodal, the mode may not describe the center as well.
What is the median?
is the value below which 50% of all data values fall, also known as the second quartile (Q2), fifth decile (D5), or 50th percentile (C50).
Is the median affected by outliers?
No, its is robust and is not significantly affected by outliers.
How do you find the median in a data set?
Arrange the values in order. If the number of values is odd, the median is the middle value. If even, the median is the average of the two middle values.
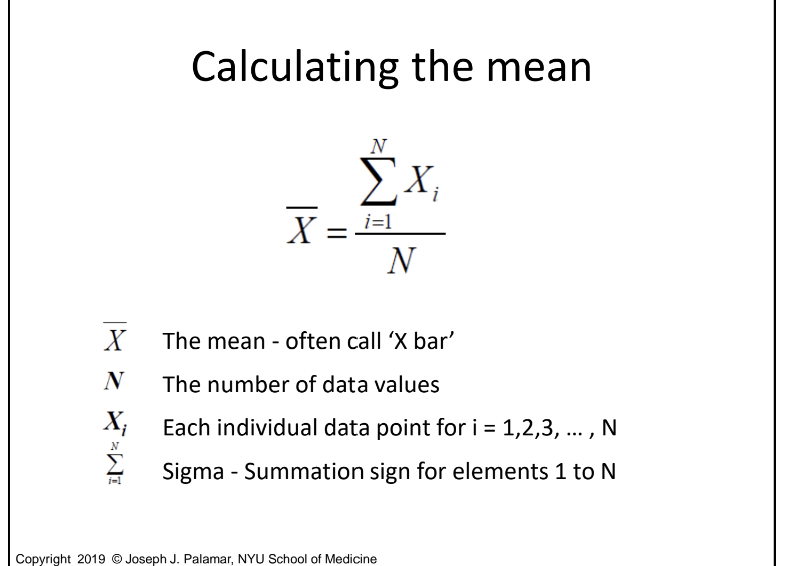
What is the mean?
is the arithmetic average of all data values in the distribution. It represents the 'balance point' of the data.
How do you calculate the mean?
Add all the data points together and divide by the number of values.
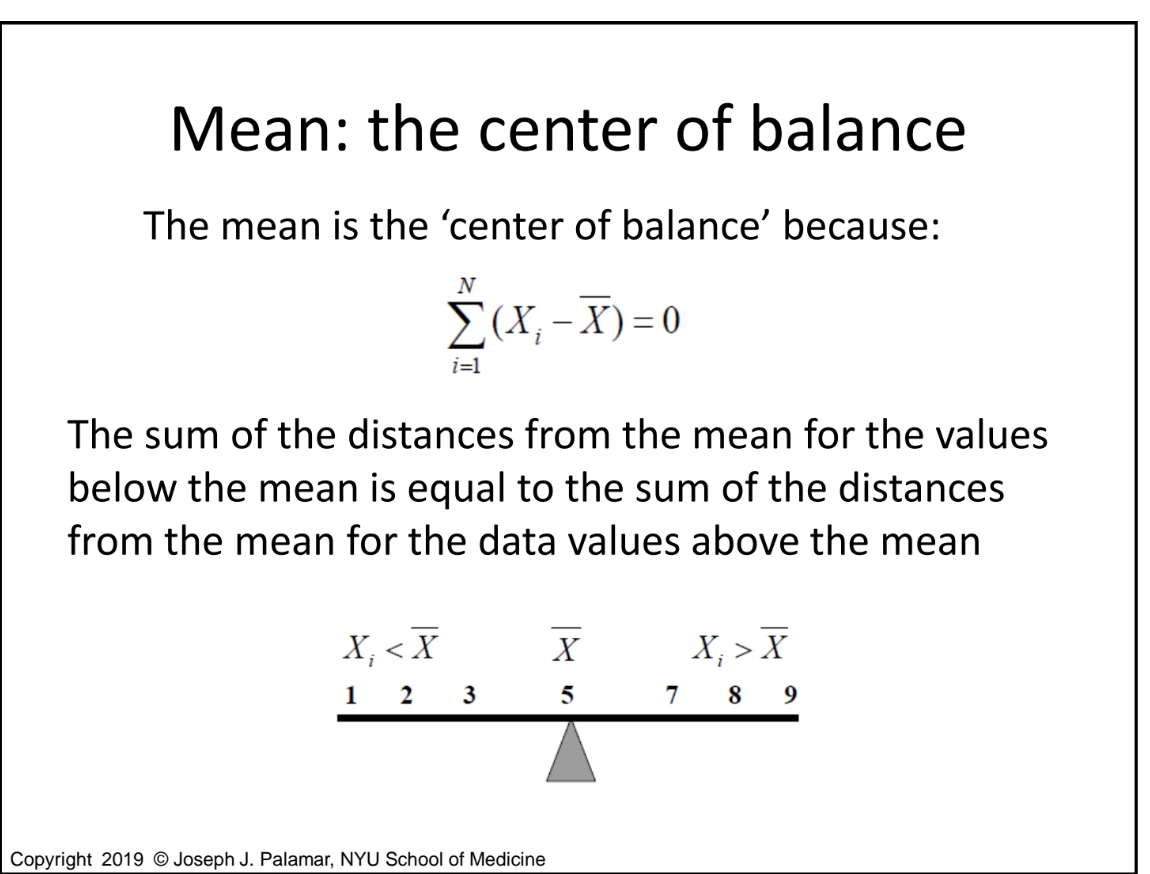
Why is the mean referred to as the 'center of balance'?
Because the sum of the distances from the mean for values below it equals the sum of the distances for values above it.
What happens when outliers are present in a data set?(mean)
Outliers can distort the mean, pulling it towards the extreme values and making it less representative of the data.
What happens to the mean, median, and mode in a unimodal and symmetric distribution?
In a unimodal and symmetric distribution, the mean, median, and mode are all equal.
What do measures of dispersion tell us?
provide information on the spread of the data, such as the range, interquartile range (IQR), variance, and standard deviation (SD).
What questions do measures of dispersion answer?
They help determine the limits (min/max), the central distribution of scores, and whether the data is symmetrical or skewed.
What are the four most common measurements of dispersion?
Range, Interquartile Range (IQR), Variance, and Standard Deviation (SD).
Can the range and IQR be used for ordinal data?
Yes, the range and IQR can be used for ordinal, but variance and SD are for interval or ratio data only.
What is the range?
The range is the simplest measure of dispersion, calculated by subtracting the maximum value from the minimum value.
Why is the range considered problematic?
he range is sensitive to outliers, as it only considers the two extreme values in a data set.
What is the interquartile range (IQR)?
The range between the first quartile (Q1) and the third quartile (Q3), representing the middle 50% of the data.
Why is the IQR considered more stable than the range?
is resistant to outliers because it focuses on the central portion of the data, rather than the extremes.
What is standard deviation (SD)?
the average distance between each score and the mean, used to measure the spread of the data.
What does a large SD indicate?
indicates that the data points are widely spread around the mean, while a small SD suggests that the data points are closely clustered around the mean.
Can SD ever be negative?
No, SD is always positive.
How is SD commonly reported?
SD is usually reported alongside the mean, for example: M(SD) = 30(4).
How does SD relate to outliers?
SD is highly sensitive to outliers, which can increase the value of SD significantly.
What does it mean when scores deviate from the mean?
It means that each score differs from the mean, either slightly or dramatically, which contributes to the SD value.
What is variance?
the square of the standard deviation, representing the spread of the data in squared units.
Why do we use SD instead of variance?
SD is more interpretable because it is in the same units as the original data, while variance is in squared units (e.g., IQ² instead of IQ).
What is a Z-score?
represents how many standard deviations a data point is from the mean.
What does a Z-score of 0 indicate?
indicates that the data point is exactly at the mean.
How are positive and negative Z-scores interpreted?
indicate values above the mean, and negative Z-scores indicate values below the mean.
What is the 5-number summary in a box plot?
includes the minimum, Q1 (first quartile), median (Q2), Q3 (third quartile), and the maximum.
What does the box in a box plot represent?
The box represents the middle 50% of the data, from Q1 to Q3.
What do the lines extending from the box (whiskers) represent in a box plot?
The whiskers extend to the minimum and maximum values that are not considered outliers.
Where is the median located in a box plot?
The median is marked within the box at Q2.
What is positive skew?
occurs when the majority of the data is on the left, with the tail extending to the right.
What is negative skew?
occurs when the majority of the data is on the right, with the tail extending to the left.
What effect does an outlier have on a distribution's skewness?
Outliers can cause skewness, as they pull the mean toward the extreme values, making the distribution asymmetric.
How do outliers affect the mean and median?
he mean is more affected by outliers, while the median is more resistant to them.
What are categorical (nominal) data?
are variables that can be divided into distinct groups, with no inherent order or ranking.
What are important characteristics of categorical data?
should be exclusive and exhaustive, meaning no overlap between categories and all possible categories must be included.
Why are strict definitions necessary for categorical variables?Example…
Strict definitions ensure clarity and consistency, particularly for complex variables like drug use or survey responses on sensitive topics.
Example: Survey results showed that 59% of a student sample did not consider oral sex to be "sex," illustrating the importance of clear definitions.
What are crosstabs used for?
rosstabs are used to compare two variables to calculate risk, typically between a factor or predictor and a disease or outcome.
What is relative risk (RR)?
is a comparison of the risk of developing a disease or outcome in one group compared to another group.
What does an RR of 1 mean?
An RR of 1 means there is no association between exposure and the disease or outcome.
What does an RR greater than 1 indicate?
An RR greater than 1 indicates an increased risk of disease or outcome for those exposed.
What does an RR less than 1 indicate?
An RR less than 1 indicates a decreased risk of disease or outcome for those exposed.
What is an odds ratio (OR)?
the odds ratio compares the odds of an event occurring in one group to the odds of it occurring in another group.
How does OR differ from RR?
Unlike RR, which calculates relative risk, OR uses odds instead of probabilities and does not depend on row totals.
How do you calculate the relative risk for lung cancer among smokers vs. non-smokers?
Risk for smokers = (a/a+b) = 0.023
Risk for non-smokers = (c/c+d) = 0.004
RR = 5.75
Smokers are at almost 6 times greater risk of developing lung cancer compared to non-smokers.
How do you calculate the odds ratio for lung cancer among smokers vs. non-smokers?
Odds for smokers = (a/b) = 0.024
Odds for non-smokers = (c/d) = 0.004
OR = 6.0
Smokers are at 6 times the odds of developing lung cancer compared to non-smokers.
hat are the four possible outcomes in a diagnostic test?
True Positive (TP) – test is positive, and the subject has the disease.
False Negative (FN) – test is negative, but the subject has the disease.
False Positive (FP) – test is positive, but the subject does not have the disease.
True Negative (TN) – test is negative, and the subject is free of the disease.
What is sensitivity in diagnostic tests?
Sensitivity is the ability of a test to correctly identify those with the disease (True Positives). Formula: TP/(TP+FN).
What is specificity in diagnostic tests?
Specificity is the ability of a test to correctly identify those without the disease (True Negatives). Formula: TN/(TN+FP).
What is NNT?(Number Needed to Treat)
it represents the number of people who need to receive a treatment to prevent one adverse event or achieve one positive outcome.
NNT.. Examples
324 girls must be vaccinated with Gardasil® to prevent 1 case of cervical cancer.
175 people must be vaccinated to prevent 1 case of shingles.
Fewer than 50 children must be vaccinated for influenza to prevent 1 case.
What is a rate in statistics?
describes the frequency of an event occurring, often expressed per 1,000 or 100,000 people.
Formula:
Rate = (Number of events / Total population) x k
Where k is a multiplier (e.g., 1,000 or 100,000).
What is the incidence rate?
he incidence rate is the number of new cases of a disease over a specific time period, usually expressed per year.
Formula: Incidence Rate = (New cases / Population at risk).
What is the prevalence rate?
The prevalence rate is the total number of cases (new and existing) at a specific point in time.
Formula: Prevalence Rate = (All cases / Total population).
What is morbidity rate?
refers to the rate of disease in a population. It can refer to incidence or prevalence rates.
What is mortality rate?
rate of death in a population during a specific period, often expressed per 1,000 or 100,000 people.
What is birth rate?
Birth rate is the number of live births per 1,000 people in a population during a specific period.
How is a crude mortality rate calculated?
rate is calculated by dividing the number of deaths by the total population and multiplying by a given factor (usually 1,000 or 100,000).
Example: In 1980, California had a population of 23 million and 190,247 deaths. The crude mortality rate would be:
Crude Mortality Rate = (190,247 / 23,000,000) x 1,000.
How is the incidence rate of AIDS calculated?
In 2000, there were 41,311 new cases of AIDS in the US. With a population of 281,500,000, the incidence rate would be:
Incidence Rate = (41,311 / 281,500,000) x 100,000.