supply&demand + elasticity (quiz 3)
1/60
There's no tags or description
Looks like no tags are added yet.
Name | Mastery | Learn | Test | Matching | Spaced | Call with Kai |
|---|
No analytics yet
Send a link to your students to track their progress
61 Terms
market economy
resources are allocated among households and firms with little or no government interference
market
a collection of buyers and sellers of a particular product or service
competitive market
exists when there are so many buyers and sellers that each has only a SMALL IMPACT on the market price and output
goods sold by each vendor are similar
imperfect markets
either the buyer or the seller can influence the market price
more UNIQUE goods
market power
a firms ability to influence the price of a good or service by exercising control over its demand, supply, or both
monopoly
when a single company supplies the entire market for a particular good or service
quantity demanded
the AMOUNT of a good or service that a consumer is willing and able to purchase at a given price
law of demand
when price goes up, quantity demanded goes down
when price goes down, quantity demanded goes up
inverse relationship
demand schedule
table showing the relationship between price and good
demand curve
a graph of the relationship between the prices in the demand schedule and the quantity demanded at those prices
market demand
sum of all the individual quantities demanded by each buyer in the market at each price
quantity demanded shifts demand curve. how does it shift with an increase or decrease?
Increase: shifts right
Decrease: shifts left
factors that shift a demand curve:
income
price of related goods
changes in taste and preferences
expectations of future prices
number of buyers
taxes and subsidies
purchasing power
the value of your income expressed in terms of how much you can afford
normal good
consumers buy more as income rises
ex: meals at a restaurant
inferior good
demand declines as income rises
(they can afford something better)
complements
two goods that are bought and used together
when price goes up, quantity demanded of that good AND of related good goes down
substitutes
two goods that are used in place of each other
when price increases for this good, quantity demanded this good DECREASES while for the other good increases
subsidy
a payment made by the government to encourage the consumption or production of a good or service
quantity supplied
amount of a good or service producers are willing and able to sell at the current price ^price, ^quantity supplied ... v prices, v quantity supplied
law of supply
quantity supplied of a good rises when the price of a good rises, and falls when the price of a good falls
direct relationship
supply schedule
a table showing the direct relationship between the price of a good and the quantity supplied
supply curve
a graph of the relationship between the prices in the supply schedule and the quantity supplied at those prices
positive curve: direct (positive) relationship between the price and the quantity offered for sale
factors that shift a supply curve:
cost of inputs
changes in technology or the production process
taxes and subsidies
number of firms in the industry
price expectations
when would a supply curve shift left?
if the change would reduce the amount of a good or service a business is willing and able to supply at every given price
when would a supply curve shift right?
if the change would increase the amount of a good or service a business is willing and able to supply at every given price
inputs
resources used in the production process
an increase in technology would shift supply curve to the...
right
^production process, ^supply, shifts to the right
how do taxes impact supply curve?
taxes make firms less profitable -> lower profits make firms less willing to supply product -> supply curve shifts left -> overall supply declines
REVERSE FOR SUBSIDIES
how do the number of firms in the industry affect the supply curve?
shifts left
equilibrium
the point where the demand curve and supply curve intersect
equilibrium price
the price at which the quantity supplied is equal to the quantity demanded
equilibrium quantity
amount where quantity supplied = quantity demanded
law of supply and demanded
the market price of any good will adjust to bring the quantity supplied and supply demanded into balance
shortage
quantity supplied < quantity demanded
surplus
quantity supplied > quantity demanded
elasticity
a measure of the responsiveness of buyers and sellers to changes in price or income
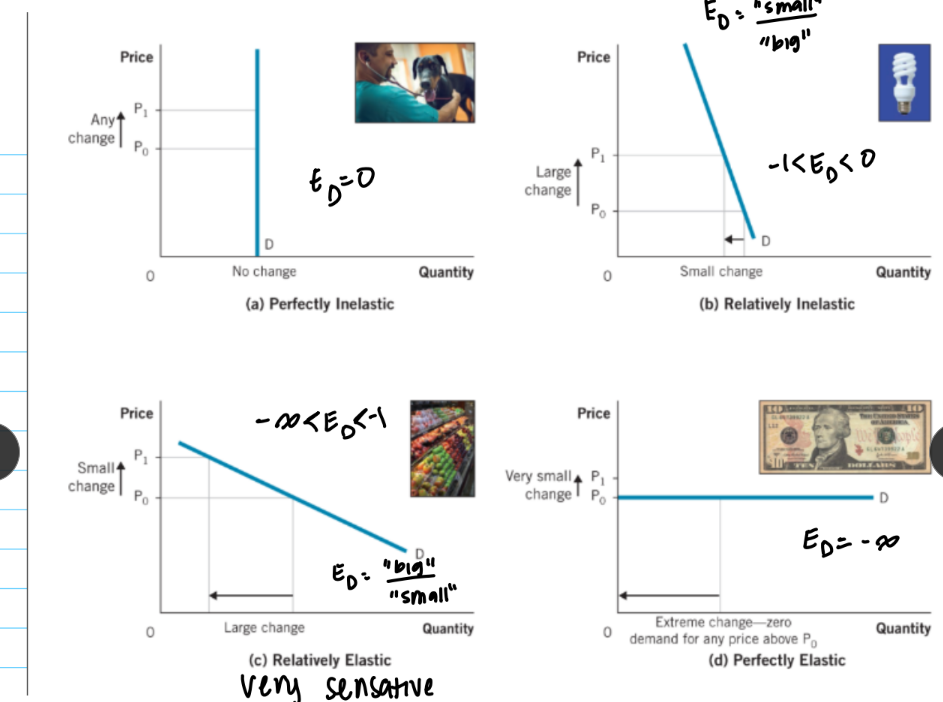
elastic
if the quantity demanded changes significantly as a result of price change
inelastic
if quantity demanded changes a small amount as a result of a price change
price elasticity of demand
measures the responsiveness of quantity demanded to a change in price
determinants of price elasticity of demand
existence of substitutes
share of the budget spent on the good
demand is more inelastic for inexpensive items on sale
necessities vs luxury goods
necessities = inelastic
whether the market is broadly or narrowly defined
broad (ex: “toothpaste”) = inelastic
narrow (ex: “Crest toothpaste”) = elastic
time + the adjustment process
demand is more elastic in the long run
immediate run
there is no time for consumers to adjust their behavior
ex: demand for gas
short run
a period of time when consumers can partially adjust their behavior
long run
a period of time when consumers have time to fully adjust to market conditions - demand becomes more elastic
price elasticity of demand formula
percent change in quantity demanded / percent change in price
midpoint method formula
(Q2 - Q1) / [(Q2 + Q1) / 2] / (P2 - P1) / [(P2 + P1) / 2]
elasticity coefficient range interpretation
-inf < elastic < -1 < inelastic < 0
total revenue and formula
the amount a firm receives from the sale of goods and services
quantity sold x price of good
graphs of price elasticities of demand
how does total revenue change when lowering price with elasticity of demand?
demand is elastic, lowering price increases total revenue
demand is inelastic, lowering price decreases total revenue
income elasticity of demand
measures how a change in income affects spending
income elasticity formula
percent change in quantity demanded / percent change in income
income elasticity of a necessary normal good
0 < EI < 1
income elasticity of a luxury normal good
EI > 1
EI of inferior goods
have negative income elasticity
as income expands, demand for these goods declines
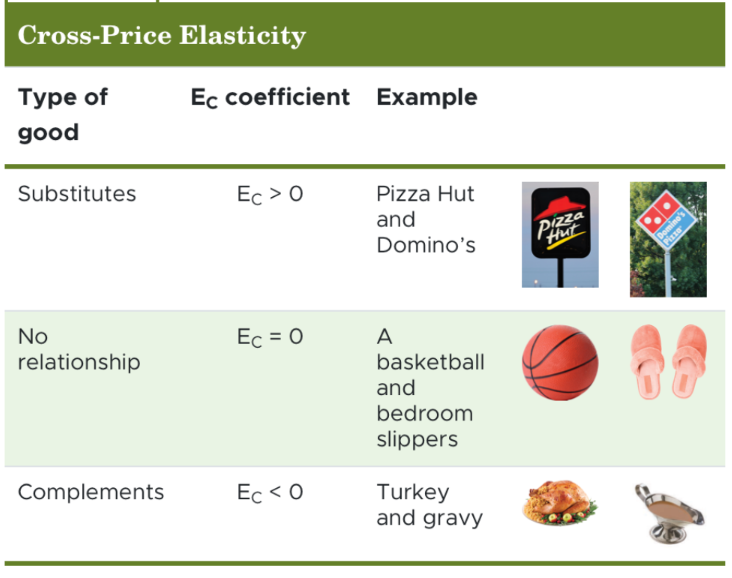
cross-price elasticity formula
EC = percent change in quantity demanded of one good / percent change in price of related good
cross-price elasticity coefficient interpretation
price elasticity of supply
a measure of the responsiveness of the quantity supplied to a change in price
price elasticity of supply coefficient interpretation
ES = percent change in QS / percent change in price
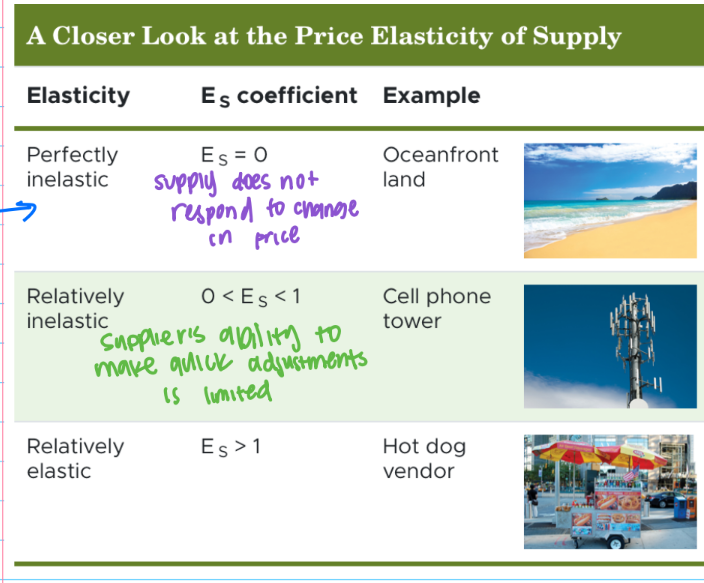
determinants of price elasticity of supply
flexibility of producers
when a producer can quickly ramp up an output, supply tends to be elastic
time and adjustment process
immediate run → short run → long run: supply (like demand) becomes more elastic
rotation of curves as they become more elastic
supply curve → rotates clockwise
demand curve → rotates counterclockwise