STATS3- non-parametric hypothesis tests
1/21
There's no tags or description
Looks like no tags are added yet.
Name | Mastery | Learn | Test | Matching | Spaced |
|---|
No study sessions yet.
22 Terms
5 types of parametric hypothesis tests
z-test
1 sample t-test
paired t-test
independent group t-test
pearson’s r
degrees of freedom for parametric hypothesis tests
z-test: 0
1 sample t-test: n-1
paired t-test: n-1
independent group t-test: total sample size-2
pearson’s r: n-2
3 assumptions of parametric tests
normally distributed populations
sd of populations should be approximately equal
theres no extreme scores in data set
what is the mann-whitney test the non-parametric alternative for
independent t-test
4 steps to carry out mann-whitney test
rank all scores from each group lowest to highest (include tied ranks)
substitute scores in each group with their rank
work out the smallest possible sum of ranks for each group
work out actual sum of ranks for each group & calculate difference from step 3
mann-whitney value = smallest number from step 4
what to do with p-value when doing a 1 tailed mann-whitney test
p-value/2
what is the wilcoxon test the non-parametric alternative for
paired t-test
3 steps to carry out wilcoxon test
calculate difference post-pre for each score
rank differences smallest - largest
ignore 0 difference & sign of difference
split ranks into positive and negative
wilcoxon value = sum of ranks in least occurring difference column (positive or negative)
what does a small wilcoxon score (t) suggest
more evidence for difference
what is the spearman’s rho test the non-parametric alternative for
pearson’s r
what values does spearman’s rho range from
-1 - 1
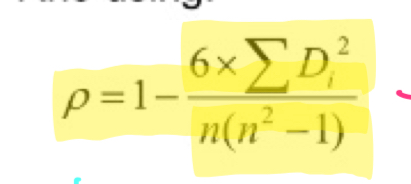
spearman’s rho formula
when can spearman’s rho test only be used
if theres no tied ranks
5 steps to carry out spearman’s rho test
convert scores in each group (X & Y) to ranks (2 different rank columns)
calculate the difference in ranks
square the difference
calculate the sum of squared differences
use spearman’s rho formula
what + when is the 1-variable chi square test used for
relationships between frequency data in categorical variables
if observed frequencies are different from whats expected (equally distributed)
4 steps to carry out 1-variable chi square test
calculate difference between expected (under null hypothesis) and observed frequencies
(E-O)²
(E-O)²/E
chi square = sum of step 4
degrees of freedom for 1-variable chi square test
n-1
what tail of significance do you look at for 1-variable chi squre test
one-tailed significance, 0.05
what is the 2×2 chi square test of association used for
relationship between 2 categorical variables
how to calculate expected values for 2×2 chi square test
(row total x column total)/sample total
4 steps for 2×2 chi square test
hypothesis: x association/relationship
calculate expected values
calculate chi square value
convert to critical value
degrees of freedom for 2×2 chi square test of association
(number of rows - 1) x (number of columns - 1)