HTHSCI 2S03 - Lecture: Joint Either/Or Probability, Probability Distributions, & Normal Distribution
1/31
There's no tags or description
Looks like no tags are added yet.
Name | Mastery | Learn | Test | Matching | Spaced |
|---|
No study sessions yet.
32 Terms
Joint Either/Or Probability
Joint Probability
- P(A∩B) is the probability that events A and B will both occur
- Key to understanding joint probability is to know that the words “both” or “and” are usually involved in the question
Multiplication Rule - Joint Probability
- The Multiplication Rule is used to calculate joint probabilities
= P(B) x P(AlB)

Joint Probability Example
What is the probability that a person picked at random will be:
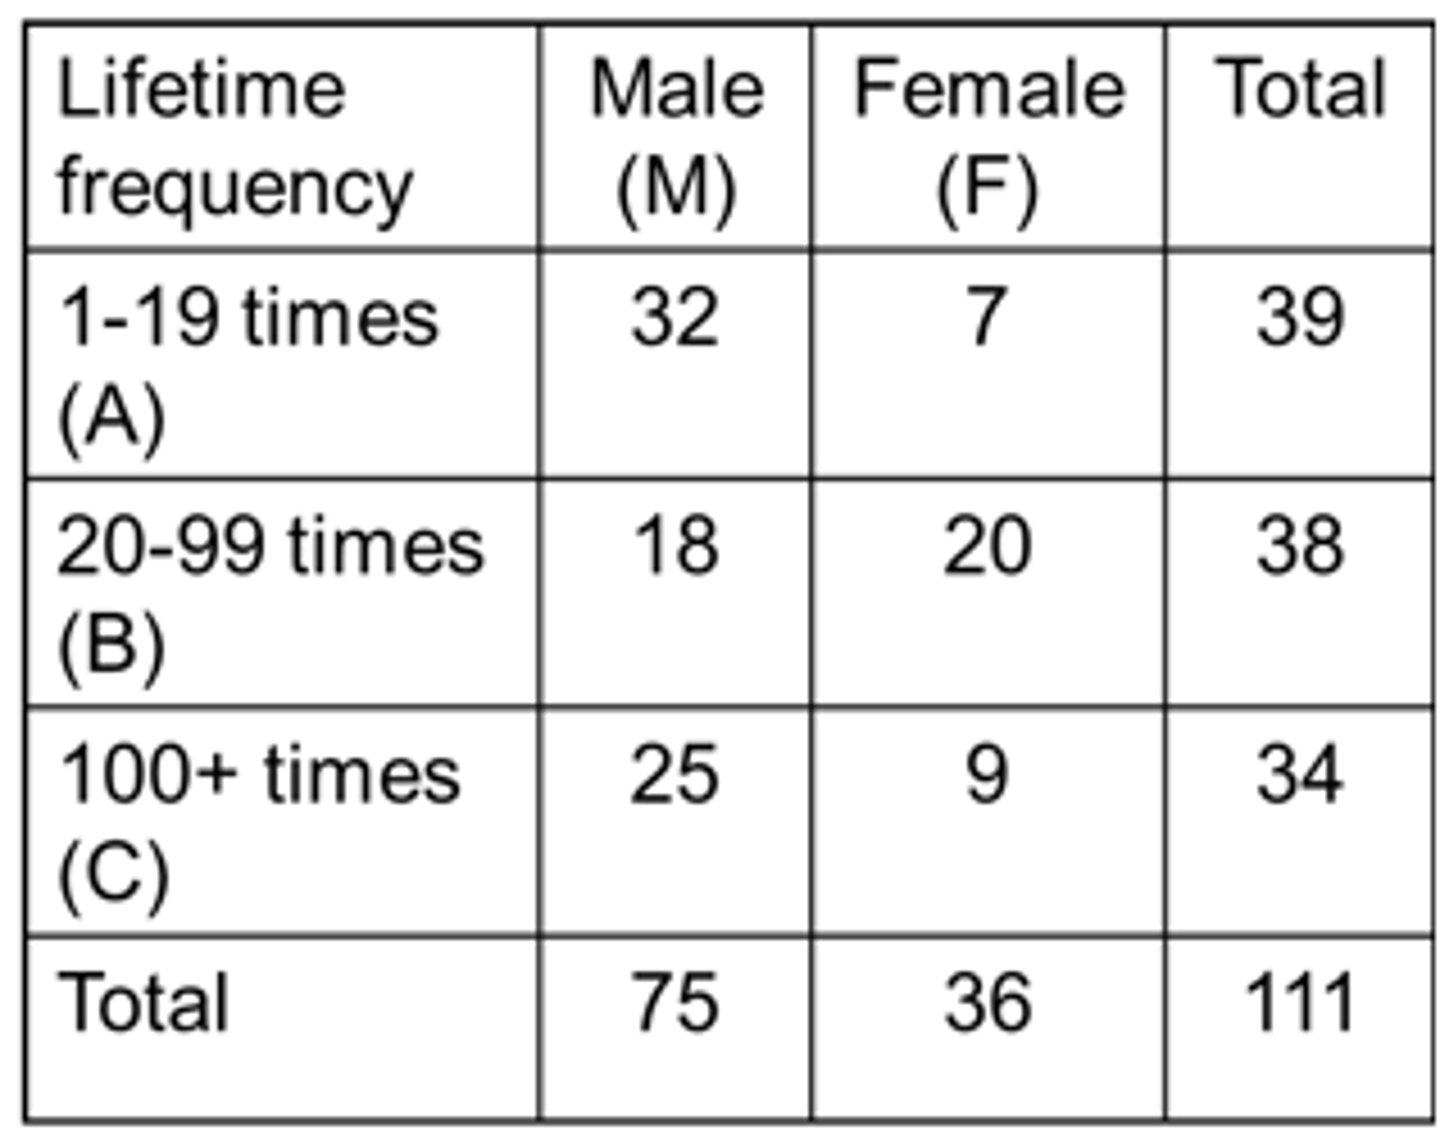
1. A male (M) and a person who used cocaine 1-19 times during their lifetime (A)?
P(M∩A) = P(M) x P(A|M)
= 75/111 x 32/75
= 0.288 or 28.8%
2. A female (F) and 20-99 times user (B)?
P(F∩B) = P(F) x P(B|F)
= 36/111 x 20/36
= 0.180 or 18%
Independent Events - Joint Probability
- Two events are independent when the occurrence of one does not change the probability that the other will occur
- Ex. Rolling a 3 on a die and flipping a tail on a coin (rolling a 3 does not affect the probability of flipping a tail)
If two events A and B are independent, then the conditional probabilities are simply the marginal probabilities:
- P(A|B) = P(A)
- P(B|A) = P(B)
For two independent events A and B, the joint probability simplifies to the product of the two marginal probabilities: Formula in picture

Independent Events Example
- Ex. of 2 independent events: Rolling a 3 on a die (A) and flipping a tail on a coin (B)
Since these events are independent, the joint probability of both events occurring is:
P(A∩B) = P(A) x P(B)
= 1/6 x 1/2
= 0.16 ̅ x 0.5
= 0.083 or 8.3%
Either/Or Probability
- P(AUB) is the probability that event A will occur, or event B will occur
- Key to understanding either/or probabilities is to know that the word “or” is usually involved in the question
Addition Rule - Either/Or Probability
- The Addition Rule is used to calculate either/or probabilities

Addition Rule Example
What is the probability of:
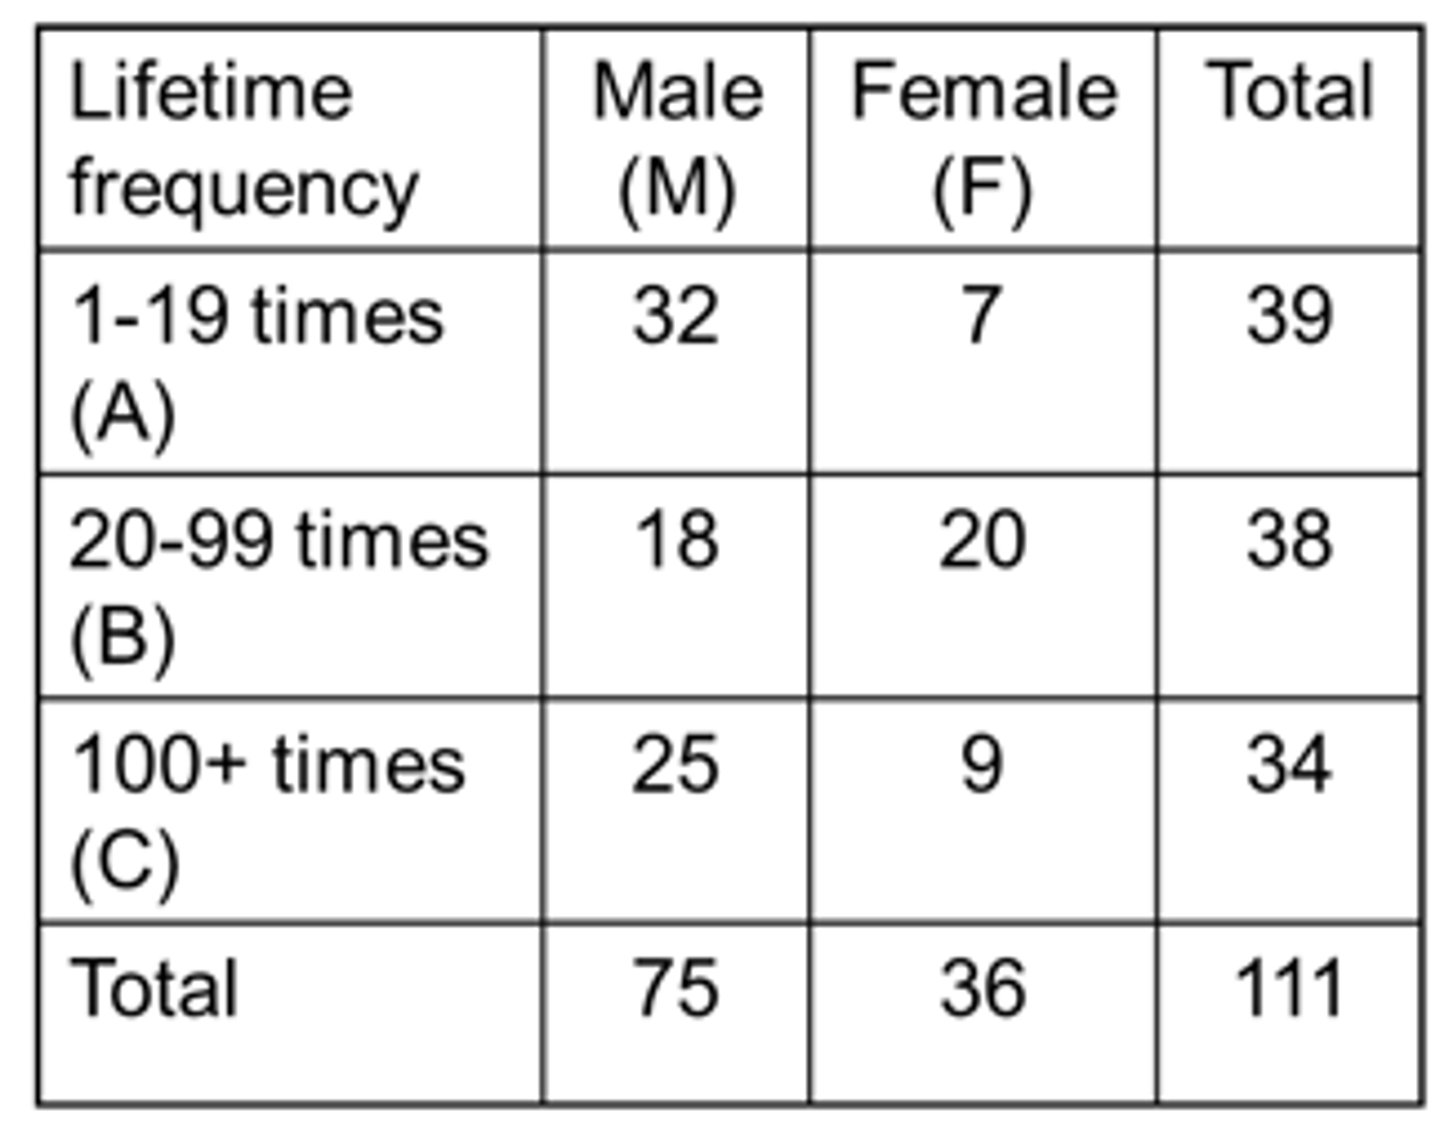
1. Being male (M) or being a 1-19 times lifetime user (A)?
P(MUA) = P(M) + P(A) – P(M∩A)
= 75/111 + 39/111 - 32/111
= 0.739 or 73.9%
2. Being a 1-19 times lifetime user (A) or a 20-99 times lifetime user (B)?
P(AUB) = P(A) + P(B) – P(A∩B)
= P(A) + P(B)
= 39/111 + 38/111
= 0.694 or 69.4%
*No overlap between events (therefore, no subtraction)
Joint Probability - Not Mutually Exclusive
The joint probability is subtracted in the formula:
P(AUB) = P(A) + P(B) – P(A∩B)
*This corrects for the double counting that would occur if events A and B are not mutually exclusive [the probability of both A and B occurring would be included in both P(A) and P(B)]*
Joint Probability - Mutually Exclusive
If events A and B are mutually exclusive, then the either/or probability is simply the sum of the two marginal probabilities:
P(AUB) = P(A) + P(B)
Joint (and) Probabilities
- Multiplication Rule always applies: P(A) x P(B|A)
- Simplification exists if events independent: P(A) x P(B)
Either/Or Probabilities
- Addition Rule always applies: P(A) + P(B) – P(A∩B)
- Simplification exists if events mutually exclusive: P(A) + P(B)
The probability of two independent events A & B occurring is:
a) P(A) x P(B)
b) P(A) + P(B)
c) P(A) + P(B) - P(A - B)
d) P(A) + P(B) - P(A x B)
Answer = A
Probability Distributions
Discrete
- The probability distribution of a discrete random variable is a table, graph, formula, or any other device that specifies all possible values of a discrete random variable along with their corresponding probabilities
- Ex. Flipping a coin, cancer stages, Binomial distribution & Poisson distribution
Discrete Example #1
Discrete Example #2
Normal Distribution
Questions - Discrete
Normal Distribution
- The most important distribution in statistics is the normal distribution
- The normal distribution is completely determined by the parameters μ and σ
- Where π and e are the familiar constants, 3.14159 and 2.71828, respectively
It is a continuous (not discrete) probability distribution:
- We do not calculate the probability of a specific value of X (as done with discrete distributions), because the probability that X is exactly equal to a specific value is 0
- Instead, we calculate the probability that X falls within a range of values or above/below a certain value

Normal Distribution Characteristic #1
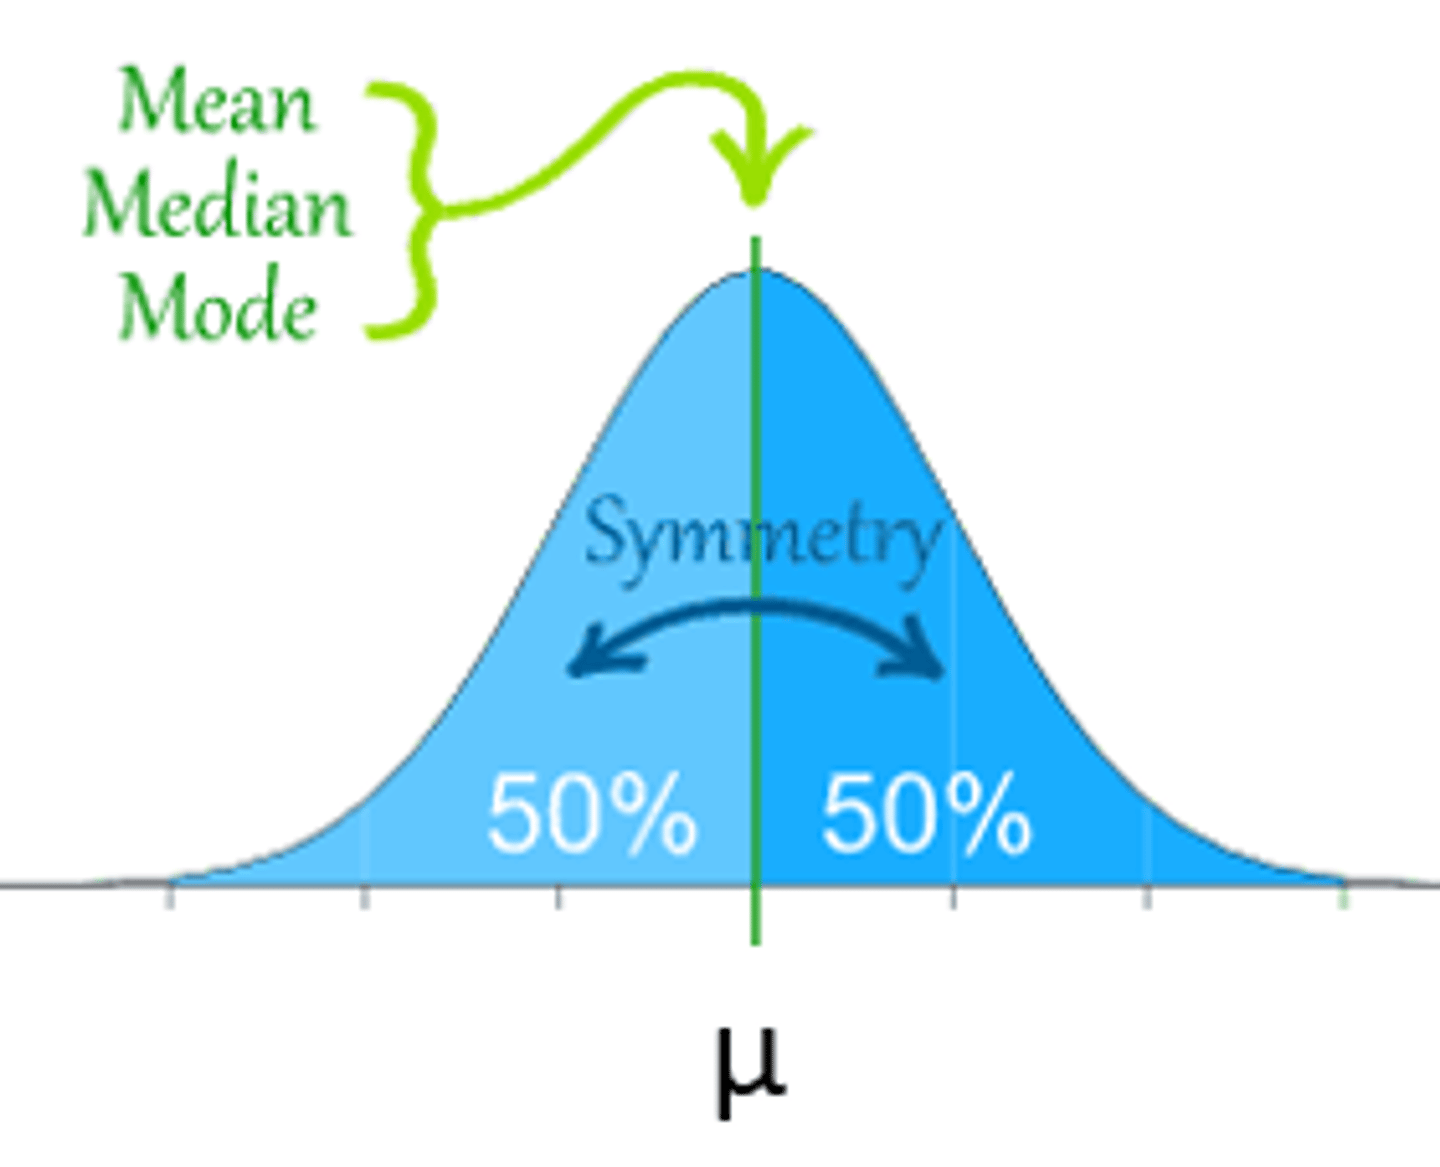
1. It is symmetrical about the mean, μ
Normal Distribution Characteristic #2
2. The mean, the median, and the mode are all equal
Normal Distribution Characteristic #3
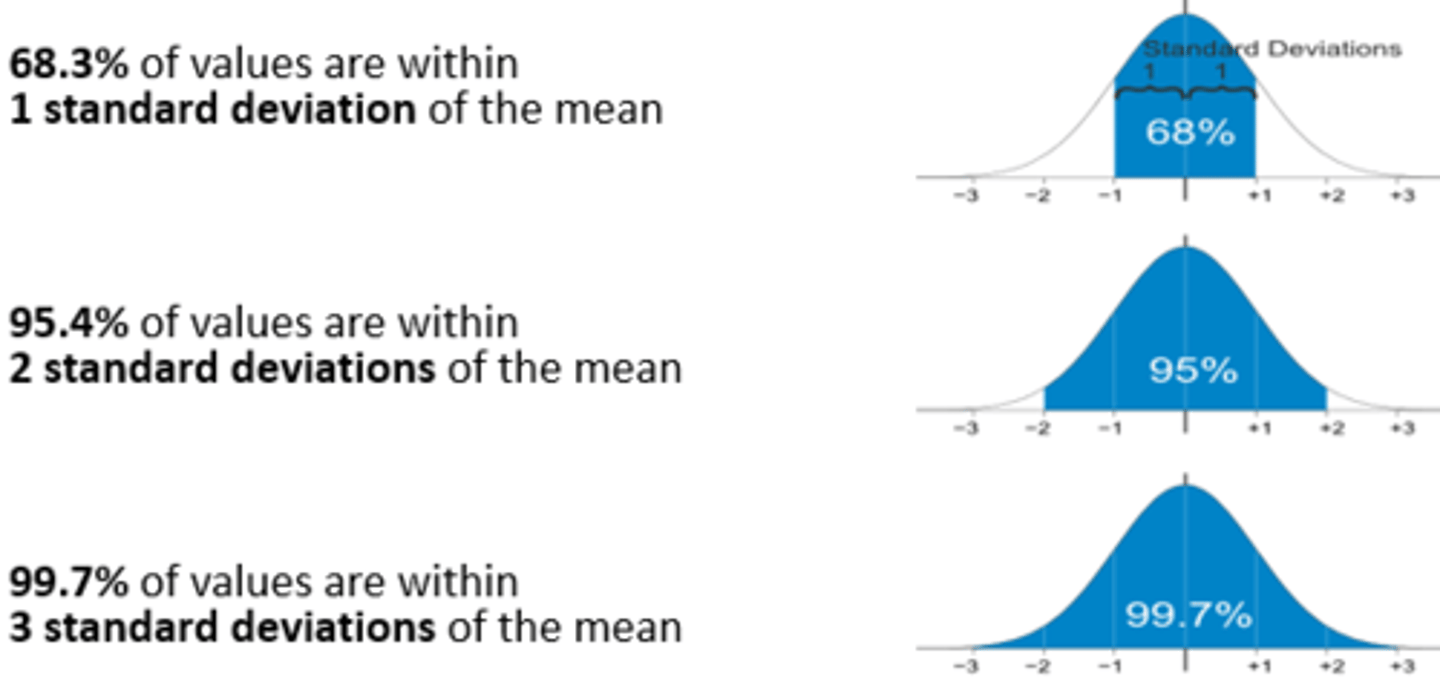
3. The percentage of values falling within 1, 2 & 3 standard deviations of the mean is known
*Usually known as normal range!
*If it is normal distribution the % will always be the same!!
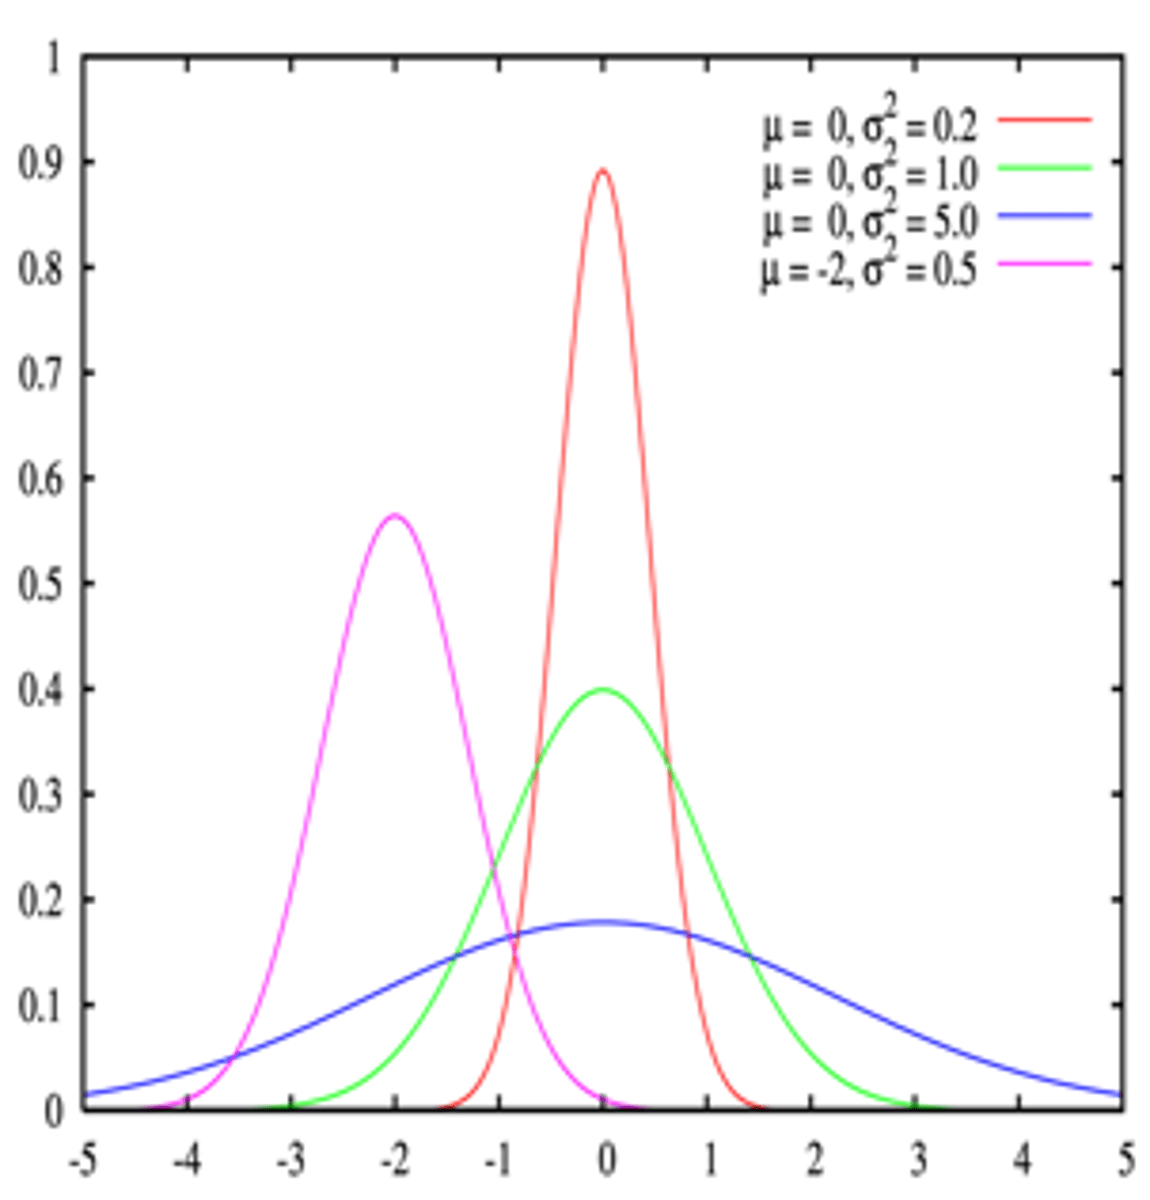
Normal Distribution - Family Example
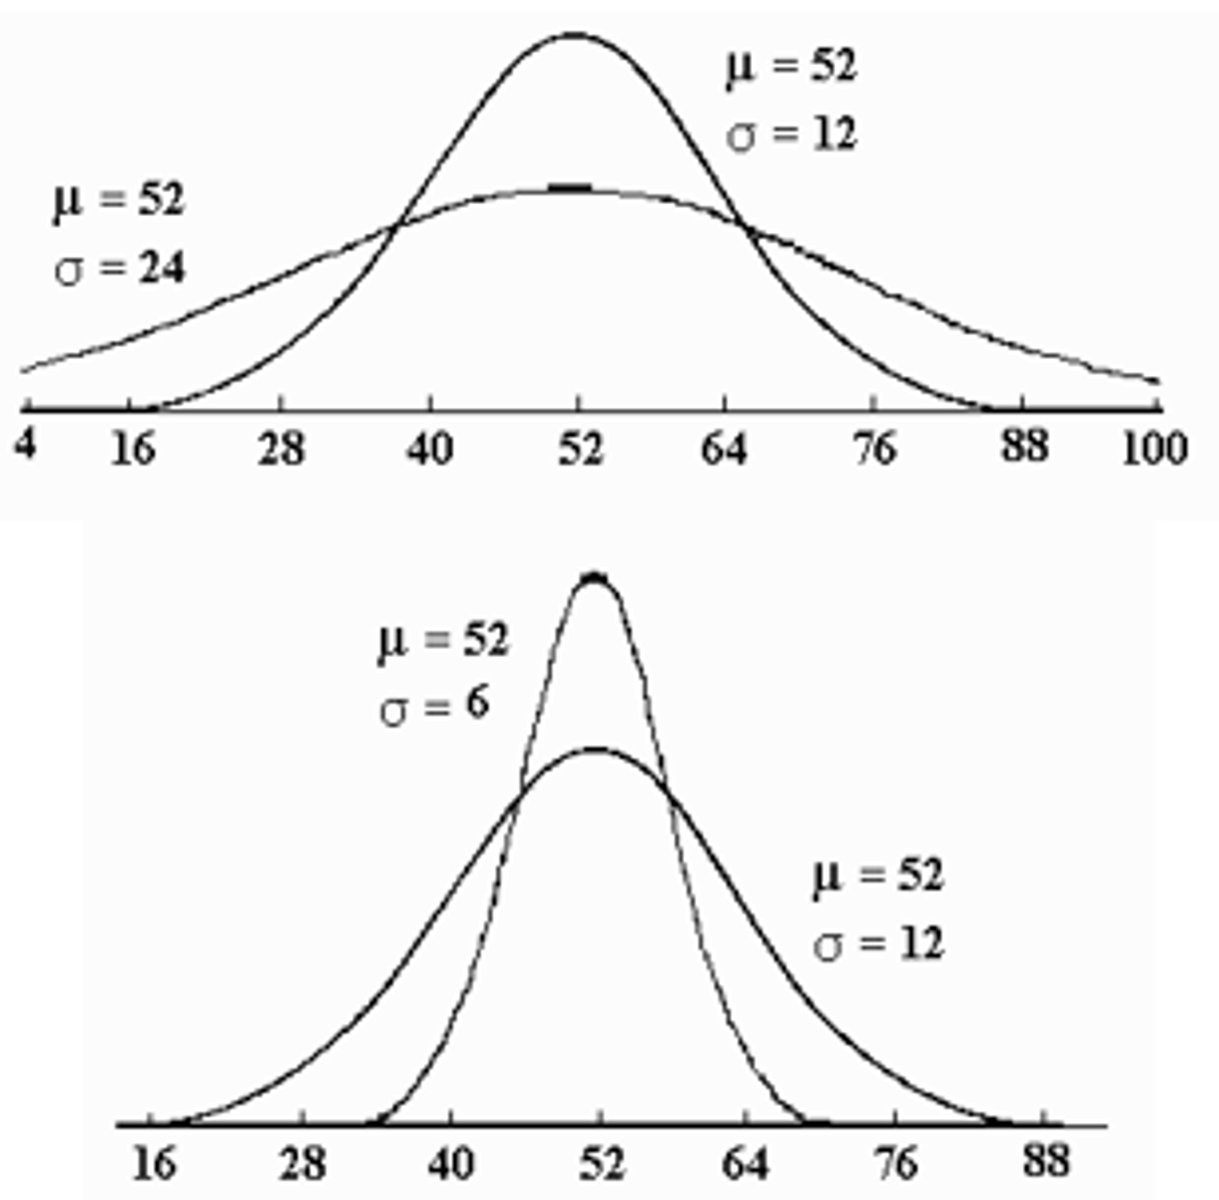
- The Normal distribution is a family of distributions with each member distinguished from another one based on the values of μ and σ
- Variance increases = Larger tails
- Whole area under curve = 1 (no matter variance or mean)
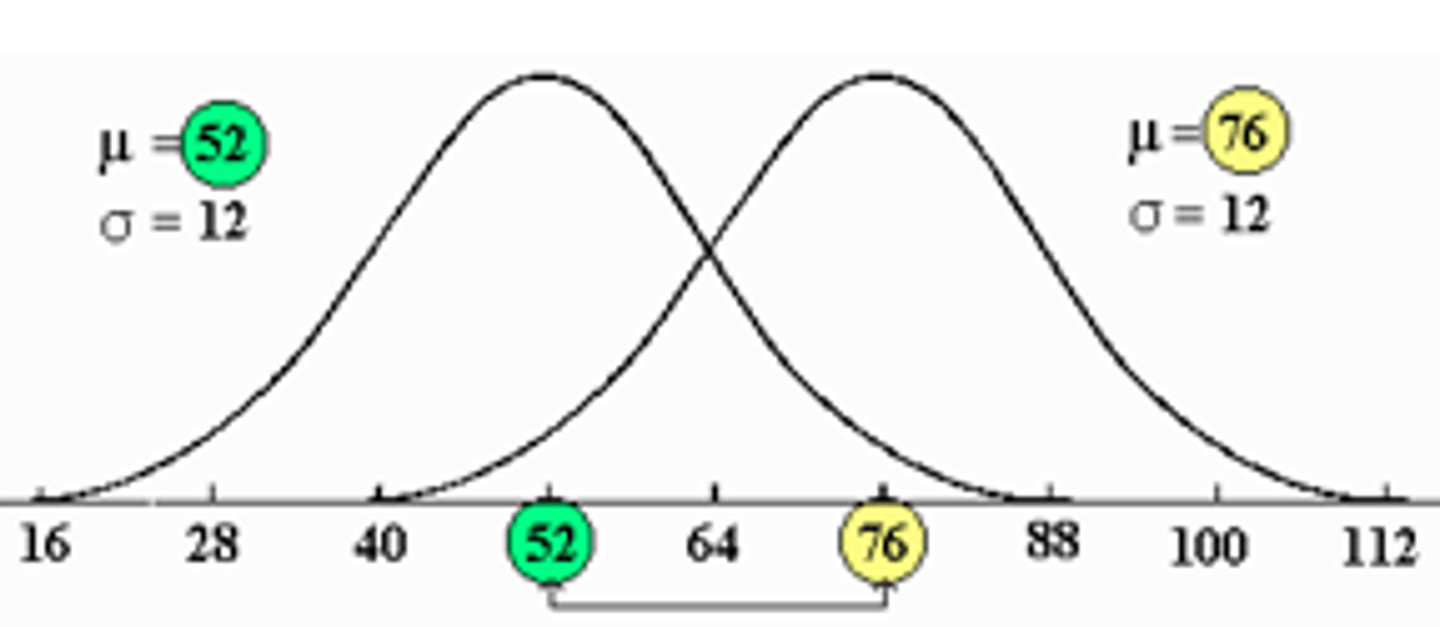
Normal Distributions with Equal Variances (SD's) & Different Means
Two normal distributions with equal variances (SD’s) and different means:
μ1 = 52, μ2 = 76
σ1 = σ2 = 12
Normal Distributions with Equal Means & Different Variances (SD's)
Standard Normal Distribution
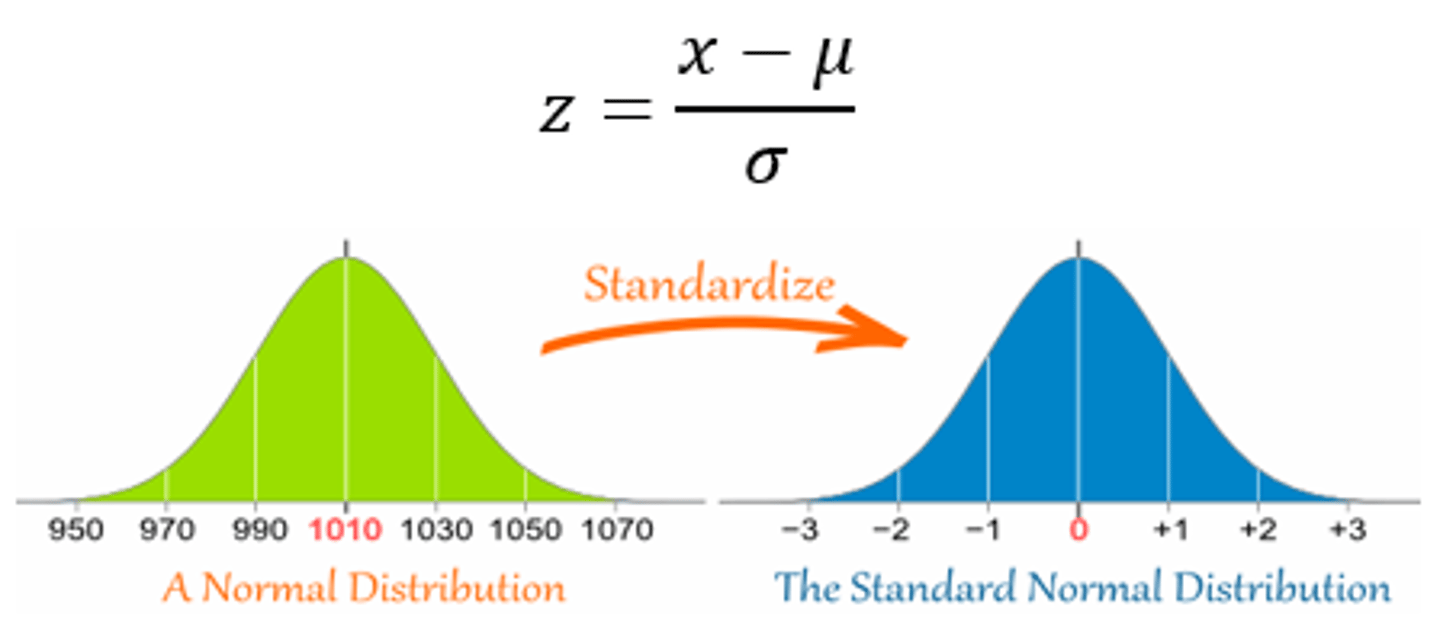
- We can standardize all normal distributions, so each has mean (μ) = 0 and standard deviation (σ) = 1 by computing the z score
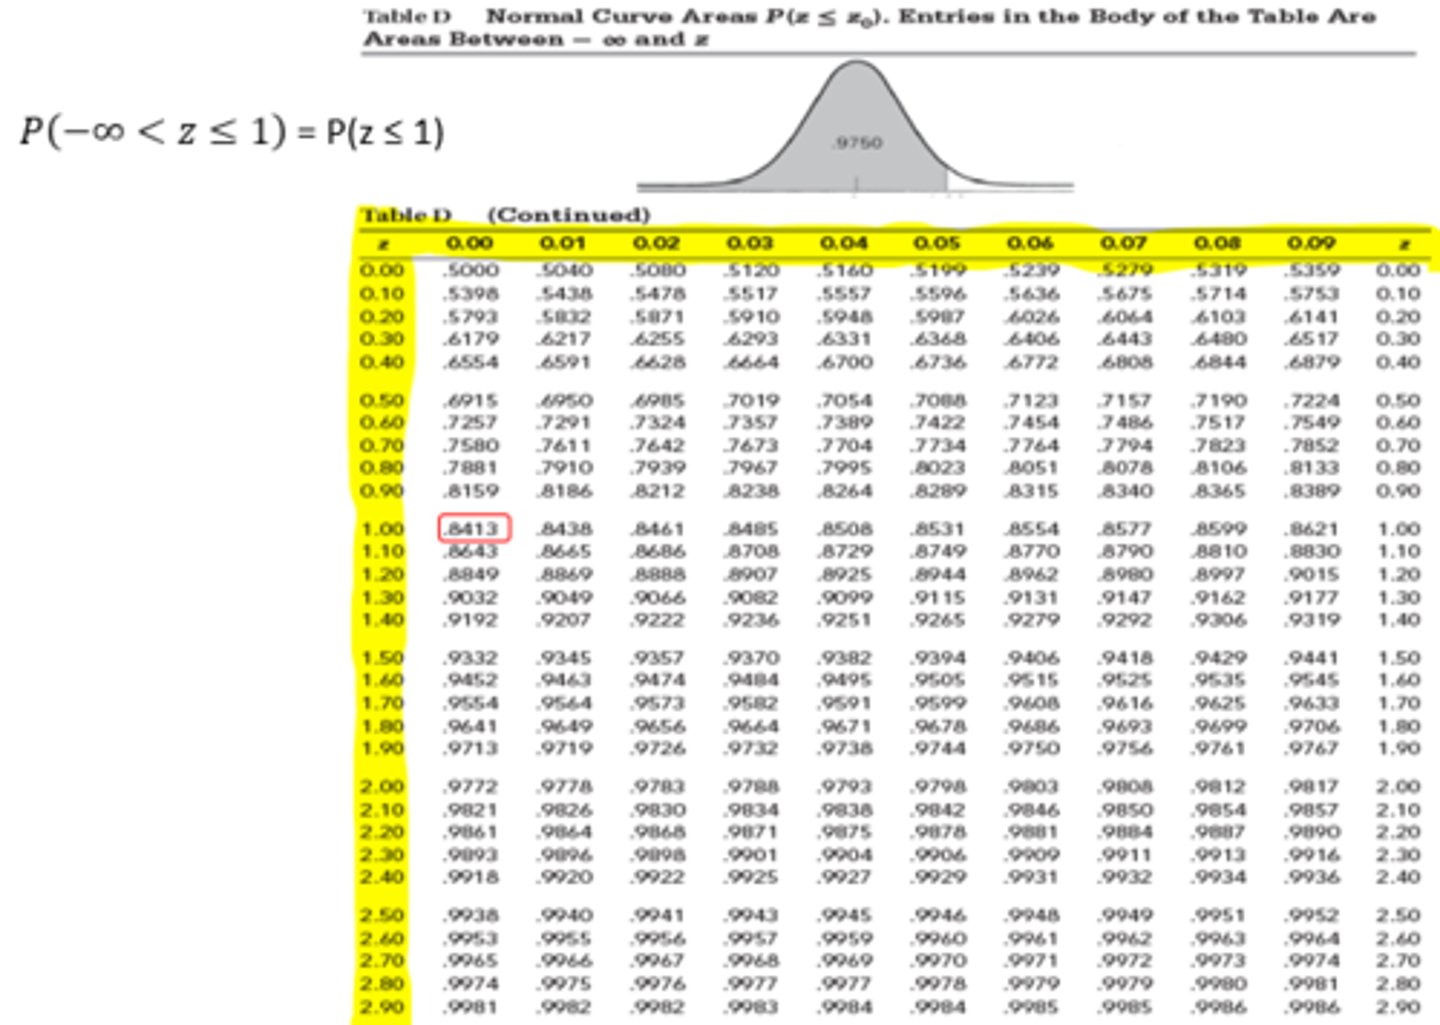
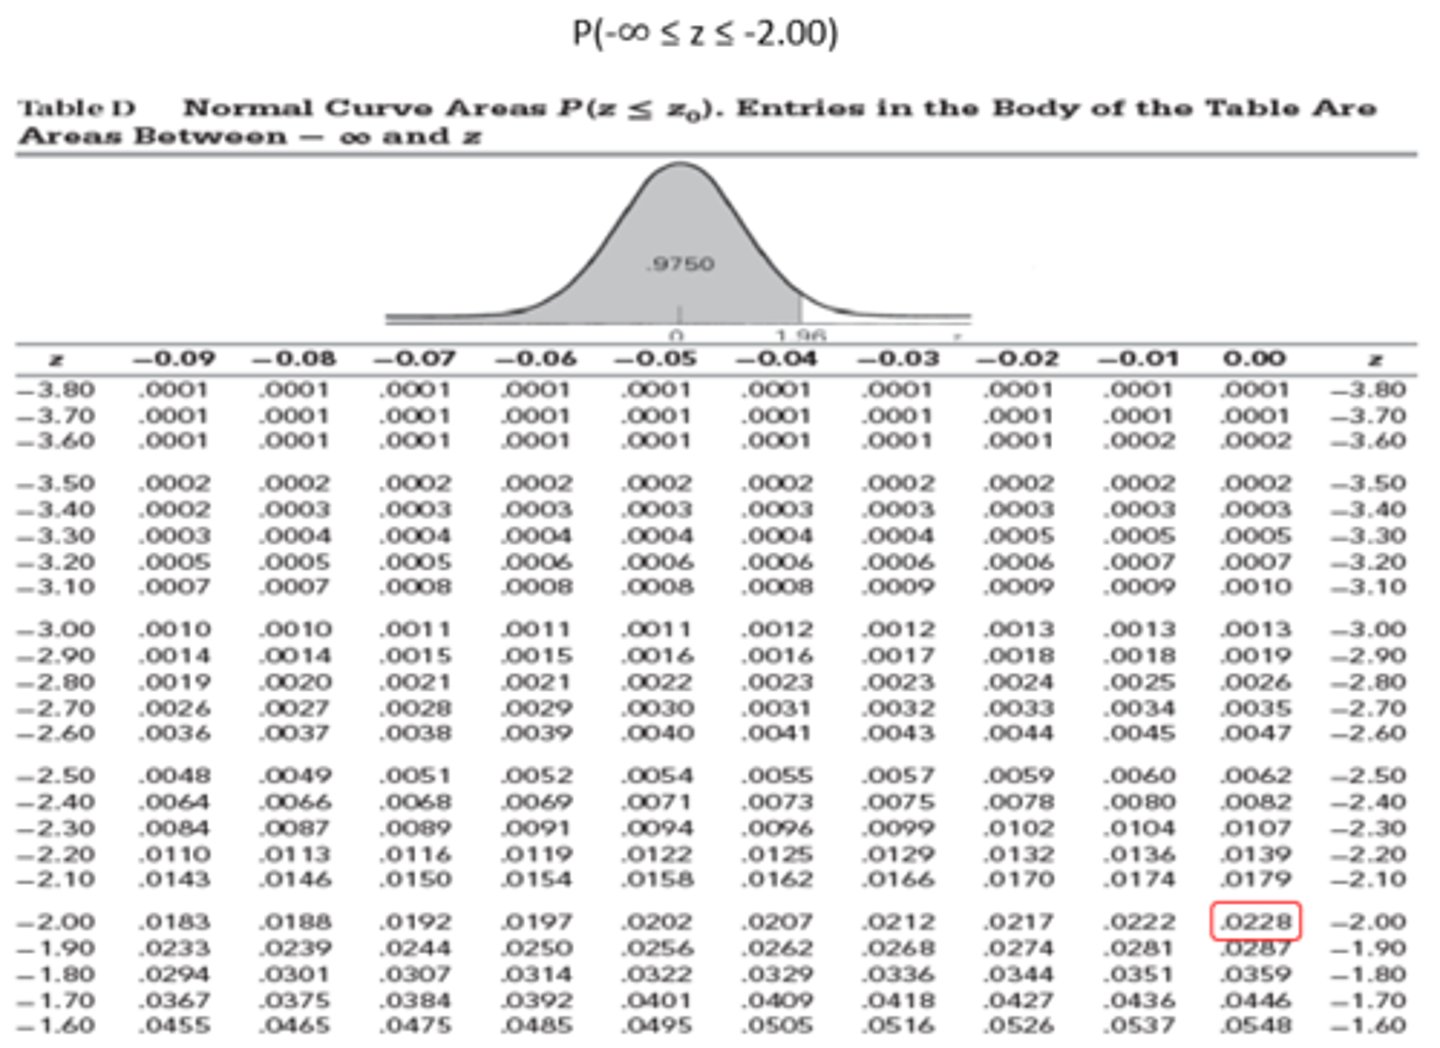
- This allows us to determine the probabilities of values for our original data using one probability table that has been created for the standard normal distribution
Normal Distribution -> Standard Normal Distribution
x = Any value from the graph
*Must transform ND -> SND to be able to caclulate resutls
SND Values - Positive
SND Values - Negative
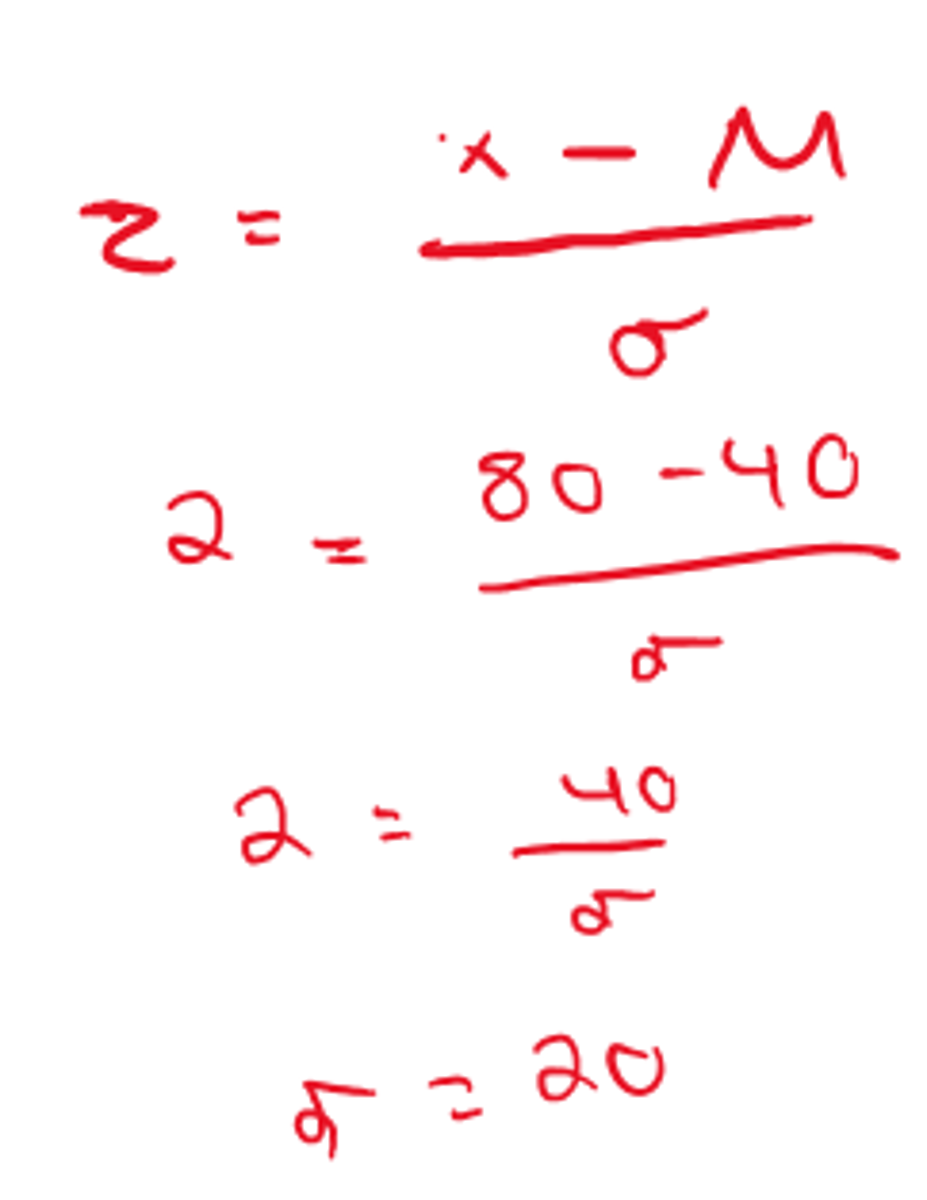
Suppose you have a normal distribution for a random variable x, with μ = 40. The z statistic = 2 for a value of x = 80 in your distribution.
What is σ?
a) 6
b) 8.5
c) 10
d) 20
Answer = D
