inferential statistics
1/20
There's no tags or description
Looks like no tags are added yet.
Name | Mastery | Learn | Test | Matching | Spaced |
|---|
No study sessions yet.
21 Terms
inferential statistics
aka analytical statistics
used to determine if relationships or differences exist btwn variables/groups
superior to descriptive statistics
types of inferential statistics
parametric
non-parametric
parametric
use statistics such as mean, standard dev, CIs, p value
t-tests, ANOVAs, certain types of correlation, regression
key assumptions: normally distributed populations, traditionally use continuous data
non-parametric
use rank or freq info
Mann-Whitney, Wilcoxon rank sum, Chi-square, Kruskal-Wallis, Friedsman test, etc.
key assumptions: nominal or ordinal level data, not a normal distribution
independent samples
unpaired, presents measures from 2+ groups of unrelated subjects
values from 1 group not related to values from other group
dependent samples
paired, presents repeated measures on same or very similar subjects
values collected at 1 point in time are related to values collected at another
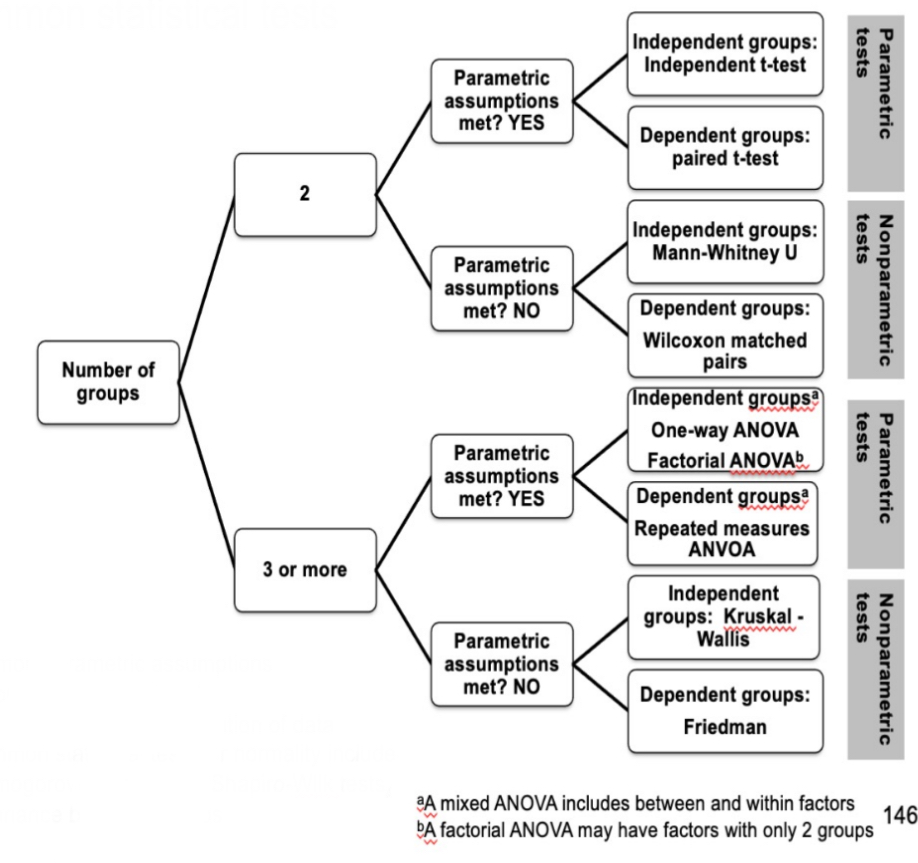
options for inferential statistical tests
depends on:
type of relationship or difference analyzed
nature of data (nominal, ordinal, etc.)
whether parametric assumptions are met
whether samples are independent or dependent
# of groups being compared
linear regression
dependent/outcome variable is continuous
may be simple or multiple (1 or 2+ predictors/factors)
relationship btwn factors and DV is demonstrated by regression equation
estimates often presented as means or proportion w/ CIs
y=a+b1×1+b2×2+b3×3…
logistic regression
dependent/outcome variable is categorical: binary (most common), multinominal, ordinal
may be simple or multiple
presented as odds ratio w CIs
cox proportional regression
used in deriving incidence estimations (burden: ex. hazard rate of per 1000 person-years) and relationships/rate estimates (predictors: hazard ratio) for categorical outcomes w considerations for time to event, esp in longitudinal cohort studies
poison regression
used in deriving incidence estimates (burden: ex. incidence rate per 1000 hrs) and relationships/rate estimates (predictors: incidence rate ratio) for count outcomes w/ considerations for exposure (i.e. participation) time
chi square test
non-parametric test of association btwn categorical variables
uses a contingency (2×2 table): row=level of IV, column=outcome of interest
assesses relative proportions of subjects w a particular characteristic in each group
compares observed vs expected frequencies if H0 were true
\chi^2 and obtained p-value
alpha levels
probability that a difference occurred due to chance
predetermined by researcher, 5%/0.05 and 99%/0.01 most common to establish statistical significance
inflated when there is repeated statistical testing=type I error; bonferroni adjustment to correct bias
lower=better
p value 0.05
5% of event likely occurred by chance
p value 0.01
1% of event likely occurred by chance
type I error
conclude that a relationship or a difference exists when there is none (false positive)
\alpha =probability of making this error
often associated with/ bias of multiple statistical tests or over sampling
type II error
conclude that no difference exists when there is one (false negative)
\beta =probability of making this error
inversely related to \alpha
often associated w bias of under sampling
type III error
conclude that no difference exists when there is one (false negative)
often associated with bias of non-adherence or lack of intervention fidelity
confidence intervals
can also determine statistical significance
95% implies that alpha is 0.05, 99% implies 0.01 and results should be interpreted as such
for LogR and HCR: values crossing 1 suggest no significance (ex. 1.5-3.2 is significant, 0.5-3.2 is not)
for LinR: “coefficients” (mean difference) 0 would be benchmark (ex. 0.5-3.2 suggests significant finding, -1.5-3.2 is not)
power
likelihood that one will detect a relationship when one exists
rule of thumb: \ge80\% (higher=better)
too much→type I error
too little→type II error
what determines sample size?
desired level of statistical power (\beta ); often \ge80\% /0.08
\alpha level to be used in research; often 5%/0.05
estimate of effect size (from past studies or guess of clinically meaningful relationship btwn groups)