Archaeological demography from material culture
1/20
There's no tags or description
Looks like no tags are added yet.
Name | Mastery | Learn | Test | Matching | Spaced | Call with Kai |
|---|
No analytics yet
Send a link to your students to track their progress
21 Terms
Progressive inclusion
When an increasing proportion of individuals in a population becomes more represented/included in particular burial practices over time (like as gravestones become more affordable) (Cannon, 1995)
DSA
Detailed study area
How have estimates for the pre-colonisation population of Hawai’i changed and why does it matter?
Estimates have changed over time, from 400,000 to up to 1 million
This matters because it suggests that the destruction caused by colonisation and the introduction of European diseases was way worse than initially thought
What are the five methods for estimating past populations with archaeology?
Osteological demography
Genomics
Settlement demography
Carrying capacity
Dating curves
What does the osteological demography method involve?
Life tables of skeletal material, reconstructing populations based on that but is difficult because of sampling and representativeness
What does the genomics method involve?
Looking at ancient and modern DNA
Population size, admixture, migrations
What does the settlement demography method involve?
Count past populations through some proxy measure of human settlement like the number of settlements, areas of settlements, rooms per settlement, individual houses, house floor area
What does the carrying capacity method involve?
Estimating resource potential of environment and amount of people that could have supported
Often doesn’t take into account surplus, very theoretical
What does the dating curve method involve?
Radiocarbon dates as data, the more carbon dates you can get, more people lived in that area (amount of cultural burning)
Obsidian hydration dating of artefacts, you can get a relative date of when an artefact was made from the amount of water absorbed into the obsidian (although not in NZ)
What is the issues with all five methods?
These methods only give rough estimates based on a lot of assumptions
How was the settlement demography method used at the Leeward Kohala Field System, Hawai’i?
Demography/population size over the four phases of agricultural development
Based on the number of structures/features associated with kumara gardens, assumptions about how many were houses, permanence and reuse, and how many people lived in each
Population and production don’t necessarily match, production is more linear, and population can level off while production goes up, creating surplus
How was the dating curve method used in New Zealand?
Looking at the growth rate for NZ, logistic (low and sharply goes up and levels off) or a more stepped pattern or is it like Rapa Nui (rapidly goes up, overshoot carrying capacity, pop goes down)
Looked at the distribution of 320 radiocarbon dates and found different patterns in different regions of NZ
What are issues with the dating curve method using charcoal?
Assuming that increasing dates of artefacts/number of radiocarbon dates correlate with population and that all charcoal correlates with human activity
Also assumptions that charcoal is all from the same activity and that things were not being traded
The number of dates is influenced by the amount of funding and location, and work typically correlates with where modern development is occurring (contract archaeology)
What did Lewis (2016) investigate and why?
Prior to this, there wasn’t much evidence about demographic changes/population reduction after the Black Death, so they looked at the frequency and distribution of pottery sherds as a proxy
What did Lewis (2016) find?
Highly dispersed areas and larger and wealthier areas were all severely impacted, not just small, nucleated, or poor areas
Some areas, especially newer ones, were abandoned, lessened population pressure so people moved back potentially
Northern, western, and central areas in eastern England were more impacted than the south
Why was Lewis’ (2016) research method important?
This method of looking at demographic change is scalable, quantifiable, and mappable and gives more small-scale info
It opens up opportunities to do similar research in other regions/countries/time periods
According to Cannon (1995), what are the potential biases and their sources in tombstone/monument data?
Men, old people, and wealthy people tend to be overrepresented in tombstone/monument data
Women are less likely to have their own headstones
Financial constraints
Differential burial practices
Gravestone destruction
According to Cannon (1995), what things help account for biases with cemetery data?
Using written records, skeletal data, and considering different burial modes can help control for problems of representativeness, but they aren’t always available or complete
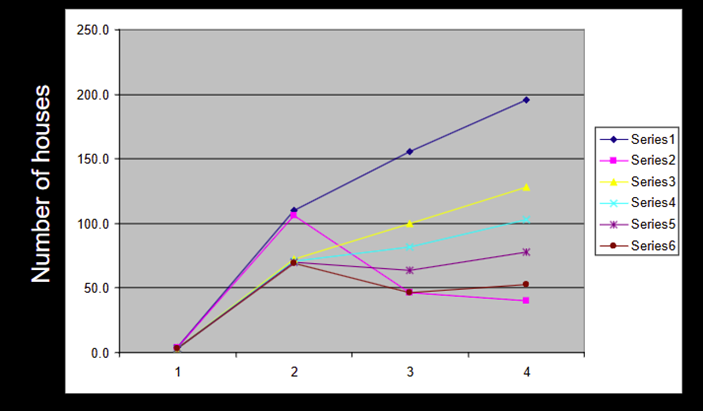
What does this graph depict?
The number of houses in the Leeward Kohala field system based in different phases of agricultural development, assuming different levels of reuse and proportions of how many were houses
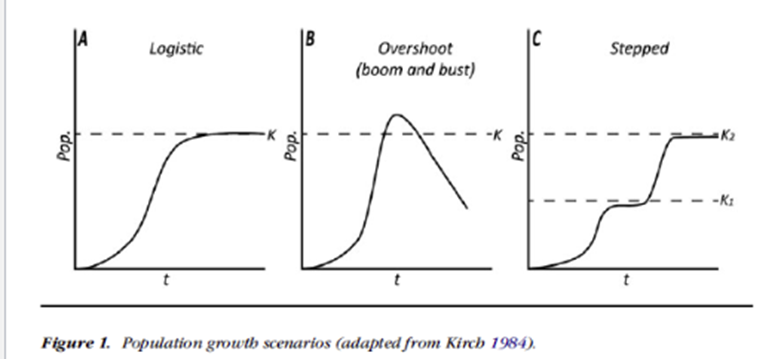
What does this graph depict?
The types of population growth/change based on radiocarbon dates
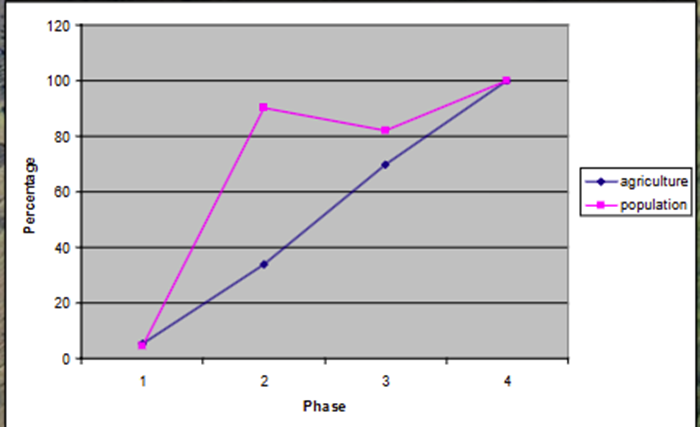
What does this graph depict?
Relationships between agricultural growth and population growth between phases at the Leeward Kohala field system, agriculture (surplus production) is linear, but population is not