Module 3: 3-1: Normal Distribution pt. 1
1/15
There's no tags or description
Looks like no tags are added yet.
Name | Mastery | Learn | Test | Matching | Spaced |
|---|
No study sessions yet.
16 Terms
Shifting data
adding or subtracting a constant to every value
Shifting data effects:
Position: center, percentiles, max/min
Shape and Spread: range, IQR, standard deviation stay the same
Rescaling data:
multiplying or dividing every value by a constant
Rescaling data effects:
Position: center, percentiles, max/min
Spread: range, IQR, standard deviation
Shape stays the same
Standard deviation measures:
location of the distance to the mean to the other observations in the sample
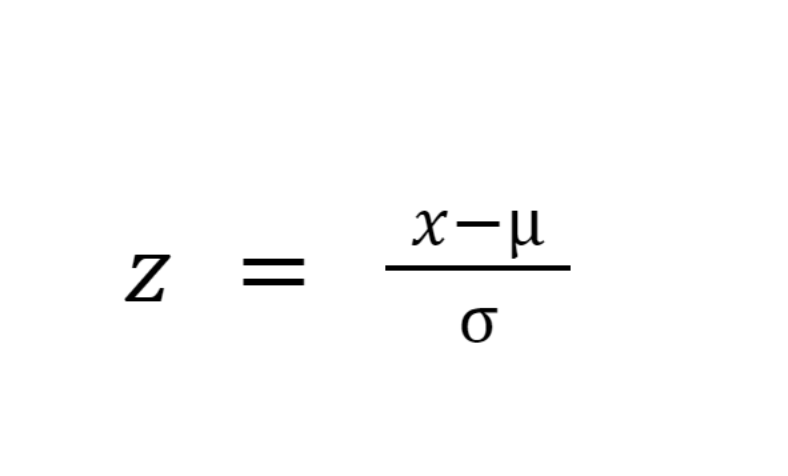
z-score (standardized value)
measure of relative standing:
how many standard deviations away from the mean and which direction?
can compare values measured on different scales, units, populations
Positive z-score
y is above the mean
Negative z-score
y is below the mean
z-score of 0
value is exactly on the mean
standardizing
changes center by making the mean 0
changes the spread by making the standard deviation 1
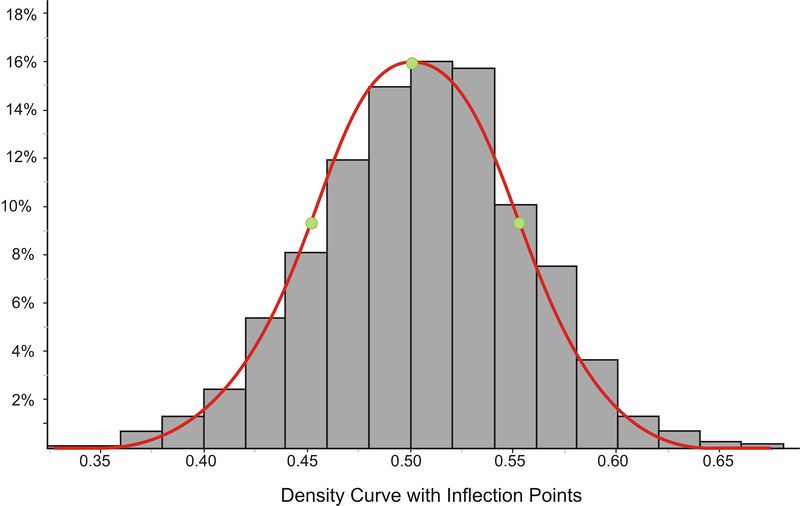
density curve
smooth curve may fit on the histogram:
density curve properties
total area equals to 1
area under under curve above a certain interval is the proportions of all observations falling in that range; P(a<x>b)
no probability attached to any single value
P(x+a)=0
Normal Distribution
provides a reasonable approximation for modelling data and used for probability distributions
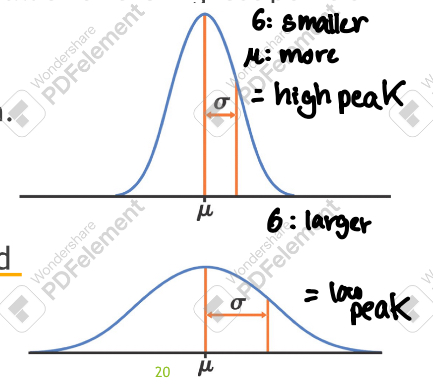
normal distribution properties
symmetric, unimodal and bell-shaped curves
every combination of a mean and a standard deviation, there is a different curve
normal distribution notation:
N(u,o)
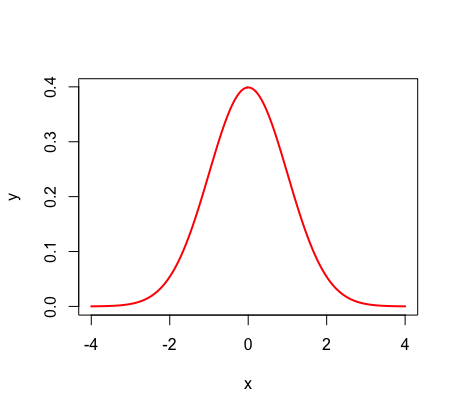
standard normal distribution notation
z ~ N(0,1)