Week 9: Correlation
1/37
There's no tags or description
Looks like no tags are added yet.
Name | Mastery | Learn | Test | Matching | Spaced | Call with Kai |
|---|
No analytics yet
Send a link to your students to track their progress
38 Terms
What are t-tests used for?
To explore differences between the means of two conditions or populations.
What is the focus of correlation analysis?
To examine how two continuous variables are associated.
What scientific question can correlation answer?
Is change in one variable associated with a change in another variable?
Is an increase in one variable associated with an increase, or decrease in another variable?
Is this change positive or negative?
What is Pearson's Product Moment Correlation?
A parametric test of relationships/associations producing a correlation coefficient, r.
What are the assumptions for Pearson correlation?
Data must be at interval or ratio level, normally distributed, and without outliers.
There should be related pairs
There should be a linear relationship between the variables
What is a scatterplot used for in correlation analysis?
To visually plot the relationship between two variables.
Describe different displays of scatterplots and what this means
Random scatter - no linear relationship
As scores on y increase, scores on x increase in a similar way - positive linear relationship
As scores on x increase, scores on y decrease in a similar way - Negative linear relationship
Curvilinear relationship: Relationship but not linear - reaches a plateau. not suitable for Pearson's correlation - e.g. inverted U-theory (arousal and performance level)
What is the null hypothesis in correlation?
There is no relationship between the variables.
What is the alternative hypothesis in correlation?
There is a relationship between the variables.
What does the correlation coefficient measure?
The strength of the relationship between two variables.
• A coefficient of +1 indicates a perfect positive relationship
• A coefficient of -1 indicates a perfect negative relationship
How is shared variance calculated in correlation?
By squaring the correlation coefficient (r).
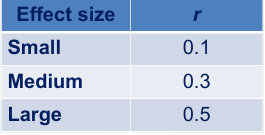
What is effect size, according to Cohen, 1988
Tells us how large the effect, or relationship is
Correlation coefficient itself is a measure of effect size
What is an example of a curvilinear relationship?
The inverted U-theory (arousal and performance level).
What is the relationship direction if higher scores on one variable are associated with lower scores on another?
Negative relationship.
What is the relationship direction if there is no linear relationship?
Zero relationship.
What is the significance of the correlation coefficient being close to -1 or +1?
It indicates a strong relationship, either negative or positive.
What is the null hypothesis regarding perceived control and coping ability?
There will be no relationship between perceived control and coping ability.
What is the alternative hypothesis regarding perceived control and coping ability?
There will be a relationship between perceived control and coping ability.
What type of correlation is used to assess the relationship between two variables?
Pearson Correlation
How to formally report the statistical results of a Pearson correlation?
1. State what type of correlation has been performed, the variables correlated, and state the direction of the relationship found
2. Report the test statistic, df, statistical significance (CI’s not generally reported for correlation) 3. Report the effect size (Cohen’s r)
4. Comment on the direction of the relationship
What does a higher score on the perceived control questionnaire indicate?
Higher levels of perceived control.
What does a higher score on the coping ability questionnaire indicate?
Higher ability to cope or more effective use of coping strategies.
What is reported along with the test statistic in correlation results?
Degrees of freedom (df) and statistical significance.
What is the Third Variable Problem?
Other measured or unmeasured variables may affect the results.
What does partial correlation do?
Calculates the relationship between two variables while controlling for the influence of additional variables.
What is the difference between zero-order and first-order correlations?
Zero-order is the initial correlation; first-order accounts for the influence of a third variable.
What should be reported when stating the results of a zero-order correlation?
Variables correlated, direction of the relationship, test statistic, df, statistical significance, and effect size.
What happens to the correlation strength when a third variable is controlled for?
The correlation strength may increase or decrease.
What is the formula for calculating the variance explained by a correlation coefficient?
Square the correlation coefficient (r^2).
What does a correlation coefficient of 0.5 indicate about variance?
25% of the variance in the dependent variable can be explained by the independent variable.
What should be included in tables and figures when reporting statistical significance?
Exact p-values.
What is the importance of checking for linear relationships in Pearson correlation?
To ensure the validity of the correlation analysis.
What is the role of descriptive statistics in correlation analysis?
To provide mean, standard deviation, and sample size (N) for the variables.
What is a common misconception about correlation?
That it implies causation between the correlated variables.
What is the effect of a large sample size on statistical significance?
Small effect sizes appear highly statistically significant.
What does a significant positive correlation indicate about perceived control and coping ability?
Higher perceived control is associated with higher coping ability.
What is the significance of reporting p-values less than 0.001?
They are reported as p < .001.
What does it mean to 'partial out' a variable?
To control for the influence of that variable in the correlation analysis.