Psychological Skills
1/153
Earn XP
Name | Mastery | Learn | Test | Matching | Spaced |
|---|
No study sessions yet.
154 Terms
Randomization
Utilized to prevent bias. Involves the random allocation of participants to different conditions or groups
Standardization
Involves ensuring that all participants are treated in exactly the same way to avoid any unwanted variables impacting the results
Order Effects
These occur if participants are required to do more than one condition. To deal with this, counterbalancing can be applied.
Demand Characteristics
These are cues that make the participants guess the purpose of the experiment, to reduce this, single blind method can be used
Researcher Bias
This happens when the researcher influences the results, either intentionally or unintentionally. To deal with this, double blind method can be applied
Random Selection
This is a method where every individual in the study population has an equal chance of being chosen. Everyone in the population the researcher is studying has an equal chance of being selected. This type of sampling is beneficial because it avoids bias and is generally representative of the larger group. However, it can be difficult to implement if the population is very large or spread out.
Stratified Sampling
A method that involves dividing the population into subgroups, based on certain characteristics, then randomly selecting individuals from each group. The population is divided into subgroups (strata) based on a specific feature, and participants are selected from each strata in a manner proportional to the population. This sampling technique ensures participants chosen are representative of key groups within the population. It can, however, be time-consuming and difficult to categorise the population into the right strata.
Systematic Sampling
A method where every nth individual is chosen from a list or sequence.Every nth person from a list or a location is selected. This method is easy to apply when dealing with large populations, but it can introduce bias if the list or location has a pattern.
Use of Questionnaires
This can allow for large amounts of data to be gathered quickly and relatively inexpensively
Interviews
This involves direct communication with participants and can help clarify responses (qualitative)
Observation
This helps in recording behaviour in a natural setting
Test retest reliability
Tests whether a measure is consistent over time
Internal Reliability
Assesses whether a measurement tool is consistent within itself
Validity
This is a measure of whether a tool is measuring what it is intended to measure
Descriptive Statistics
These provides a summary of the data gathered
Inferential Statistics
These are used to makes inferences about the population based on a sample
Graphical Representations
These include bar graphs, pie charts, histograms etc and can provide visual aids for data analysis
Informed Consent
Participants should be fully aware of the aims, methods, and implications of the research
Right to withdraw
Ps should be able to leave the study at any point
Protection from Harm
The promotion of the wellbeing of the Ps is paramount
Confidentiality
Data should be anonymized to protect the identity of the Ps
Case Studies
In-depth investigation of single person, group or event.
Apply theoretical perspectives to understand individual circumstances.
Provide unique insights of new or rare phenomenon.
Be careful of generalizability due to specificity.
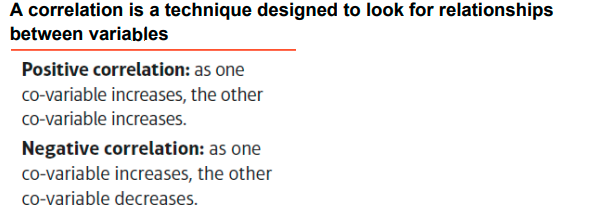
Correlational Models
Measure and observe how strongly two variables are related.
Can be negative, positive or zero correlation.
Be aware that correlation does not imply causation.
Content Analysis
Systematic and objective means of describing and quantifying phenomena.
Enables examination of large amounts of data, such as verbal, written or visual communication.
Allows qualitative coding of data to analyse patterns or themes.
Longitudinal Studies
Observations of same items over long period of time.
Can observe changes or developments over time.
Cross-Sectional Studies
Analyses data from population, or representative subset, at specific point in time.
Can contrast different population groups and their variables.
Meta Analysis
Statistical analysis that combines results of multiple scientific studies.
Can resolve contradictions between studies, and increase statistical power.
Results can be used to create evidence-based practises.
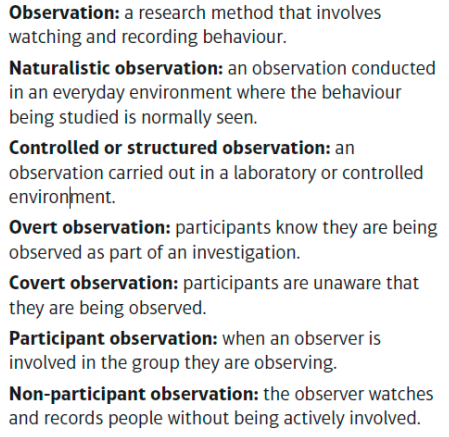
Types of Observation
Naturalistic observation
Controlled observation
Participant observation
Non- participant observation
Naturalistic observation
This type of observation occurs in the individual’s natural setting, like home or workplace, without any interference.
Controlled observation
This involves observing behaviour in a controlled environment where variables can be manipulated.
Participants observation
In this methodology, the observer becomes part of the group being observed to understand their behaviours more closely.
Non- participants observation
Here, the observer remains separate from the group being observed and doesn’t interact with them.
Stages in an Observation
Define the behaviour: Clearly define the behaviours that are to be observed. This increases reliability and validity.
operationalizing: Make the behaviour measurable and observable.
Coding systems: Devise a coding system to record behaviours. This makes data easier to analyse.
Pilot study: Conduct a trial run to ensure the coding system and observational procedures are effective.
Pilot study
Conduct a trial run to ensure the coding system and observational procedures are effective.
Characteristic of Observation
Structured or unstructured
Overt or covert
Inter-rater reliability
Structured or unstructured
In structured observations, a specific behaviour is focused on. Unstructured observations record all behaviour.
Overt or covert
In overt observations, participants are aware they are being observed. In covert observations, they are unaware.
Inter-rater reliability
This is the level of agreement in the recording of observations by different researchers.
What are the limitations of observation
Observer bias: Observers might interpret or notice things that align with their expectations.
Reactivity: Participants might change their behaviour if they know they are being observed.
Ethical considerations: Covert observations can raise issues of consent and deception.
Time and resource heavy: Observations, particularly naturalistic ones, could take a lot of time and resources.
Experimental Design
Features three main types: Independent Measures, Repeated Measures, and Matched Pairs.
Independent Measures : Involves using two separate groups of participants, one for each condition of the experiment. It eliminates order effects, but participant variables may obstruct results.
Repeated Measures : Uses the same participants in all the conditions of the experiment. It reduces participant variables but risks order effects.
Matched Pairs : Participants are paired based on their similarity on a key variable, and each participant in a pair is allotted to a different condition. This balances the pros and cons of the other two designs.
Hypotheses
Hypotheses are predictions made before the start of an experiment. Hypotheses are statements made by researchers, predicting an expected outcome or relationship between variables. They might be:
Directional Hypotheses: Predicts the direction of the effect (e.g. ‘People who drink energy drinks will perform better than those who don’t’). The prediction is very specific. It states the direction of the effect (i.e., ‘greater than’, ‘less than’).
Non-Directional Hypotheses (Two-Tailed): Predicts an effect will occur, but not the direction (e.g. ‘Energy drinks will affect performance’). It simply states that there is a difference or a relationship but does not predict the direction of this effect.
A null hypothesis (H0) predicts no relationship or difference between variables.
Alternative Hypothesis (H1): An alternative hypothesis predicts a relationship or difference between variables. It could be directional or non-directional.
Questionnaires
Useful for large data collection, but may not capture qualitative information.
Should have clear, unbiased questions.
Can be self-administered or researcher administered.
Questionnaires are a set of designed questions. They are used to quickly collect data from a large group of people.
Distinguish between open-ended and closed-ended questions. Open-ended questions allow participants to respond in their own words while closed-ended questions have a set of predefined responses.
The Likert scale is commonly used in questionnaires to measure attitudes or feelings.
Make sure the questions are not leading or bias, as this could manipulate the participant’s response.
Interviews
Can gather deep insights, but are time-consuming and require skilled interviewers.
May be structured (set questions), semi-structured (guideline questions), or unstructured (open-ended conversations)
Interviews involve the researcher directly asking questions to the participant. They’re generally conducted in person, though phone or online interviews can also be valid.
There are two main types of interviews: structured and unstructured. Structured interviews have a set list of questions, while unstructured interviews don’t follow a rigid structure and allow for more spontaneity.
Remember the concept of interviewer bias, where the interviewer may subconsciously influence the participant’s responses.
There’s also the semi-structured interview, which includes both predefined questions as well as room for following up on interesting responses.
Probing questions are used to dig deeper into participant’s answers and gather more detailed responses.
Bear in mind the issue of social desirability bias where individuals modify their responses to appear favourable or socially acceptable, especially in face-to-face interviews.
Laboratory Experiments
Conducted in artificial, controlled environments. High control over extraneous variables, but may lack ecological validity.
Field Experiments
Conducted in natural environment, have higher ecological validity, but less control over extraneous variables.
Natural Experiments
Where the independent variable is not manipulated (it occurs naturally). High ecological validity, but cannot establish cause-and-effect relationships.
Formulation of Hypotheses in Research
Hypotheses are formulated after thorough review of related literature and understanding of the research question.
The alternative hypothesis is what the researcher really thinks is the case and is trying to prove.
The null hypothesis is the “default” view - that there is no effect or difference.
Testability of Hypotheses
A hypothesis must be testable and measurable. It should clearly define the variables and the expected relationship or difference between them.
Operationalising variables is a key step to make them measurable.
Role of Hypotheses in Psychological Research
Hypotheses guide the direction of the study, help design experiments, and determine analytical methods.
They are critical for replicability of the study. Other researchers must be able to test the same hypotheses under the same conditions.
Hypotheses are provisional. They can be supported or refuted based on the results, leading to further hypotheses and research.
Independent Measures Design
Different participants are used in each condition of the independent variable.
This helps to prevent order effects such as practise or fatigue influencing the results.
However, it introduces participant variables, differences between participants that may affect the results (e.g., intelligence, mood, age).
Repeated Measures Design
The same participants are used in all the conditions of the independent variable.
This helps control participant variables as each participant is their own control.
But it might introduce order effects, such as boredom or improved performance due to practise.
Matched Pairs Design
Different, but similar participants are used in each condition of the independent variable. They are deliberately matched on key characteristics.
This attempts to control both participant variables and order effects.
Random Allocation
Random allocation is used to assign participants to conditions in the independent measures and matched pairs design. This helps to avoid systemic bias and ensure the experiment is fair.
Counterbalancing
In repeated measures design, counterbalancing is used to control for order effects. This involves changing the order in which tests are administered.
Use and Appropriateness of Each Design
Independent measures is suitable when order effects are likely to heavily influence performance.
Repeated measures is useful when the researcher has a small sample size or wants to reduce participant variables.
Matched pairs is best when both participant variables and order effects may heavily impact results, but it requires significant time and resources for participant matching.
The choice of design should be based on the nature of the experiment and its practical constraints.
Snowball Sampling
Snowball sampling: Current study participants recruit future participants from among their acquaintances. This technique is useful for reaching populations that may be inaccessible or hard to find, but can result in bias due to the interconnected nature of the individuals sampled.
Quota Sampling Techniques
Quota sampling: Similar to stratified sampling, but participants are recruited until a certain number (quota) for each subgroup is reached. This method is less random, but can be faster and ensure all groups are represented.
Opportunity Sampling Techniques
The researcher uses whoever is available and willing to participate. This technique is cost-effective and easy to execute. However, it may result in a sample that is not representative of the population, skewing results.
Types of Data
Qualitative data, Quantitative data, Primary and secondary data, Mixed method data
Qualitative data
Qualitative data is non-numerical and descriptive. It often comes from open-ended questions, interviews, or observations.
This type of data provides insight into attitudes, behaviours, and experiences.
Some key characteristics of qualitative data include depth and detail. It seeks to understand the ‘why’ and ‘how’ of behaviour and experiences.
Analysing qualitative data involves interpretation and categorization. Methods like content or thematic analysis may be used.
Common criticisms of qualitative data include subjectivity, risk of bias, and difficulty in generalising findings.
Quantitative data
Quantitative data is expressed in numbers and can be quantified. It often arises from experiments, surveys with close-ended questions, or structured observations.
This data type can provide generalised results and statistically significant findings.
Key characteristics of quantitative data are objectivity and measurability. It looks for statistical relationships, differences, or similarities.
Methods for analysing quantitative data usually involve statistical procedures. These results are often easier to represent visually (like graphs or charts).
Critics of quantitative data argue it might lack context and depth, possibly oversimplifying complex psychological phenomena
Primary and Secondary data
Primary data is collected by the researcher specifically for their study. It is raw, first-hand, and relevant to the research question.
This type of data can be either qualitative or quantitative and can offer control over the data collection process.
However, gathering primary data can be time-consuming and expensive.
Secondary data is data that was collected by someone else for a different purpose.
This data can offer a larger data set and save time and resources as the data is already collected.
The limitations include potential irrelevance to the research question, questionable reliability and validity, and lack of control over data collection.
Mixed method data
Mixed-method data involves the use of both qualitative and quantitative data in the same study.
This method seeks to use the strengths of both data types to provide a fuller understanding of a research question.
It can help reduce the weaknesses and limitations associated with using only one data type.
However, interpreting mixed-method data can be complex and time-consuming, requiring a detailed understanding of both data types.
Strengths and weakness of Qualitative Data
Strengths ● Allows researcher to gain an insider's view on the subject matter, elaborating on certain aspects of the research by providing a more nuanced perspective. ● Allows for the researcher to suggest possible relationships, cause and effects, etc. ● Holistic
Weaknesses of Qualitative Data ● Subjective interpretation (However, Thematic Analysis Techniques can transform qualitative data into quantitative data. This can be used as a counterpoint) ● Very laborious to collect - can take time and effort ● Costs a lot too as people such as Coders may be required. Less Economical ● Usually comes from smaller samples. Less generalisable
Strengths and weakness of Quantitative Data
Strengths Of Quantitative Data ● Straight up. Objective. ● Quicker to analyse and administer ● Can come from larger samples as it is easier to administer a quantitative assessment and analyse it rather than a qualitative one
Weaknesses of quantitative data ● Cannot give insight to data alone. ● Reductionist
Primary data and secondary data
Primary data is data collected for a specific research purpose first-hand by the researcher
● Secondary data is data used in a study that has already been collected. Usually for a different purpose.
+and- of Primary data
Primary Data Strengths ● Fits the researcher's aim so makes the research gathered more valid and applicable to what the researcher is researching ● More ethical (This point will be explained by the weakness of secondary data)
Weaknesses ● Expensive to carry out and time consuming ● Can be subject to researcher bias which may skew the data
+and- of secondary data
Secondary Data Strengths ● Cheaper and easier to collect ● To eliminate any reliability, validity, etc flaws, the researcher can eliminate such studies from their repertoire and use ones that have been peer-reviewed, assessed, etc.
Weaknesses ● May not fit researcher aim which can make the data less applicable ● Unethical as participants of the original study may not have consented to having such data used in other studies beyond the first. ● Research that they use may not exactly be as valid or reliable. Since it is not done first-hand there's always the risk that the research was conducted incorrectly, had confounding variables unaccounted for, etc
Random sampling
Random Sampling: A technique used to gather a random sample of participants from the target population ●
Example: Assigning numbers to each potential participant and placing them in a hat and drawing one randomly
Strengths: ● Generates a representative sample as everyone has an equal chance of being selected ● Eliminates any bias the researcher has in selecting participants
Weakness ● Participants have to agree to being in the study/experiment. If not, this leads to a less representative sample ● Target population may be too large to assign numbers to May not proportionately represent sub-groups of a population e.g the draw might yield 35 white people and 15 black people even though there were 50 black people and 50 white people to choose from
Stratified sampling
A method by which to ensure sub-groups of a target population are proportionately represented. ○ e.g ensuring that in a population of 2000 males and 6000 females, 1/4th of each population is represented, leaving 500 males and 1,500 females. ● (You don't need to know the mathematics behind it. Just know it proportionately represents people proportionately in a population)
Strengths ● Most representative sample generated ● Unbiased analysis as all subgroups are proportionately chosen meaning researcher can account for a bias when selecting participants
Weaknesses ● Participants need to consent to be part of the experiment thingy, if they reject, it leads to a less representative sample ● Time consuming to carry out
Volunteer sampling
● Newspapers, adverts, etc. Just asking for people to participate ●
Strengths ● Most ethical form of sampling as consent is given ● Able to be distributed to a large audience rather easily which can increase reliability as more participants are present potentially
Weaknesses ● Biased sample - May contain people of the same personality, character, etc. Less reliable and decreases validity ● May take a while to filter all participants to ensure they are fit to be in a study as per the BPS code of ethics and potentially UNCRC if it is a child experiment
Opportunity sampling
Gathering participants from a specific location at a specific time. Those who are readily available ● This can include asking people to partake in an experiment or observing them without their consent
Strengths ● Quickest and easiest to employ
Weakness ● Unrepresentative as it only accounts for whosoever was available at the time ● Experimenter bias as they choose who gets in and who doesn't.
Independent measures design
Independent Measures Design: ● Participants are split into groups, with each group tested in only one condition of study
Strengths ● No Order Effects ● No Demand Characteristics
Weakness ● Less economical as more participants needed ● Variability between each group (Individual differences). Which can likely make comparison between two groups difficult. Decreases Validity
Repeated measures design
The same participants are used in all conditions of a study.
Strengths ● Less Variability. Increased Validity ● More economical as less participants required
Weakness ● Demand Characteristics can arise ● Order effects (can be countered via counterbalancing)
Matched pair design
● Different participants are used in each condition of the study, but are matched for likeness on important characteristics.
Strengths ● Fair Comparisons can be made as both groups are equally matched
Weakness ● Time consuming to match people ● May not be equally matched as some personality and physical characteristics aren't 100% similar in everyone
Hypotheses
Null Hypothesis ● There is no effect of the IV on the DV and any different is due to chance
Alternate Hypothesis ● A prediction oof the outcome of a study based on what the researcher expects the IV to do to the DV
Directional and Non-directional hypothesis ● Directional hypothesis specifies where the difference/relationship will occur when the IV has an effect on the DV e.g Drinking caffeine will increase the number of digits recalled from memory by 5. It Predicts where the hypothesis will go
Non-directional hypothesis predicts that a difference or relationship WILL be observed, but does not specify where or how it will occur.
Questionnaires
● A self-report research method that asks participants about select questions about a topic
Strengths ● Inexpensive way of gathering information from a large sample ● Ethical as participants do not need to complete them ● Less social desirability bias
Weakness ● Response rate for questionnaires may not be low as the participants may not have incentive ○ (Mention open and close ended questionnaires if u need to) ● Self report data is unreliable
Open ended questionnares
Allow the participants the freedom to answer in any manner they want. Questions with no fixed response ●
Strengths: ● Doesn't limit the participants from answering in a manner they want ● Yields rich qualitative data
Weakness ● Subjective interpretation might occur which may have the answers lose their meaning ● Time consuming to analyse
Closed ended questionnaires
Have fixed responses participants choose from
Strengths ● Quantiative data ● Easier to analyse and quicker ● Objective interpretation
Weakness ● Limits how the participants answer, which may not be how they actually feel ● no qualitative data generated which makes it difficult to provide insight to their answers
Interviews
A research method designed to gather self reported information from participants
General Weaknesses ● Social desirability bias ● Interviewer effect (causes demand characteristics)
Structured interviews
A set of pre-set questions asked to a respondent
Strengths of Structured ● Gathers a lot of information from a large number of people relatively quickly ● Little training for interviewers required ● Easy to replicate
Weaknesses of Structured ● Superficial information gathered ● Limits freedom to answer
Unstructured interviews
Strengths of Unstructured ● Most in-depth information gathered as participants are allowed to answer fully and freely
Weakness of Unstructured ● Need to be well trained interviewers ● Lots of time taken to analyse data, code it, etc.
Semi structured interviews
● a mix of pre-set questions and unprepared questions asked to a
respondent
Strengths of Semi-Structured ● Allows freedom in answering as interviewers aren't stuck to one pre-set script ● Interesting avenue of conversation can be explored which can provide rich qualitative insight
Weakness of semi-structured ● More training required from interviewers
Laboratory experiments
a procedure staged in an artificial environment
strenghts: the most scientific of research methods because of high levels of controls. Cause and effect can be established between IV and DV, which can help with internal validity
weakness: conducted in an unnatural environment. Ps are invited to the experiment so they may display demand characteristics. Considered reductionist because it isolates only the variables under consideration, ignoring other variables that could also be involved
Field experiment
procedure staged in a naturalistic environment
strengths: conducted in a naturalistic environment, so the behaviour is natural. There is cause and effect between the IV and DV, and some extraneous variables can be controlled
weakness: not all extraneous variables can be controlled because it is real life environment. Ps may be unaware of taking part so researchers may not have gained informed consent
Observation
● A research method that involves watching and recording behaviour ● Observations gather both qualitative and quantitative data. ● Qualitative through noting characteristics, behaviours and interactions of individuals or groups being observed. ● Quantitative through tallying, time sampling and event sampling ● ● Event sampling is recording a behaviour as soon as it is performed ● Time sampling is recording a behaviour at specific intervals ● Tallying is literally recording the behaviour through a tally chart. ○ This provides quantitative data.
AO3 points for observation
Strengths ● Inter-rater reliability can help increase the reliability of observations ● Gathers qualitative data which provides a rich, in-depth understanding of behaviour
Weakness: ● Unreliable if certain measures arent in place, such as observers not detecting behaviours, or subject interpretation of behaviour ● Observer bias reduces validity as the observer becomes involved in the group being studied ● Ethical issues with covert observations
+and- of each type of observation
Structured:
+ Extraneous variables controlled. Increased validity + More reliable as done in controlled environment
-Demand characteristics -Subjective interpretation
Participant:
+ No stranger observing participant observing the behaviour. Reduced demand characteristics + Reveals data that might be missed by other methods e.g how Punch integrated herself into Bolivia and then observed
-Active involvement in the group can cause the researcher to lose objectivity and may lead to bias
Non-participant:
+ Allows researchers to concentrate on recording data
-Limited in terms of validity as the presence of an observer can cause demand characteristics
Overt:
+ Ethical as informed consent can be obtained and participants can be informed of their right to withdraw
-Demand Characteristics
Covert
+ Less demand characteristics
-Unethical
Correlations
Correlations can go from -1 to +1 with the former representing the strongest possible negative correlation and the latter representing the strongest possible positive correlation. Correlation is NOT Causation. A perfect correlation IS NOT CAUSATION we cannot establish cause and effect, even with a perfect correlation coefficient. Correlation
Strengths and Weaknesses:
Strengths: Useful for examining relationships between many variables. Applicatory value Cheaper Less time consuming Ethical
Weakness: Cause and effect cannot be established due to the fact that we cannot say that the increase of one variable can cause the other to occur; And a third variable may have been influencing the results of the study without it being accounted for
CAT (Computerised Axial Tomography) scans
Used to take images of any part of the body including the brain Involves passing multiple X-ray beams to the head at many different angles to gather more information.
AO3 points for CAT scans:
Strengths: CAT scans can produce three-dimensional images from different angles without being affected by overlap of organs, making them very useful for detecting brain damage. A CAT scan is non-invasive and painless. However, if a dye like iodine is used it is invasive to an extent.
Weakness: Radiation exposure can cause damage to unborn foetus and to humans in general Very costly to perform
PET (Positron Emission Tomography) scans
Patients are injected with fluorodeoxyglucose as a tracer. The blood will absorb the tracer and a task will be used to stimulate the brain and encourage activity. Brain will use up the glucose an d the FDG will emit positrons and releasing gamma rays,w hich the scanner picks up. High activity areas will show high concentration of gamma rays.
AO3
Strength: PET Scans have been consistently shown to measure what they claim to e.g Broca's areas have constantly been linked to speech using PET scans Its ability to differentiate between non-cancerous and cancerous tumors, Reliable as repetition is consistent and does not change as much
Weakness: Radiation exposure cancer Invasive procedure due to the taking of Fluroodexyglucose Expensive asf
fMRI (Functional Magnetic Resonance Imaging)
Scans blood flow in the brain to measure activity. Head placed in a powerful electromagnet, and changes in blood flow in the brain are used to produce images of neural activity. Haemoglobin in RBC changes its magnetic properties depending on whether it is carrying oxygen or not. These are picked up by the scanner and a map of neural activity is created.
AO3 Points for fMRI
Strengths: Extremely non-invasive and least risky. fMRI scans have good spatial resolution. Greater spatial resolution allows psychologists to discriminate between different brain regions with greater accuracy.
Weakness: Extremely expensive the results of an fMRI scan can be difficult to interpret
Twin Studies and Aggression
Provide psychologists with a unique design to test the influence of nature and/or nurture on human behaviour. Monozygotic twins share 100% of DNA Dizygotic twins share only 50% of DNA
The extent to which behaviour is same between twins is known as the concordance rate If the concordance rate was equally high or low relative in dizygotic twins relative to monozygotic twins, the researchers presume there is no strong genetic component.
Coccaro et al (1997) found that in their study of male twins, there was a high chance that aggressive traits would be found in both twins - suggesting that impulsive aggression could be at least partly due to genetic factors.
The use of animals in laboratory experiments
Arguments For
Rats are used in psychological research due to how quickly they can reproduce. This makes them useful lab rats and also helps establish generational influence in a shorter amount of time. Experimentation with animals offers a higher degree of control therefore higher validity Animal research has provided insight into vital areas of medical research including drug treatments, transplants, surgical techniques and cloning Utilitarianism would argue that the death of a small amount of animals for the lives of millions if not billions of other animals and humans would be justified Humans and animals share - to some extent - features such as the nervous system and other structures which can help generalise findings from animals to humans
Arguments Against
Ethical issues regarding the use of animals: Generalisation of animals to humans is pretty meh Ethics regarding the use of animals in drug tests and other stuff which can cause harm to them Specieism!!!!
Case studies
A case study is an in-depth investigation into one person or a group of people. It involves using a range of research methods such as interviews, experiments and observations. Typically used for rare or unique individuals or events
Freud used case studies to investigate Little Hans to provide support for his psychodynamic theories (Oedipus Complex). He also used it for his Ratman and Wolfman studies. It involved a series of dream analysis and free association. Freud encouraged them to say whatever came to their mind without censoring them.
Case studies were used in cases for brain functioning such as that of Phineas Gage.
It also has practicality in Criminal Psychology. Bowlby (1944) conducted a case study to investigate the effects of maternal deprivation
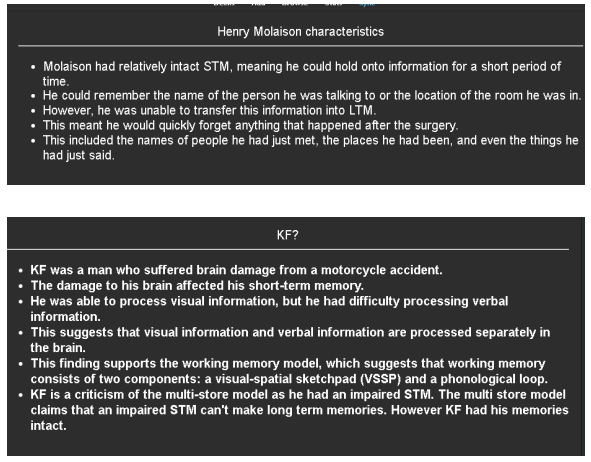
Clive wearing, HM characteristics and KF
clive wearing: he has severe anterograde amnesia, which means he cannot form new ling term memories. Clive wearing’s STM is also impaired, he can only remember information for a very short period of time, usually only a few seconds. He is however able to remember things like how to play a piano , but doesnt remmeber his univeristy life
Content Analysis
An observation that studies human behaviour indirectly. Usually through the medium of magazines or TV shows. It is a method used to numerically analyse qualitative data, converting it to quantitative data
It involves checking the
Manifest Content: Superficial understanding of the text Latent content: Deeper meaning of the text which could include sexist depictions of women
Content is something people have created, these are called artefacts. In content analysis, the most important process is categorising the data.
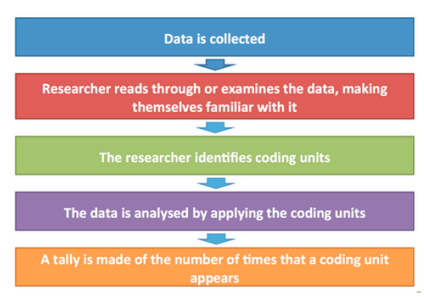
How to carry out content analysis
First, the artefacts are collected. A representative sample is required. Then, a coding system is created such as the gender of the person in the kitchen after this, the researcher tallies the frequency of each (in this example) man or woman in the kitchen
AO3 points for content analysis
Strengths: More reliable form of observation as it can be easily replicated so long as the artefacts are publicly available. Inter-rater reliability could also be used to increase the reliability. It is an easy technique to use and not too time consuming, and allows statistical analysis due to collecting quantitative data, this allows for a correlation to be shown Ethical asf High ecological validity because they are based on observations of real things people engage in e.g magazines or tv shows
Weakness: Observer bias is very prominent in any type of observation and can affect the validity of the observation. Causality cannot be established as it describes the data. An experiment must be performed to investigate causality
Randomized controls trials
Randomized Controlled Trials (RCTs) are considered the “gold standard” in medical and health research due to their rigorous design.
RCTs consist of a control group that serve as a comparison group The control group is matched as closely as possible to the experimetnal group, including age, gender, social class, ethnicity, etc.
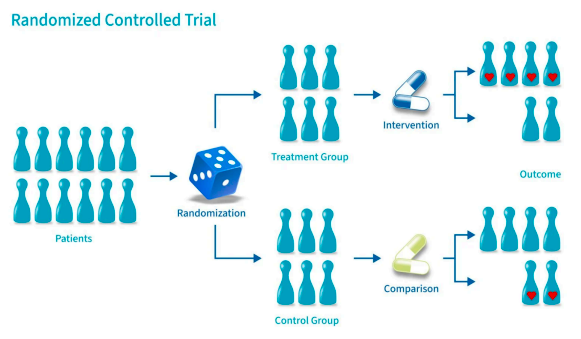
Random allocation
When participants are randomly assigned to a condition of the study. This is done to ensure there is no researcher bias in assigning those to the intervention group or the control group. This is all done to see if there is a relationship between the intervention group and control group. Statistical tests can be conducted to assess the significance.
Sometimes, the control group and intervention group don't know which one they are e.g Experimental drug vs placebo. Strengths Prevents Bias in allocation of conditions. Increases valdiity High statistical power as since both groups are balanced and matched to ensure similar sex, gender, social class, ethnicity, etc. Blinding people about which group they're in can reduce demand characteristics Weakness Unethical due to blinding RCTs are longitudinal in nature meaning some of the participants may drop out. Threatens the statistical power of the experiment and validity. Requires large sample size to show a concrete difference