Psych 308 Exam 2
1/127
Earn XP
Description and Tags
Name | Mastery | Learn | Test | Matching | Spaced |
|---|
No study sessions yet.
128 Terms
t-critical
the value that marks the boundary for your statistical decision in a t test based on the chosen alpha level and the df
Standard error (for paired samples t-test)
average distance mean differences are from zero in units of standard deviation
Distribution of means (for paired samples t-test)
all possible mean differences of a given sample size drawn from the null hypothesis population where there is zero average difference
T-distribution
a symmetrical and bell-shaped curve like a normal standard distribution but adjusted based on the degrees of freedom
Degrees of freedom
the number of independent values that are free to vary. for single sample t-tests its usually N-1 and for paired t-tests its N-2
Power
the probability of correctly rejecting the null hypothesis
Confidence intervals (CI)
a range of values that if randomly sampled repeatedly the mean difference would fall 95% of the time
Cohen’s d
the effect size in standard deviations between two means
Standard error (for independent samples t-test)
the variability in the sampling distribution of the difference between means
Distribution of differences between means
a distribution made up of the difference between means for two independent randomly drawn samples from the same population
F-distribution
the distribution of f-statistics under the null hypothesis
F-ratio
a statistic used in ANOVA that compares the variance between groups to the variance within groups
Within-groups variance
variability of scores within each sample around their group mean
Between-groups variance
variability of means between different groups compared to the grand mean
Alpha inflation
the increased risk of type 1 error when running multiple compounding statistical tests
Pairwise comparisons
evaluating the differences between the means of two groups at a time to determine if they are statistically significantly different from each other. This is often used after ANOVA to identify which specific groups differ.
R-squared
statistical measure that represents the proportion of variance for a dependent variable that's explained by an independent variable
MANOVA
extension of ANOVA that assesses whether there are any statistically significant differences between the means of multiple dependent variables across different groups defined by one or more independent variables.
Factorial ANOVA
statistical test used to evaluate the effects of two or more independent variables on a single dependent variable, as well as the interactions between those independent variables.
Repeated Measures ANOVA
a statistical technique used when the same subjects are measured multiple times under different conditions. It assesses whether there are significant differences in means across multiple measurements for the same subjects.
Hardy at BYU collected retrospective data on religiousness during 2020 among teens across the U.S. He then ran a paired samples t-test examining change from pre-COVID to spring/summer 2020. Here are the APA style results, t(1033) = -2.66, p = .008, d = -.08. What should he conclude from these results?
There was a significant but small decrease in religiousness from pre-COVID 2020 to spring/summer 2020.
If a paired samples t-test is statistically significant (p < .05), which of the following will also be true regarding the confidence interval?
It will not contain the mean of the null population, which is typically 0
Which of the following leads to a larger Cohen’s d effect size?
Larger difference between sample and population mean
What is the interpretation of a Cohen’s d of 2.00?
The alternative hypothesis population mean is two standard deviations above the null hypothesis population mean.
Which of the following is an accurate interpretation of p = .02 for a single sample t-test?
There is a 2% chance of getting that sample mean, with that sample size, from the null hypothesis population.
As sample size increases (say, from 50 to 100), which of the following is true regarding the t-critical for t-tests?
It gets smaller (i.e., decreases towards 1.96).
Which of the following yields more power in a single sample t-test or paired samples t-test?
The sample size is larger.
When you reject the null hypothesis in a paired samples t-test, how do you statistically interpret the results?
There is less than a 5% chance of getting your sample mean difference, with a sample of your size, from the null hypothesis population where there is no change.
When you retain the null hypothesis in a paired samples t-test, how do you statistically interpret the results?
There is greater than a 5% chance of getting your sample mean difference, with a sample of your size, from the null hypothesis population where there is no change.
When you reject the null hypothesis in a single sample t-test, how do you statistically interpret the results?
There is less than a 5% chance of getting your sample mean, with a sample of your size, from the null hypothesis population.
Which of the following is true regarding the relationship between t-scores and p-values?
They are inversely related (if one is larger, the other is smaller, and vice versa).
Suppose a researcher gets a result of t (99) = .50. Which of the following is a valid interpretation of these results?
Their sample mean is .50 standard deviations above the mean of the null hypothesis population.
Suppose a researcher gets a result of t (499) = -2.50. Which of the following is a valid interpretation of these results?
The distance between the sample mean and the mean of the null hypothesis population is 2.50 times larger than might be expected by chance, if the null hypothesis were true.
What is the standard error of the sampling distribution for a paired samples t-test?
It is the average distance sample means of change scores in the sampling distribution are from the mean of the null hypothesis population (which is typically zero).
What is the sampling distribution for the paired samples t-test made up of?
All possible means of change scores from samples of a given sample size, drawn from the null hypothesis population (where there is on average no change).
What is the standard error of the sampling distribution for a single sample t-test?
It is the average distance sample means in the sampling distribution are from the mean of the null hypothesis population.
What is the sampling distribution for the single sample t-test made up of?
All possible means from samples of a given sample size from the null hypothesis population.
Where does the mean of the null hypothesis population typically come from for a paired samples t-test for analyzing change?
It is assumed to be zero based on the null hypothesis that there is no change.
How do we alter the formula for the sample standard deviation to make it an unbiased estimate of the population standard deviation?
Divide by N-1 instead of N.
How do the t-test formulas compare to the z-test formulas?
The t-test formulas use SD in place of σ.
What is the underlying logic of the paired samples t-test?
We are trying to figure out the probability of getting our sample mean difference, with our sample size, from the null hypothesis population
What is the underlying logic of the single sample t-test?
We are trying to figure out the probability of getting our sample mean, with our sample size, from the null hypothesis population.
In what situations should you use a paired samples t-test instead of a single sample t-test?
When you want to study change across two time points.
In what situation should you use a single sample t-test instead of a single sample z-test?
When the population standard deviation is unknown.
Which of the following is a similarity between the single sample z-test and single sample t-test?
They both are for comparing your sample to a known population.
In a recent study we sought to compare teen boys and girls on self-control. We hypothesized that girls have higher self-control than boys, given all the research showing that they typically engage in more adaptive behaviors than boys. The descriptive statistics were as follows: boys (N = 172; M = 3.55); girls (N = 192, M = 3.70). The results were as follows, t(362) = -1.76, p = .079, d = -.18, 95% CI [-.31, .02]. (Example 1) What should we conclude?
There was a small gender difference in the expected direction, but it was not statistically significant.
In a recent study we sought to compare teen boys and girls on self-control. We hypothesized that girls have higher self-control than boys, given all the research showing that they typically engage in more adaptive behaviors than boys. The descriptive statistics were as follows: boys (N = 172; M = 3.55); girls (N = 192, M = 3.70). The results were as follows, t(362) = -1.76, p = .079, d = -.18, 95% CI [-.31, .02]. (Example 1) How much larger was our difference between means than we would have expected due to chance, given the null hypothesis?
1.76 times larger
In a recent study we sought to compare teen boys and girls on self-control. We hypothesized that girls have higher self-control than boys, given all the research showing that they typically engage in more adaptive behaviors than boys. The descriptive statistics were as follows: boys (N = 172; M = 3.55); girls (N = 192, M = 3.70). The results were as follows, t(362) = -1.76, p = .079, d = -.18, 95% CI [-.31, .02]. (Example 1) What is the chance of getting two samples of our sample size, with these two means, from the same population (i.e., if the null hypothesis were true)?
7.9%
In a recent study we sought to compare teen boys and girls on self-control. We hypothesized that girls have higher self-control than boys, given all the research showing that they typically engage in more adaptive behaviors than boys. The descriptive statistics were as follows: boys (N = 172; M = 3.55); girls (N = 192, M = 3.70). The results were as follows, t(362) = -1.76, p = .079, d = -.18, 95% CI [-.31, .02]. (Example 1) If the alternative hypothesis were true, and there really were two separate populations (boys and girls), how far apart would their means be?
-.18 standard deviations
How are 95% confidence intervals interpreted for independent samples t-tests? Answer this question based on the most accurate and true interpretation of 95% CIs.
With repeated sampling, 95% of the time the true difference between population means will lie within that interval.
How is effect size Cohen’s d interpreted for independent samples t-tests?
It is an estimate of the distance between the means of the two populations assuming the alternative hypothesis is true.
You and your best friend each do a study comparing men and women on how much they use the word “like” in conversation. Both of you agreed to only get 50 people of each gender. Surprisingly, both of you ended up with the same means for men and women, but you rejected your null and he didn’t. Based on the central limit theorem, what’s likely going on?
Your samples had less variability, meaning your estimate of the population variance was smaller, giving you less sampling error.
Which of the following yields more power for an independent sample t-test?
A larger difference between means.
When you reject the null hypothesis in an independent samples t-test, how do you statistically interpret the results?
There is less than a 5% chance of getting your size of difference between means, with your two sample sizes, if the null hypothesis were true (i.e., your means came from the same population).
When you retain the null hypothesis in an independent samples t-test, how do you statistically interpret the results?
There is greater than a 5% chance of getting your size of difference between means, with your two sample sizes, if the null hypothesis were true (i.e., your means came from the same population).
Suppose a researcher gets a result of t = 1.25. Which of the following is a valid interpretation of these results?
The size of their difference between means is about one and a quarter times larger than they might expect due to chance, if the null hypothesis were correct.
Which of the following is a valid interpretation of t-scores in an independent samples t-test?
They tell you how many standard deviations your difference between means is from the null population mean.
What do the top and bottom of the t-test formula for the independent samples t-test represent?
The difference between means you got in your data over the difference between means you might expect to get if the null hypothesis were true.
What is the standard error of the sampling distribution for an independent samples t-test?
It is the average distance our differences between means are from zero.
What is the sampling distribution for the independent samples t-test made up of?
All possible differences between means from two samples, of two given sample sizes, drawn from the same population.
Which of the following is typically true for the mean of the sampling distribution for an independent samples t-test?
It is assumed to be zero because if the null hypothesis is true, on average there will be no difference between two samples from the same population.
What does the typical alternative hypothesis look like for an independent samples t-test?
One group is lower/higher than the other group.
What does the typical null hypothesis look like for an independent samples t-test?
The groups are not different.
What is the underlying logic of the independent samples t-test?
We are trying to figure out the probability of getting our two samples, of our sample sizes, if the null is true (i.e., they came from the same population).
Which of the following possible studies of relationship satisfaction among newlyweds is most likely to involve an independent t-test?
Researchers compared relationship satisfaction between newlyweds who took a relationship education course and those who did not take the course.
What is the unit of analysis for independent samples t-tests?
Differences between means
What kinds of research questions are independent samples t-test used to answer?
Research questions that involve comparing two groups.
What kind(s) of variable(s) is/are needed to run an independent samples t-test?
A nominal variable and an ordinal or ratio/interval variable.
What is the structure of the data for an independent samples t-test?
2 groups of people at 1 occasion
Which of the following is in common between single sample, paired samples, and independent samples t-tests?
They all involve analysis of means.
We hypothesized that ethnic identity would vary across ethnicity—that is, not all ethnic groups are equal in terms of ethnic identity. We used the MUSIC dataset, which is a sample of college students from 30 different universities. We used the Multigroup Ethnic Identity Measure (MEIM; Phinney, 1992). Specifically, we averaged scores on the seven items capturing affirmation, belonging, and commitment. Here are the means: African American (M = 4.18), European American (M = 3.76), Asian American (M = 3.82), Hispanic (M = 3.94). We then ran an ANOVA, and got the following results, F(3, 8916) = 56.27, p < .0001. (example 1) What do we conclude is going on at the population level based on these results?
It is unlikely that all four of our samples are from the same population.
We hypothesized that ethnic identity would vary across ethnicity—that is, not all ethnic groups are equal in terms of ethnic identity. We used the MUSIC dataset, which is a sample of college students from 30 different universities. We used the Multigroup Ethnic Identity Measure (MEIM; Phinney, 1992). Specifically, we averaged scores on the seven items capturing affirmation, belonging, and commitment. Here are the means: African American (M = 4.18), European American (M = 3.76), Asian American (M = 3.82), Hispanic (M = 3.94). We then ran an ANOVA, and got the following results, F(3, 8916) = 56.27, p < .0001. (Example 1) What’s the chance of getting the amount of variance among sample means that we got, with our sample sizes, if drawing them from the same population?
<1/10%
We hypothesized that ethnic identity would vary across ethnicity—that is, not all ethnic groups are equal in terms of ethnic identity. We used the MUSIC dataset, which is a sample of college students from 30 different universities. We used the Multigroup Ethnic Identity Measure (MEIM; Phinney, 1992). Specifically, we averaged scores on the seven items capturing affirmation, belonging, and commitment. Here are the means: African American (M = 4.18), European American (M = 3.76), Asian American (M = 3.82), Hispanic (M = 3.94). We then ran an ANOVA, and got the following results, F(3, 8916) = 56.27, p < .0001. (Example 1) Which of the following is a correct interpretation of the F-ratio?
Our group means varied 56.27 times more than we would we would expect them to due to chance, given the null hypothesis.
We hypothesized that ethnic identity would vary across ethnicity—that is, not all ethnic groups are equal in terms of ethnic identity. We used the MUSIC dataset, which is a sample of college students from 30 different universities. We used the Multigroup Ethnic Identity Measure (MEIM; Phinney, 1992). Specifically, we averaged scores on the seven items capturing affirmation, belonging, and commitment. Here are the means: African American (M = 4.18), European American (M = 3.76), Asian American (M = 3.82), Hispanic (M = 3.94). We then ran an ANOVA, and got the following results, F(3, 8916) = 56.27, p < .0001. (Example 1) Which of the following is the most appropriate interpretation of these results?
Ethnic identity varied significantly across ethnicity.
We hypothesized that ethnic identity would vary across ethnicity—that is, not all ethnic groups are equal in terms of ethnic identity. We used the MUSIC dataset, which is a sample of college students from 30 different universities. We used the Multigroup Ethnic Identity Measure (MEIM; Phinney, 1992). Specifically, we averaged scores on the seven items capturing affirmation, belonging, and commitment. Here are the means: African American (M = 4.18), European American (M = 3.76), Asian American (M = 3.82), Hispanic (M = 3.94). We then ran an ANOVA, and got the following results, F(3, 8916) = 56.27, p < .0001. (Example 1) What’s the total sample size (N)?
8920
If a researcher gets an F=4.00, with F-critical of 3.86, which of the following is an accurate interpretation?
The group means vary four times more than you would expect them to vary by chance if the null hypothesis is correct.
How do you interpret retaining the null in an ANOVA?
There is greater than a 5% chance of getting an F-ratio as large as yours if the null hypothesis is true and your groups all came from the same population.
How do you interpret rejecting the null in an ANOVA?
There is less than a 5% chance of getting an F-ratio as large as yours if the null hypothesis is true and your groups all came from the same population.
Which of the following is the correct formula for F?
F= SD²BG/SD²WG
What is this formula: ∑(Mgroups−GM)²/kgroups−1
BG variance
Which formula captures variability of scores around group means?
∑(X - Mgroups)²
Which formula captures variability of group means around the grand mean?
∑(Mgroups−GM)²
What does the F-distribution look like?
A one-tailed test, skewed to the right, starting with 0 and with the mode being 1.
What is the sampling distribution in ANOVA made up of?
All possible F-ratios you could get, with your number of groups and your sample sizes, if drawing your samples from same population.
What is the general logic of the F-ratio?
How much our group means vary / how much we expect our group means to vary by chance given the null hypothesis that they are all from one population.
Which number tells us how much we expect our means to vary by chance, if the null is true and they all come from the same population?
Within-groups variance
In ANOVAs, which number tells us how much our means vary?
Between-groups variance
What is the logic of ANOVA?
We are trying to figure out the likelihood of getting means that vary as much as ours do (with samples of our sample sizes), if drawing them all from the same population.
If you have more than two groups in your data, why is it typically recommended that you do a single ANOVA rather than multiple independent samples t-tests?
If you do multiple tests, your chance of Type I error will be more than 5%.
What does the typical alternative hypothesis look like in ANOVA?
The outcome varies across your groups.
Suppose a researcher wanted to study math skills. Which of the following sounds like a null hypothesis for ANOVA?
Math scores will not vary significantly across ethnicity.
What is the unit of analysis for ANOVAs?
Variance
What kind of data are needed for one-way ANOVAs?
A nominal group variable (or IV) and an ordinal/ratio outcome variable (or DV).
What types of research questions do one-way ANOVAs address?
Questions about how two or more groups vary on some ordinal/ratio outcome.
Which of the following is a true similarity or difference between independent samples t-tests and ANOVA?
Independent samples t-tests are confined to two groups, whereas ANOVAs can compare two or more groups.

(Example 1) What percent of variance in ethnic identity is explained by ethnicity?
1.9%

(Example 1) How would you interpret the effect size R-squared?
Small

What do you conclude based on these results?
Ethnic identity varies significantly across ethnicity, but only a little.
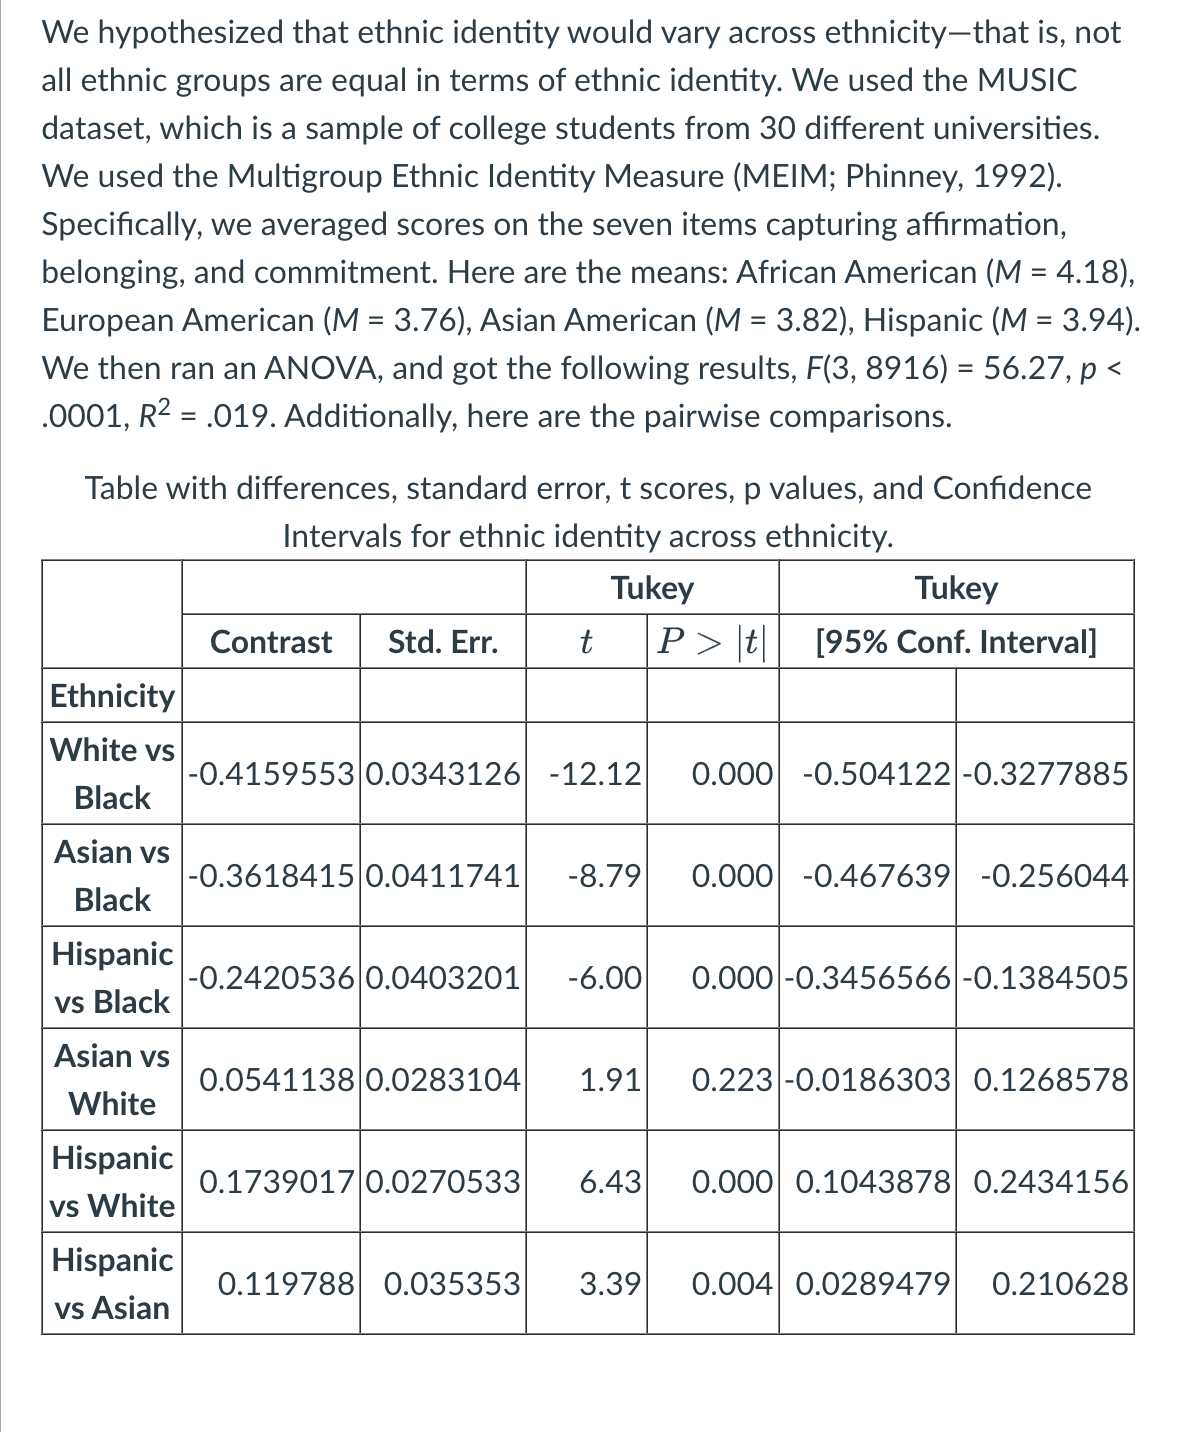
Which of the following pairwise comparisons was not statistically significant?
Asian vs. White

Which of the following is the correct interpretation of the pairwise comparisons (= means that the groups are not statistically significantly different; < or > mean that the groups are statistically significantly different)?
Black>Hispanic>Asian=White