MMW - STATISTICS
1/47
There's no tags or description
Looks like no tags are added yet.
Name | Mastery | Learn | Test | Matching | Spaced | Call with Kai |
|---|
No analytics yet
Send a link to your students to track their progress
48 Terms
Methods of data collection
Census
Sample Survey
Experiment
Observation study
Sampling Methods
Nonprobability sampling
Probability Sampling
is any sampling method where some elements of the population have no chance of selection or where the probability of selection can't be accurately determined.
Nonprobability sampling
- relies on dividing the target population into strata (subpopulations) of equal size and then selecting randomly one element from the first stratum and corresponding elements from all other strata.
systematic sampling
an extraneous variable in a statistical model that correlates (positively or negatively) with both the dependent variable and the independent variable.
Confounding variable
- are for studying the effects of one primary factor without the need to take other nuisance variables into account.
- The experiment compares the values of a response variable (like health improvement) based on the different levels of that primary factor (e.g., different amounts of medication). For completely randomized designs, the levels of the primary factor are randomly assigned to the experimental units (for example, using a random number generator).
Completely randomized designs
- is a collection of completely randomized experiments, each run within one of the blocks of the total experiment.
- A matched pairs of design is its special case when the blocks consist of just two (2) elements (measurements on the same patient before and after the treatment or measurements on two (2) different but in some way similar patients).
Randomized block design
used to determine whether there is significant difference between the expected value frequencies and the observed frequencies in one or more categories.
chi-square test
two (2) types of chi-square tests
goodness of fit test
test of independence
- A chi-square test that compares two (2) variables in a contingency table to see if they are related. It tests to see whether the distributions of categorical variables differ from each other.
- is used to assess if two (2) factors are related. This test is often used in social science research to determine if factors are independent of each other.
test of independence
A very small chi-square test statistic means that your observed data fits your expected data well. In other words?
there is a relationship
raw information or facts that become useful information when organized in a meaningful way. It could be of qualitative and quantitative nature.
Data
concerned with "looking after" and processing data
Data Management
this is the procedure of systematically acquiring and recording information about all members of a given population.
Census
is a selection of a subset within a population, to yield some knowledge about the population of concern.
sample survey
sampling
this is performed when there are some controlled variables (like certain treatment in medicine) and the intention is to study their effect on other observed variables (like health of patients).
Experiment
this is appropriate when there are no controlled variables and replication is impossible. This type of study typically uses a survey.
Observation study
it is possible to both determine which sampling units belong to which sample and the probability that each sample will be selected.
Probability Sampling
types of non-probability sampling except purposive and snowball
convenience sampling
quota sampling
types of probability sampling
simple random sampling
systematic sampling
stratified sampling
cluster sampling
matched random sampling
- all samples of a given size have an equal probability of being selected and selections are independent.
- The frame is not subdivided or partitioned.
- The sample variance is a good indicator of the population variance, which makes it relatively easy to estimate the accuracy of results.
simple random sampling
- when the population embraces a number of distinct categories, the frame can be organized by these categories into separate "strata".
- Each stratum is then sampled as an independent sub-population.
stratified sampling
- sometimes it is cheaper to '______' the sample in some way
- is an example of two-stage random sampling: in the first stage a random sample of areas is chosen; in the second stage a random sample of respondents within those areas is selected.
- works best when each _____ is a small copy of the population.
cluster sampling
- in this method, there are two (2) samples in which the members are clearly paired, or are matched explicitly by the researcher (for example, IQ measurements or pairs of identical twins).
- Alternatively, the same attribute, or variable, may be measured twice on each subject, under different circumstances
matched random sampling
- To be able to compare effects and make inference about associations or predictions, one typically has to subject different groups to different conditions.
- Usually, an experimental unit is subjected to treatment and a control group is not.
Control groups and experimental units
- The second fundamental design principle is randomization of allocation of (controlled variables) treatments to units.
- The treatment effects, if present, will be similar within each group.
Random Assignments
- All measurements, observations or data collected are subject to variation, as there are no completely deterministic processes.
- To reduce variability, in the experiment the measurements must be repeated.
Replication
an imitation pill identical to the actual treatment pill, but without the treatment ingredients
placebo pill
a sham (or simulated) effect when medical intervention has no direct health impact but results in actual improvement of a medical condition because the patients knew they were treated.
placebo effect
a technique used to make the subjects "blind" to which treatment is being given.
Blinding
- the arranging of experimental units in groups (blocks) that are similar to one another.
blocking
a source of variability that is not of primary interest to the experimenter.
blocking factor
- a chi square test that determines if a sample data matches a population.
- is used to test whether a frequency distribution obtained experimentally fits an "expected" frequency distribution that is based on the theoretical or previously known probability of each outcome.
goodness of fit test
A very large chi-square test statistic means that the data does not fit very well. In other words?
there is no relationship
standard assumptions of the Chi-Square Test
Random sample
Independent observations for the sample
No expected counts less than five (5)
what is this symbol?
Chi Square Test Statistic
what is this symbol?
observed frequency value
what is this symbol?
expected frequency value
test statistic fomula
x²=SUM(O-E)²/E
Goodness of Fit Test:
Degrees of freedom fomula
K-1
Reject 𝐻0 if 𝜒2 is______ than the critical value (right tailed test)
larger
There is no association between the two (2) categorical variables
null hypothesis
There is an association (the two (2) variables are not independent)
alternative hypothesis
the two (2) variables are independent.
null hypothesis
the two (2) variables are not independent (they are dependent).
alternative hypothesis
Test for Independence Test: degrees of freedom formula
(rows-1)*(columns-1)

Goodness of Fit: Expected frequency formula
(percentage*sample size)
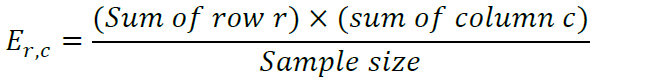
Test for Independence: Expected Frequency Formula
E r,c = (sum of row)*(sum of column)/sample size