Sampling Distribution Models
1/15
There's no tags or description
Looks like no tags are added yet.
Name | Mastery | Learn | Test | Matching | Spaced |
|---|
No study sessions yet.
16 Terms
The Central Limit Theorem for Sample Proportions
The sampling distribution model of the sample proportion from a random sample is approximately NORMAL for a large ‘n’
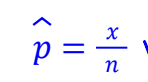
p-hat formula
p-hat = x/n where x is the number of individuals with the characteristic and n is the total number in the sample
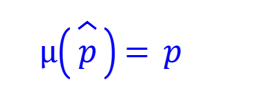
center of sampling distribution model for proportions
μ(p-hat)= p (the center of the sampling distribution of sample proportions is the true/ population proportion)
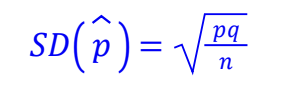
Standard Deviation of Sampling Distribution Model for proportions
SD(p-hat)= square root of (pq)/n
Assumptions and Conditions for Sampling Distribution Model for proportions
Independence Assumption
Sample Size Assumption
Randomization Condition
10% Condition
Success/Failure Condition
Independence Assumption
Sample values are independent
Sample Size Assumption
Samples must be “large enough”
Randomization Condition
It must come from a SRS or be results from an experiment with random assignment (not biased)
10% Condition
Must be no larger than 10% of the population
Success/Failure Condition
np ≥ 10 and nq ≥ 10
The Central Limit Theorem for Sample Means
The sampling distribution of any mean becomes more nearly Normal as the sample size grows. This is true regardless of the shape of the population distribution.
*The mean of a random sample is a random variable whose sampling distribution can be approximated with the Normal model. The larger the sample, the better the approximation will be.
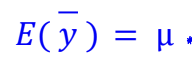
Formula for center of Sample Distribution model for means
E(y-bar)= u
*population mean is not used
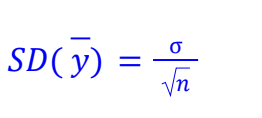
Formula for Standard Deviation of Sample Distribution model for means
SD(y-bar) = Standard Deviation of population divided by number of individuals in sample
Assumptions and Conditions for Sample Distribution model for means
Independence Assumption
Sample Size Assumption
Randomization Condition
10% Condition
Large Enough Sample Size Condition
Large Enough Sample Size Condition
It depends on whether or not the population distribution is unimodal and symmetric. Usually we say above 30 is a good enough sample size to allow for us to use a Normal Model for the Sample Distribution model for means
What can go wrong?
Dont confuse sampling distribution of a statistic with distribution of a sample (sample data could be highly skewed but sampling distribution can be normal)
Larger sample = more sampling distribution of proportions/means look like population
Beware of observations that are not independent
Can’t use CLT for small skewed samples