IB Ecology
1/101
There's no tags or description
Looks like no tags are added yet.
Name | Mastery | Learn | Test | Matching | Spaced |
|---|
No study sessions yet.
102 Terms
Ecology
Study of the interations between organisms and their enviroment
Levels of Ecology
Biosphere, Ecosystem, Community, Population, Species, Organism, Organ system, Organ, Tissue, Cell, Organelle, Molecules, Atoms, Physics, Math
Biotic
living parts of an ecosystem
abiotic
physical/nonliving parts of an ecosystem
Factors of ecology
Climate
patterns and averages in temp over MANY years
more predicatable
Weather
short, hard to determine changes
Greenhouse gas effect
C02 and other gases in the atmosphere trap heat, keeping the earth warm
What causes ocean currents?
latitude (rotation) and heat transport in the biosphere
How does latitude cause ocean currents
It determines how sunlight is distributed
3 latitude zones
Sunlight Zone, Twilight Zone, Midnight Zone
How does heat transport in the biosphere cause ocean currents
It influences the distribution of heat and climates, affecting zones
Winds and currents are also caused by..
El Nino, ENSO
Effect on bodies of water?
Moderate temp
What shapes regional climate?
Heat transfers (wind/air) and geography (mountains, large bodies of water/land)
How is regional climate graphed
With the city name, mm prep, month, temp
What are climate diagrams like
standardized and prective
Biome
large region of the Earth that has a specific climate and certain types of plants and animals (deserts for example)
More liquid precip on a climate diagram graph is..
more plants
More plant diversity on a climate diagram graph is…
more animal diversity
Energy source for most ecosystems (producers)
Sun
What is another energy source for ecosystems
chemoautotrophic bacteria
Chemical energy in carbon compounds flow through what
food chains by feeding
Trophic level
position a species has in a food chain
Producer
Produces its own food w sun, eaten by primary consumer
Primary consumer
First, eats producer, eaten by secondary consumer
Secondary consumer
Second, eats primary consumer and is eaten by tertiary consumer
Tertiary consumer
Third, eats secondary consumer and is eaten by quaternary consumer
Quaternary consumer
last, eats tertiary consumer
How much percent of energy is kept
10
How is chemical energy released
by cellular respiration
What do organisms use chemical energy for
metabolic activities
biomass increase
What is chemical energy lost as
heat and waste
Energy loss between trophic levels
limits food chain length & biomass at higher tropic levels (tertiary quaternary)
Biomass pyramid
shows the relative amounts of living organic matter (biomass) at each trophic level in an ecosystem
Energy pyramid
shows the amount of energy available at each trophic level in a food chain
How to calculate energy transferred
10% rule
Decomposers
organisms that break down dead matter and recycle nutrients
Autotrophs
organisms (prod) that can make its own food using energy from sunlight (photosynthesis).
Heterotroph
an organism (consumer) that cannot make its own food and instead obtains nutrients and energy by consuming other organisms
Food chain
shows how energy and nutrients are transferred from one organism to another in an ecosystem. It illustrates the flow of energy.
Food web
multiple interconnected chains, showing the interactions between different species/ trophic levels within an ecosystem
Primary Productivity
conversion to chemical energy by producers
NPP
Net Primary Productivity
Population density formula
total pop/total land area
How does matter flow through ecosystems
by interaction w organisms using matter for energy/growth and is recycled
Processes that recycle matter
Biological, Geological, Phys & Chem, Human
What matter recycling processes can scientists measure
Bio, geo, and phys & chem
What matter recycling process causes change
Human
Biological process is by..
photosynthesis, eating, cell resp, etc
Geological process is by….
volcanoes, rock formation and breakdown
Phys & Chem process is caused by..
clouds and precip, lighting, erosion, etc
Human process is caused by..
fossil fuels, land clearing, cutting & burning wood, fertilizers
4 things that affect population growth rates
Birth rate, death rate, immigration, emigration
Immigration
movement of individuals into a population from another area
Emigration
movement of individuals out of a population to another area
Bioaccumulation
increasing concentration in one organism
Biomagnification
increasign conc as it goes up
Carrying capicity
maximum population size of a species that an ecosystem can sustainably support over the long term
When is carrying capicity reached
when the population size of a species matches the maximum number of individuals that the ecosystem can support
birth = death
3 characteristics of pop
geographical distribution, density, dispersion
density
number per area
dispersion
clumped/uniform
how do you calculate population growth rate
growth rate (pop size/time) = a -b + c - d
what is A in growth rate formula
natality
what is B in growth rate formula
mortality
what is C in growth rate formula
immigration
what is D in growth rate formula
emigration
what controls population growth?
density dependent/independent
Density dependent
consists of competition, predation, parasitism, disease
Density independent
consisits of pollution, humans, weather, fire
What is another way to study population growth
Life tables
Life tables
Summary of the survival pattern of a population
Follows fate of cohort
Used to make a survivalship curve
Growth rate formula
Change in pop size/time
Logistic growth curve
J curve
J curve attributes
Cannot be sustained
Pop size levels off
Enviro resistance/death rate increases
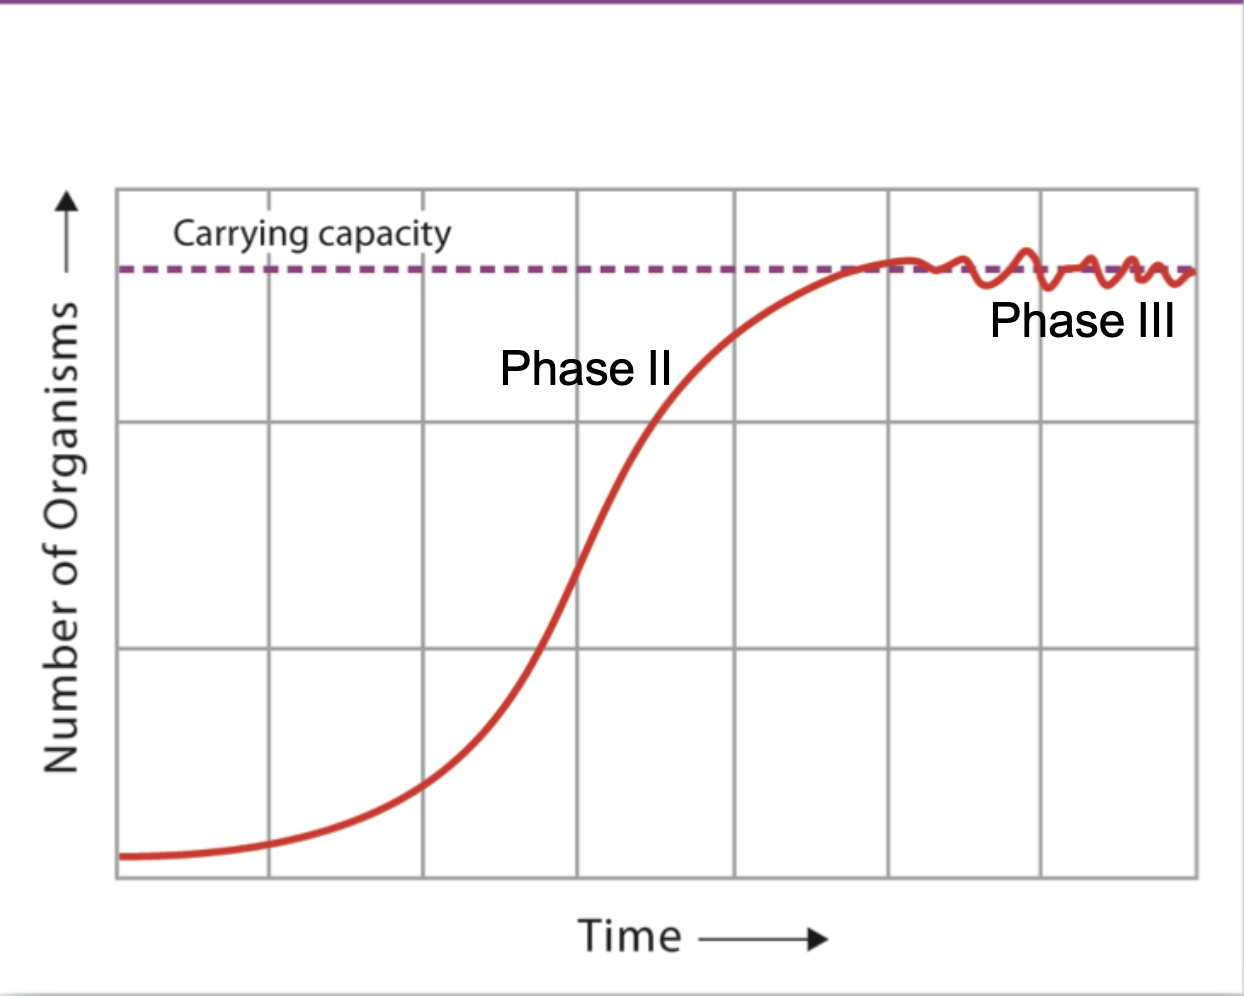
What graph is this
Logistic growth
K selection/density dependent selection
low repro, high surviving
strong competitiors
R selection/density independent selection
low surviving
selects for traits that maximize repro
Ecological footprint
Summarizes the aggregate (sum) land+water area needed to sustain the people of a nation
What does the ecological footprint measure
how close we are to the carrying capicity of earth
Ecosystem services examples
provisioning (food,water), regulating (pollination, water purification), supporting (soil formation), cultural (national parks, sites)
What substances create Greenhouse effect
Methane, Nitrious Oxide, Carbon Dixoide
Biodiversity
the range of all living things and their interactions in an environment.
What is climate change doing to the ocean and ice
Oceans are rising, ice melting and more warm water
Recent increases in C02 are caused by..
increase in combustion of fossil fuels
Energy being trapped in the atmosphere corresponds to the wavelengths of..
energy
When did C02 start to rise
In the Industrial Revolution
Impact of the GH gases depends on..
Ability to absorb long wave radiation
conc in the ATM
Global temps and gases are influenced by..
conc of GH gases
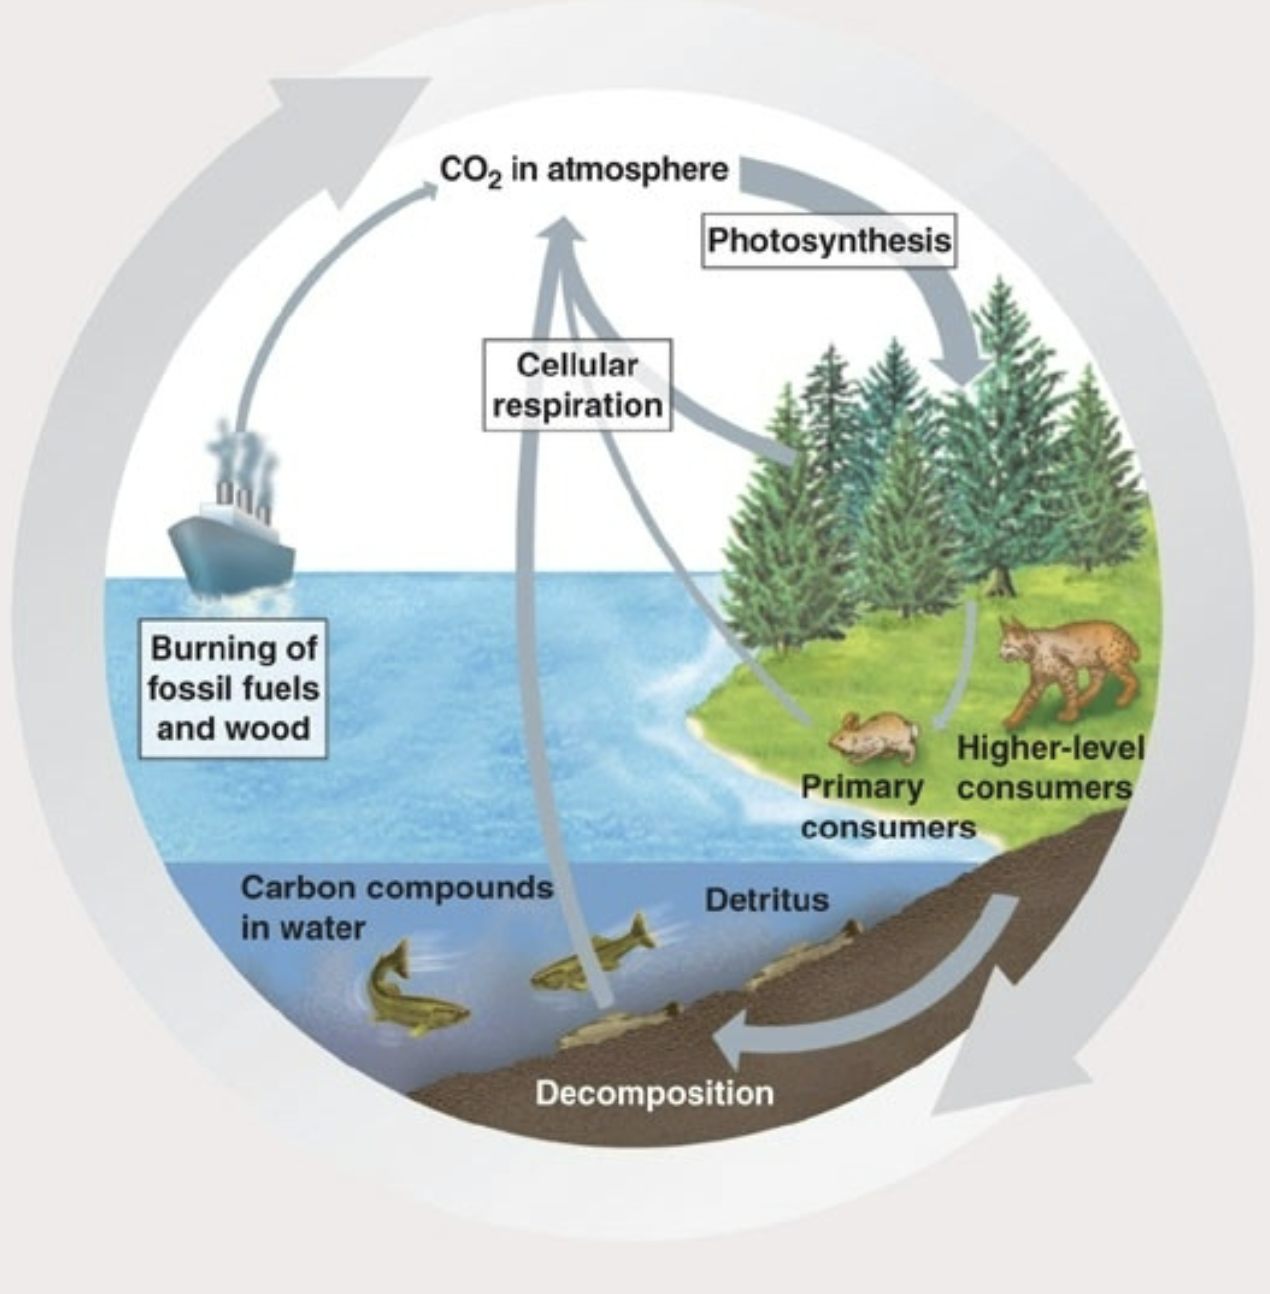
What graph is this
Carbon cycle
Keystone species
a species that has a very large impact on its environment.
What graph shape is exponential
J curve
What graph shape is logistical
S curve
Abiotic factors that influence climate
Temp, sunlight, moisture
Biotic factors that influence climate
animals, vegetation
Differences in ecological footprint per country
Developed = higher
Developing = Lower