Econ III (Macroeconomics)
1/94
Earn XP
Description and Tags
Acadeca 2025-26
Name | Mastery | Learn | Test | Matching | Spaced |
|---|
No study sessions yet.
95 Terms
Macroeconomics studies…[p.62]
…the performance of national economies
What determines the long-run growth in the size of economies? (+ standard of living provided for their participants; price level)
What are the causes & consequences of short-run fluctuations in the level of economic activity, unemployment, and inflation?
Types of aggregate economic indicators [p.62]
Gross Domestic Product (GDP), the cost of living, and the unemployment rate
used to describe the performance of the aggregate (total) economy
Real GDP (Gross Domestic Product) [p.62]
measure of the total quantity of goods & services produced in the economy, adjusted to remove the effects of inflation
U.S. long-run history of growth [p.62]
since 1900, the total real output of the U.S. economy has increased by nearly 40x.
decline btwn 1929-1933 (Great Depression)
expansion btwn 1941-1945 (WWII)
[Figure 30]
![<p>since 1900, the total real output of the U.S. economy has increased by nearly 40x. </p><ul><li><p>decline btwn 1929-1933 (Great Depression)</p></li><li><p>expansion btwn 1941-1945 (WWII)</p></li></ul><p>[Figure 30]</p>](https://knowt-user-attachments.s3.amazonaws.com/7123d83f-6f2e-464e-b597-c6a43cd66ea7.png)
U.S. historical population growth [p.63]
since 1900, the U.S. population has increased by over 4x.
Per Capita [p.63]
Latin for “per head;” used to denote averages calculated for an entire population
U.S. real output per capita [p.63-64]
since 1900, average output per capita has increased by a factor of 9
provides an indication of what the typical person can consume
2019: >$65,000
[Figure 31 - blue line]
![<p>since 1900, average output per capita has increased by a factor of 9</p><ul><li><p>provides an indication of what the typical person can consume</p></li><li><p>2019: >$65,000</p></li></ul><p>[Figure 31 - blue line]</p>](https://knowt-user-attachments.s3.amazonaws.com/58959bf9-4894-4a03-af90-fc225c5fca66.png)
Average Labor Productivity [p.63]
economy’s total output divided by the total # of workers employed
measure of how much the typical worker can produce
[Figure 31 - orange line]
![<p>economy’s total output divided by the total # of workers employed</p><ul><li><p>measure of how much the typical worker can produce</p></li></ul><p>[Figure 31 - orange line]</p>](https://knowt-user-attachments.s3.amazonaws.com/1a8c14e1-1d1f-4539-a76e-872a8e221e21.png)
Other countries’ output per capita in 2019 [p.63-64]
In comparison to U.S: >$65,000
China: 2/3 GDP and 15% output
Lowest levels of production
(South Asia) India: 13.4% GDP and 3.2% output; Pakistan: 1.3% GDP and 2% output
(Africa) Egypt: 1.4% GDP and 4.6% output; Nigeria: 2.1% GDP and 3.4% output; Ghana: 0.3% GDP and 3.4% output
[Figure 32]
![<p>In comparison to U.S: >$65,000</p><ul><li><p>China: 2/3 GDP and 15% output</p></li></ul><p>Lowest levels of production</p><ul><li><p><strong>(South Asia)</strong> India: 13.4% GDP and 3.2% output; Pakistan: 1.3% GDP and 2% output</p></li><li><p><strong>(Africa)</strong> Egypt: 1.4% GDP and 4.6% output; Nigeria: 2.1% GDP and 3.4% output; Ghana: 0.3% GDP and 3.4% output</p></li></ul><p>[Figure 32]</p>](https://knowt-user-attachments.s3.amazonaws.com/2a7fbbbb-3a3f-4c1a-8562-8c5944e00ff6.png)
Living Standards [p.64]
poorest citizens of developed countries can still access material goods far exceeding the consumption possibilities of the typical resident of developing countries (with low economic growth)
Quality of Life: material resources created by higher levels of production make possible longer life, broader access to education, better healthcare, and a cleaner environment
[Figure 33]
![<ul><li><p>poorest citizens of developed countries can still access material goods far exceeding the consumption possibilities of the typical resident of developing countries (with low economic growth)</p></li><li><p><strong>Quality of Life</strong>: material resources created by higher levels of production make possible longer life, broader access to education, better healthcare, and a cleaner environment</p></li></ul><p>[Figure 33]</p>](https://knowt-user-attachments.s3.amazonaws.com/78ad5782-f760-4b06-a587-42f427576a81.png)
Expansion [p.65]
a period btwn a trough and a peak in economic activity
Recession [p.65]
a period btwn a peak and a trough in economic activity
2008 financial crisis
Depression [p.65]
when a recession is particularly severe
Great Depression (1929-1933)
Business Cycle [p.65]
the alternation of periods of expansion and recession
these fluctuations are one of the fundamental features of the economy that macroecon seeks to explain
+ finding ways to reduce the severity & duration of recession periods (associated w/ declining employment opportunities & slower wage growth)
Labor Force [p.65]
ALL individuals (working-age adults) either employed or unemployed (looking for a job)
Unemployment rate [p.65]
Percentage of the labor force that would like to work but cannot find employment
100 x (unemployed / labor force)
INC during recessions (GD), DEC during expansions
never zero! people are always searching for work (continual entry of new job-seekers and shifting fortunes of different industries)
since 1900, no indication that the rate is increasing in the long term - despite huge economic changes
High unemployment rate [p.65]
during this time it’s hard to find work and employed ppl generally find it harder to earn promotions or increase their pay
Inflation [p.66]
when all prices (of individual goods) rise together / all the things people consume are becoming more expensive
reduces purchasing power, makes consumers worse off + other economic costs
macro policy: keep inflation low
since 1900, rate varies considerably over time with notable price drop during GD & 2008 financial crisis
How size affects dependence on trade [p.66]
U.S. is large and relatively less dependent on trade than other smaller countries
international trade has generally increased since the 1950s
U.S: level of export/imports as a share of GDP has fallen over the past few years
Trade Surplus [p.67]
when exports exceed imports
Trade Deficit [p.67]
when imports exceed exports
Levels of U.S. imports vs exports [p.67]
up until late 1950s: exports > imports (trade surplus)
since 1970s: imports > exports (trade deficit)
trade deficit allows us to focus on exporting goods and services we have a comparative advantage in producing
+ able to trade for things that other countries can produce using less expensive resources
Aggregation [p.67]
combination of many different things into a single economic variable
Gross Domestic Product (GDP) [p.68]
the market value of all final goods and services produced within a country during a specified period of time
domestic: counts only good produced within the borders of that country, whether by the domestic or foreign manufacturer [p.71]
(formal definition)
Higher priced goods contribute more to total GDP [p.68-69]
goods that have higher prices have a higher value to consumers and therefore more to total output
(market prices reflect the value the marginal consumer places on the good)
Intermediate Goods
goods that are used up in the production of a final good
excluded from GDP to ensure GDP is not affected by the extent of vertical integration in the economy (regardless of the pattern of industry ownership)
If goods are either final or intermediate… [p.70]
…we only count that portion of production that is sold to final users.
Capital Goods [p.70]
long-lived goods that are themselves produced and are used to produce other goods/services but aren’t used up in production
EX: machinery, factory buildings
included in GDP in the year they are produced
GDP is during a specified period [p.71]
annual or quarterly (three month periods); and counts do not carry over to the next year
the conceptual basis for the measurement of GDP was developed in the…[p.71]
1930’s
one of the earliest known efforts to measure national output [p.71]
Sir William Petty - mid 1600s: part of the British govt’s effort to assess the ability of the Irish people to pay taxes to the crown
1930’s GDP Invention [p.71]
The lack of comprehensive data on national economic activity was hampering efforts to respond to the Great Depression
1932: U.S. Dept of Commerce commissions economist Simon Kuznets to develop a system to measure national output
1934: Kuznets presents his system in a report to the U.S. Senate
U.S. entry to WWII provides additional impetus for perfecting techniques of measuring output and establishing the necessary data collection tools to produce ongoing estimates of GDP
1971: Kuznets receives Nobel Prize in Economic Science for his contributions
Important Limitations of GDP [p.71]
Not always easy to determine what constitutes final goods and services (EX: treatment of expenditures on national defense = “intermediate good?”)
Non-market production: exclusion of goods that aren’t bought and sold in markets (EX: unpaid household work, when women entered the labor force the GDP rose w/o actual change in total production OR underground economy/illegal black market)
Ignores activities that may increase our GDP but don’t make us better off (EX: natural disasters, crime). Also doesn’t account for production that may deplete a country’s stock of natural resources/pollutes the environment
4 Categories of Purchasers [p.72]
households, firms, govt, foreign sector (foreign purchasers of domestic products)
Household purchases / Consumption expenditures [p.72]
Includes…
Consumer Durables: long lived consumer goods (EX: automobiles, washing machines, furniture), involve planning for the purchase and are sensitive to changes in interest rates for purchases via credit
Consumer Non-durables: goods that are used up more quickly than durable goods (EX: food, clothing)
Services: intangible goods (EX: education, legal services, insurance, financial services)
Investment [p.72]
comprised of spending by firms on final goods/services + household purchases of new houses; includes…
Business Fixed / Capital Investment: business purchases of factories, offices, machinery, equipment
Residential Fixed Investment: purchase of new homes + apartment buildings
Inventories: additions of unsold goods to company inventories
Economic Definition: the purchase of new capital goods (EX: buildings, equipment)
often involves borrowing from banks (large purchases) → sensitive to interest rates
firms prefer lower interest rates on business loans to invest in capital
Government Purchases [p.72]
all of the goods/services purchased by federal, state, and local govts; includes…
wages paid to firefighters, teachers, purchases of fighter planes for the military
Transfer payments (and interest paid on govt debt) are NOT counted as purchases
EX: paying Social Security benefits
Net Exports [p.73]
value of domestically produced goods sold to foreigners (exports) / value of foreign-produced goods purchased by domestic buyers (imports)
(+) trade surplus (exports > imports)
(-) trade deficit (imports > exports)
Equation for GDP and various categories of spending [p.73]
GDP = C + I + G + NX
C = consumption
I = investment
G = govt spending
NX = net exports
Identity used by economists to discuss GDP
Income Equals Production Equals Expenditures
GDP can be thought of as income (whenever a good/service is sold, the revenue is distributed btwn the workers and the owners of the capital used to produce it)
combined income of labor + capital = expenditures, = production
Base Year [p.73]
the year that prices are taken to value production (used to construct real GDP)
Nominal GDP [p.73]
GDP calculated w/ current year prices
Consumer Price Index (CPI) [p.73-74]
measures the cost of purchasing a market basket of goods + services intended to be representative of the consumption of a typical consumer
calculated by the U.S. Bureau of Labor Statistics to measure inflation
adjusts Social Security benefit payments, cost-of-living provisions → wages
Consumer Expenditure Survey (diverse responses are aggregated)
each month BLS employees check actual price information (stores, websites, including discounts)
this data + quantities in “market basket” = cost of purchasing bundle
cost expressed as index # relative to cost of base year bundle
CPI Formula [p.74]
CPI in year t = 100 * (cost of bundle in year t) / (cost of bundle in base year)
Inflation Rate Formula [p.74]
100 * (CPI year 2 - CPI year 1) / (CPI year 1)
(yearly rate of change in CPI)
factors causing CPI upward bias [p.75]
Substitution Bias: as relative prices change, households shift towards cheaper goods/services
Unmeasured Quality Change: technological improvement
New Goods & Services
Amount of CPI overstatement (Boskin 1996) [p.75]
In 1996, the Boskin Commission (economist: Michael Boskin) found CPI overstated the rate of price inflation by 1.3 percent per year
GDP Deflator Equation [p.75]
GDP Deflator = 100 x (Nominal GDP) / (Real GDP)
(relationship btwn real and nominal GDP)
CPI vs GDP Deflator [p.75]
GDP Deflator reflects only the prices of domestically produced goods
CPI uses a fixed market basket to weigh the prices of diff goods
GDP Deflator weighs prices by their current levels of production (adjusts to changing consumption patterns over time)
Bureau of Labor Statistics (BLS) [p.76]
responsible for measuring the unemployment rate
surveys approx. 60,000 households
classifies everyone age 16+ → Employed, Unemployed, Out of the Labor Force
Employed [p.76]
if that person worked for pay full-/part-time during the previous week OR is on vacation/sick leave from a regular job
Unemployed [p.76]
if that person didn’t work during the previous week but made some effort to find paid employment during the past four weeks
Out of the labor force [p.76]
if that person didn’t work during the past week and didn’t actively seek work during the previous four weeks
BLS data from JULY 2020 [p.77]
COVID-19 pandemic: significant economic damage
260 million working-age persons, 160 million in labor force
61.4% labor force participation rate
143.5 million employed, 16.3 million unemployed
10.2% unemployment rate
July 2019: 3.4% unemployment rate
[Figure 41]
![<ul><li><p><u>COVID-19 pandemic</u>: significant economic damage</p></li><li><p>260 million working-age persons, 160 million in labor force</p><ul><li><p><strong>61.4%</strong> labor force participation rate</p></li></ul></li><li><p>143.5 million employed, 16.3 million unemployed</p><ul><li><p><strong>10.2%</strong> unemployment rate</p></li></ul></li><li><p>July 2019: <strong>3.4%</strong> unemployment rate</p></li></ul><p>[Figure 41]</p>](https://knowt-user-attachments.s3.amazonaws.com/30ac6719-a1fa-4c30-8298-2069f3618dce.png)
Frictional Unemployment [p.77]
unemployed who aren’t currently working b/c of the NORMAL process of matching employees and employers
Structural Unemployment [p.77-78]
unemployed b/c of mismatch btwn job openings and job-seekers
requires different skills/characteristics
no vacancies in sought-after positions
EX: 1980s U.S. steel industry contracting while computer industry was expanding (“creative destruction”)
laid-off steel workers in industrial northeast far from expanding Sunbelt industries
Cyclical Unemployment [p.78]
during recessions, lay-offs INC & new hires DEC, causing additional unemployment
Actual - Natural (NRU) = Cyclical
Natural Rate of Unemployment (NRU) [p.78]
frictional & structural unemployment (normal and generally positive parts of an economy)
generally a sustainable level of unemployment
if actual < NRU → inflation (economy pressures to raise prices)
if actual > NRU → recession (increased cyclical unemployment)
Circular Flow Model [p.78]
this diagram illustrates the complex set of interactions btwn the major sets of economic actors in our economy:
households, firms, the gov’t → rectangles
markets → ovals
flows ($, real things: goods, services, inputs to production) → arrows

Households - Circular Flow Model [p.78-79]
Receive income (GDP) by providing factors of production (labor, capital land) to firms
provide capital (goods) to firms in exchange for rental payments
use income to purchase goods & services and pay taxes
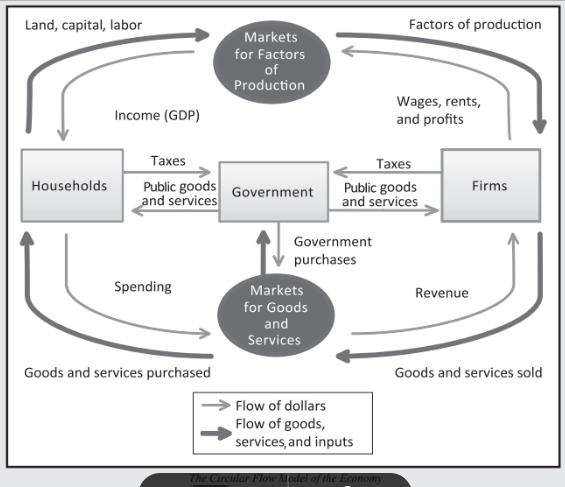
Firms - Circular Flow Model [p.79]
Receive revenue from the sale of goods & services
use income to pay for factors of production (must hire to produce the goods & services they sell)

The Government - Circular Flow Model [p.79]
Receives revenue from households as taxes & borrows from financial markets + businesses
uses revenue to purchase goods & services used to run gov’t & provide public goods + public services

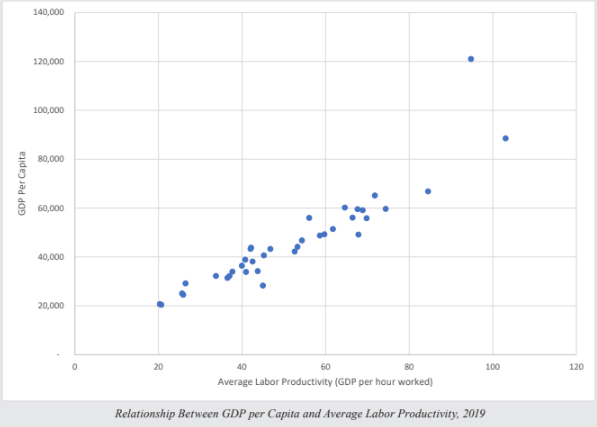
real GDP per Capita [p.80]
real GDP/capita = (real GDP/worker) x (fraction of population employed)
GDP/POP = GDP/N x N/POP
(POP = population, N = labor force)
avg quantity of goods & services available for consumption depends on the avg amt workers produce (avg labor productivity) & proportion of POP in production
Increase in output/person [p.80-81]
virtually all of the INC in output/person in the economy is explained by INC avg labor productivity
U.S. labor force participation has increased modestly in the last century w/ more women
lower birth rates reduced share of children, increased relative size of the working-age POP
these trends offset by earlier retirement + longer education
Physical Capital - Average Labor Productivity [p.81]
workers equipped w/ more & better tools, machinery, & up-to-date factories → more productive
modern methods → relies on large quantities of capital per worker (computers)
requires giving up present consumption
Human Capital - Average Labor Productivity [p.81]
the skills and experience acquired thru education, training + on-the-job experience
intangible, creating it usually requires sacrificing current consumption
Natural Resources - Average Labor Productivity [p.81]
contribute to the wealth of their citizens
EX: iron ore, petroleum, natural gas reserves
Saudi Arabia, Kuwait (oil)
Japan imports raw materials prod. elsewhere
Technological Knowledge - Average Labor Productivity [p.81]
advances are the MOST important in raising avg labor productivity historically
invention of entirely new products: semiconductors, integrated circuits, lasers, genetic engineering
development of better methods of organization: Henry Ford’s assembly line
Political / Legal Environment - Average Labor Productivity [p.81]
fluidity of know-how (patents, trade secrets, borrowed/learned techniques)
dysfunctional political/legal systems prevent many countries from fully exploiting the potential of modern manufacturing techniques
EX: North vs. South Korea post-WWII difference in living standards due to govt institutions
Research & Development (R&D) [p.82]
investment in the creation of new technological knowledge (desirable)
new knowledge is a true public good → private incentives may lead to underinvestment
important role for govt to encouraging thru tax credits, subsidies, direct expenditures, or legal protections
patent system (inventors’ temporary monopoly)
Saving vs. Investment [p.82]
(when someone has more income than they wish to spend) VS. (the purchase of new capital equipment)
Financial Markets [p.82]
institutions through which individuals who have money they wish to save can supply these funds directly to persons/companies that wish to borrow money for investment
Bond [p.82]
certificate of indebtedness that specifies the obligations of the borrower to the holder of the bond (~IOU)
specifies Date of Maturity = when the loan will be repaid
also specifies rate of interest to be paid periodically until the loan is repaid
large corporations (i.e. Wal-Mart) can sell bonds to the public to finance new stores
The Bond Market [p.82-83]
what the purchaser of the bond receives
Principal = the promise of repayment of the original amount (“face/par” value @ maturity/expiration)
bonds are sold at a “discount” to this value, determined by interest rates
price of a bond is INVERSE to the interest rate to make the previously issued bond attractive to investors
periodic interest payments
“Coupon” Rates = additional payments unattached to discount rate, determined @ issuance of the bond
…post-purchase…
purchaser can hold the bond until maturity or sell it to someone else
price will update according to interest rates → RISK TAKEN by purchaser
RISK: borrower may default on their obligation by declaring bankruptcy
this probability depends on the financial conditions of the borrower
the greater risk = higher rate of interest borrowers must pay
U.S. Govt “safe credit risk” can borrow @ lower rates than private companies
financially shaky corps. must pay high interest rates
Stock [p.83]
each share of stock represents ownership of a portion of a firm
Equity Finance [p.83]
sale of shares of stock
purchasers of stock face greater risk than that of bonds, but they also have a greater potential for high returns
Benefits of company profit = payment of dividends or INC in the value of owned shares
Debt Finance [p.83]
sale of bonds
lesser risk compared to stocks, but benefit only by interest payments
Organized Stock Exchange [p.83]
where buyers of stock in a corp. can sell those shares
EX: New York Stock Exchange (NYSE) or NASDAQ (National Association of Securities Dealers Automated Quotation System)
price at which shares can be sold depend on the supply of / demand for shares in the company
when shares are traded on an SE, the company doesn’t receive any revenue from these transactions, and they also don’t contribute to investment BUT contribute to shareholders’ willingness to hold assets
Intermediary [p.83]
third party that acts as a link between two others
Developed economies link savers & borrowers → banks, mutual funds
Banks [p.83]
banks pay their depositors interest & charge borrowers more than they pay to depositors
the difference covers the costs of accepting deposits & making loans + risk of lending $, providing profits for the bank owners
Little to No Risk to depositors (fully insured, can be withdrawn at any time)
all risk borne by bank owners
banks also facilitate purchases of goods & services by providing checking accounts
Mutual Funds [p.83]
mutual funds purchase a portfolio of stocks & bonds and sell shares to savers
value of shares fluctuates w/ value of portfolio of assets owned
shareholders assume ALL of the risks of variation
make it possible to achieve a higher degree of diversification than would be feasible thru direct purchases of assets
also provides access to the knowledge & insight of professional money managers
Production (GDP) = Income = Expenditures [p.84]
Y = C + I + G + NX
Y = income, C = consumption expenditures, I = investment, G = govt purchases, NX = net exports
Savings = Investment (S = I) [p.84]
Y - C - G = I
closed economy: no NX (net exports)
(Y - C - G) = national savings
income - household expenditures - govt expenditures
I = investment
National Savings = (Private) + (Govt) [p.84]
S = Y - C - G = (Y - C - T) + (T - G)
closed economy: no NX (net exports)
T = net taxes
(Y - C - T) = private saving
amt. of $ households have left over after paying taxes + consumption
(T - G) = govt saving
T/taxes = govt income
(+) → budget surplus
(-) → budget deficit
deficit: DEC investment and growth rate of living standards
Open Economy [p.84-85]
domestic savings ≠ domestic investment (international borrowing/lending)
residents interact w/ citizens of other countries (world market: goods/services, or world financial markets)
Net Capital Overflow [p.85]
(purchase of foreign capital or financial assets by domestic residents) - (purchase of domestic assets by foreigners)
EX: Inbev (Brazilian-Belgian brewing company) bought Anheuser-Busch (American company) → foreign purchase of domestic assets are subtracted → net capital outflow DEC
EX: Intel builds a new factory in Taiwan → domestic purchase of foreign assets increase first value → net capital overflow INC
Foreign Direct Investment [p.85]
a company or individual acquires assets in a foreign country that they will manage actively
EX: Mitsubishi purchases Rockefeller Center, NY in 1989
Portfolio Investment [p.85]
an individual or business purchases shares of stock or bonds issued by a foreign corporation
EX: Chinese govt purchases U.S. govt bonds
Open Economy: Net Capital Outflows (NCO) = Net Exports (NX) [p.85]
NCO = (foreign purchases by domestic) - (domestic purchases by foreigners)
EX: Electronics Importers imports $100,000 worth of Japanese goods; Japanese producer invests in/consumes U.S. assets to balance change in NX
S = I + NCO (domestic savings = domestic investment + net capital outflows)
open economy: savings can differ from investment but only to the extent that the difference is offset by NCO
Financial Market: Interest Rate [p.86]
supply & demand of/for savings (demand by firms for funds to purchase/construct new capital, or investment) are equalized thru adjustments of the interest rate
interest rate functions as the price of a loan (amt. borrowers must pay for the loan and savers receive for making it)
lender: decision to save $1 is to postpone consumption until some time in the future
saver: principal motivation for saving is the possibility of consuming more in the future
EX: Interest Rate = 10%/year
saver who lends $100 will receive $110 the following year
[Figure 44]
![<p>supply & demand of/for savings (demand by firms for funds to purchase/construct new capital, or investment) are equalized thru adjustments of the interest rate</p><ul><li><p>interest rate functions as the price of a loan (amt. borrowers must pay for the loan and savers receive for making it)</p><ul><li><p>lender: decision to save $1 is to postpone consumption until some time in the future</p></li><li><p>saver: principal motivation for saving is the possibility of consuming more in the future</p></li></ul></li><li><p>EX: Interest Rate = 10%/year</p><ul><li><p>saver who lends $100 will receive $110 the following year</p></li></ul></li></ul><p>[Figure 44]</p>](https://knowt-user-attachments.s3.amazonaws.com/4625efec-a488-4510-b50b-1801a3f13a0b.png)
Fisher Equation (Real Interest Rate) [p.86]
real = (nominal interest rate) - (rate of inflation)
EX: prices INC $10/year, it will take $110 next year to purchase a bundle of goods that costs $100 today → real interest rate = 0 (saver receives no increase in purchasing power from postponing their consumption)
Equilibrium in the Financial Market [p.86-88]
the higher the real interest rate, the greater the rewards for being patient, the greater the amt. that people will choose to save → supply of savings is upward-sloping
the lower the real interest rate, the larger the # of investment projects that businesses will find profitable to pursue → demand curve for savings is downward-sloping
[Figure 44]
![<p>the higher the real interest rate, the greater the rewards for being patient, the greater the amt. that people will choose to save → <strong>supply of savings is upward-sloping</strong></p><p>the lower the real interest rate, the larger the # of investment projects that businesses will find profitable to pursue → <strong>demand curve for savings is downward-sloping</strong></p><p>[Figure 44]</p>](https://knowt-user-attachments.s3.amazonaws.com/8b2aa270-66f1-4b88-aeb5-c8e84b888273.png)
Real Interest Rate Equilibrium [p.88]
real interest will equilibrate (shortage = interest rate below EQ, borrowers can’t find enough savers willing to lend them funds & competition to obtain the available funds drives up real interest rate; surplus = interest rate above EQ, excess supply of funds & competition btwn lenders to find borrowers willing to take their funds lowers real interest rate)
real interest rate = price of making investments (EX: businesses’ additional capital equipment acquired will raise future revenues)
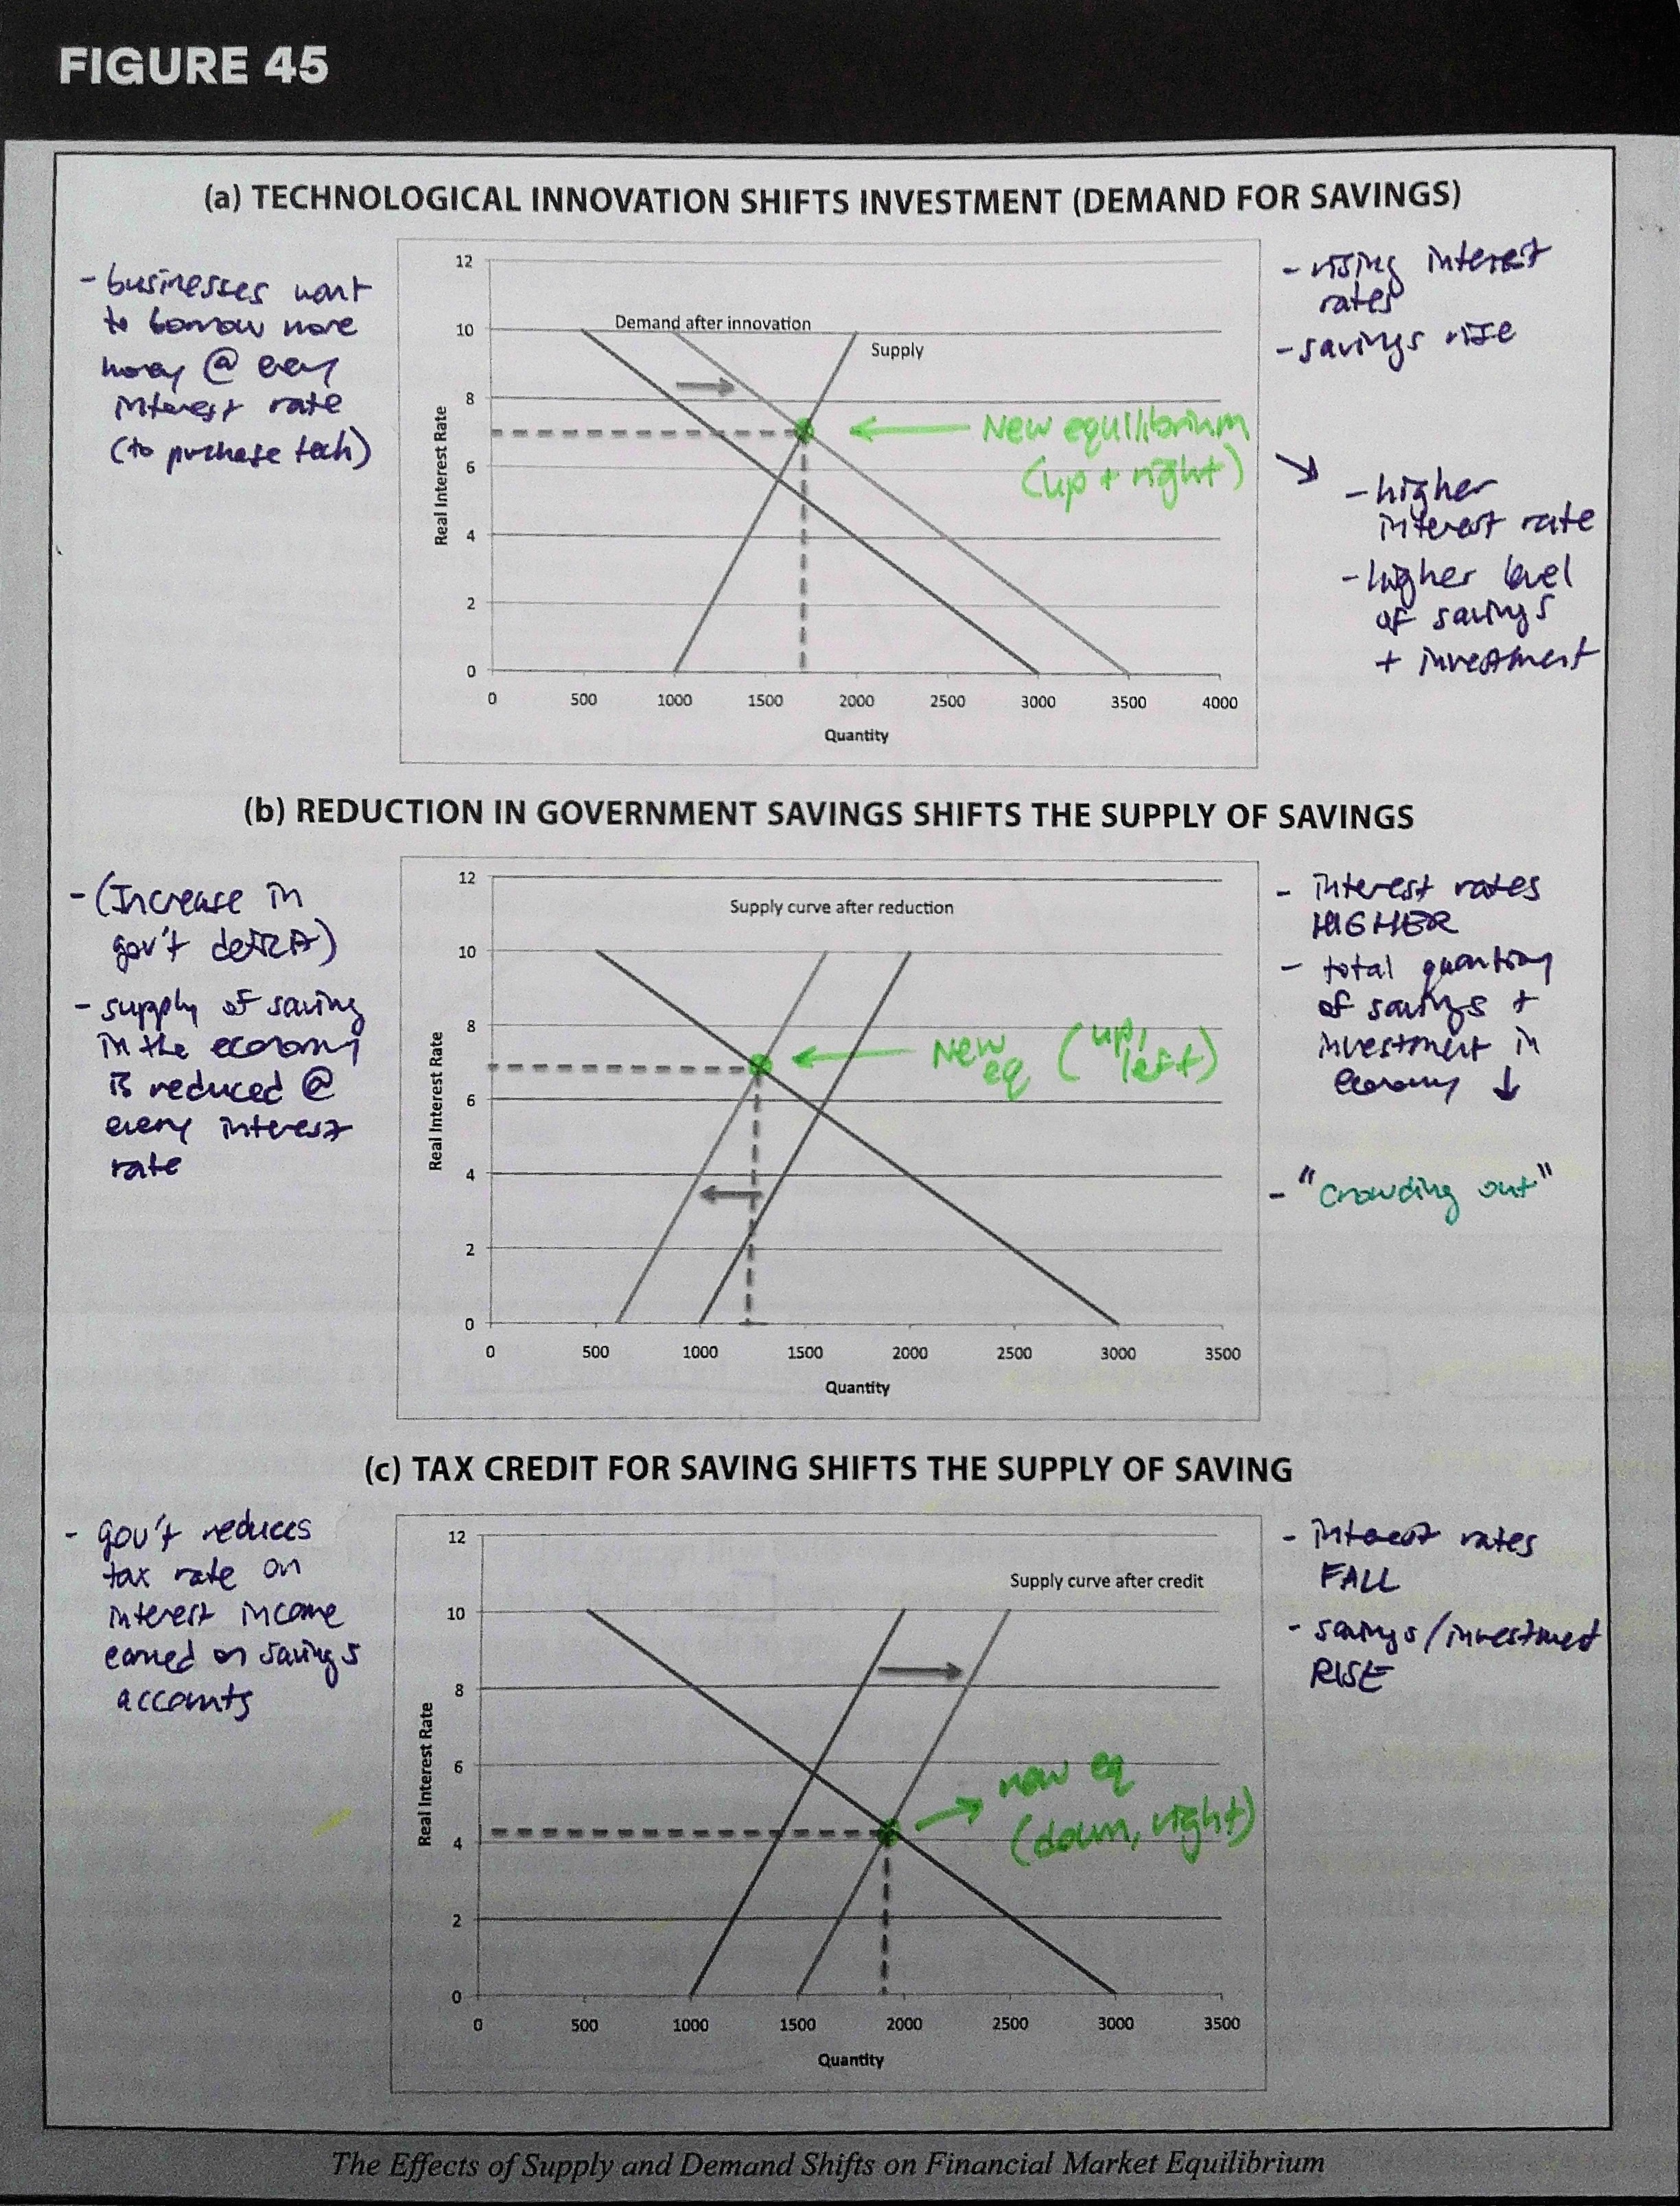
Supply & Demand Shifts on Financial Market Equilibrium [p.88]
Panel A - new technology raises productivity of capital → new EQ @ higher interest rate and higher level of savings & investment
Panel B - increase in govt deficit/reduction in govt saving → higher interest rate, lower level of savings & investment
crowding out = tendency of govt deficits to reduce private investments
Panel C - govt tax credit encourages savings → interest rates fall, savings & investment increase