Water and Carbon
1/48
There's no tags or description
Looks like no tags are added yet.
Name | Mastery | Learn | Test | Matching | Spaced | Call with Kai |
|---|
No analytics yet
Send a link to your students to track their progress
49 Terms
Water cycle as a natural system
- inputs, outputs, stores, flows, transfers
closed system = matter not transferred over boundary (water cycle)
open system = matter and energy in/out (drainage basin)
in the closed water cycle the annual precipitation and annual evapotranspiration are equal meaning no overall net water loss
in the open drainage basin system, inputs/outputs easily changed with increasing temps/variations in precipitation
eg. rise in temperature can cause increased glacial melt and a greater input of water, disrupt balance/ magnitude of water store
flows = linkages between stores
- infiltration
- percolation - vertical movement of water into rock
- ground water flow - lateral movement through soil
- streamflow (output)
- overland flow - surface run off over saturated/impermeable surfaces
- precipitation (input)
- evapotranspiration (output)
stores = hold mass/energy
- soil water
- groundwater
- surface storage
- interception - vegetation stored water
- river channels
Water cycle as a natural system
- dynamic equilibrium in systems
dynamic equilibrium = when the inputs and outputs to a system are balanced - system experiences a lack of change
+ve feedback - water cycle - system away from equilibrium
- increased global temperatures increase water evaporation
- the hotter atmosphere can hold a higher capacity of water vapour
- water vapour acts as a greenhouse gas, trapping solar radiation and causing accelerated warming
-ve feedback - water cycle - system towards equilibrium - balancing mechanism
- warming planet increases evaporation
- water vapour condenses to form clouds
- clouds reflect solar radiation back to space
- cooling effect
Carbon cycle as a natural system =
- feedback loops
carbon cycle = closed system
positive feedback = accelerates an action
increase in temperature causes more forest fires, more CO2 release, more temperature increase
negative feedback = effects of an action nullified by subsequent knock on effects
increase in CO2, carbon fertilisation, increase in plant growth, increased photosynthesis, decrease in CO2
Carbon cycle as a natural system =
- fast vs slow cycles
fast carbon cycle
- photosynthesis
- respiration
- fires
- forest fire combustion
slow carbon cycle
- chemical weathering - co2 mixes with rainwater to form carbonic acid - slow erosion of limestone rocks - co2 moves through water cycle to oceans
- burial/compaction
- natural sequestration (carbon dioxide storage in oceans - acidifies oceans due to carbonic acid formation)
Carbon cycle as a natural system =
- flows
- photosynthesis - takes in CO2
- decomposition - release CO2
- combustion - releases vegetation stores
- weathering/erosion - carbonate compounds carbon is released
- sequestration
- rock cycle - carbon locked into compounds
Carbon cycle as a natural system =
- stores
- atmosphere - CO2/CH4/greenhouse gases
- plants/animals
- ocean
- deep sediments - coal,oil,gas
Global distribution of major water stores
- lithosphere
solid outer part of earth, upper portion mantle + crust
- ground water in rock pore spaces - extracted for agriculture
- soil water, affects flood risk/runoff
Global distribution of major water stores
- hydrosphere
water on planet surface, underground and in the air
- 96% total global water stored in oceans
- 2.5% freshwater
- terrestrial water, lakes, ponds, rivers
Global distribution of major water stores
- cryosphere
water frozen in ice and snow - solid
- ice sheets - compressed snowfall -raise sea level when melted - Greenland/Antarctica
- permafrost - ground below 0oC for 2 years
- sea ice - no impact on sea level if melted
Global distribution of major water stores
- atmosphere
layer of gas surrounding the planet
- water vapour - acts as a greenhouse gas absorbing solar radiation, allows life to be maintained
Changes in magnitude
evaporation, condensation, cloud formation
evaporation = occurs when solar radiation causes liquid -> gas
- varies due to water available, solar energy, air humidity, air temp
condensation = direct cause of all precipitation
- air temp reduces but volume remains constant, cooler air can hold as much water vapour - cloud formation
Changes in magnitude
changes to the crysophere
long term = interglacial/glacial periods: colder intervals more water stored as ice
- last glacial period 18,000 years ago - 1/3 earths land covered in glaciers/ice sheets
current = interglacial period - global ablation exceeds accumulation - reduction in cryological stores
seasonal =
accumulation - addition to ice via snowfall
ablasion - loss of ice via melting and evaporation
Arctic winter - 17 million sq/km ice
Arctic summer - 7 million sq/km
Changes in magnitude =
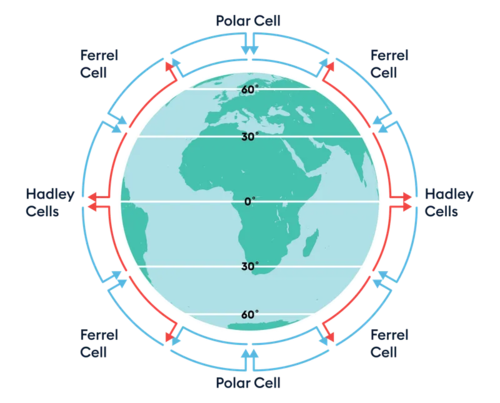
- global changes in the atmosphere (high/low pressure cells)
high pressure =
found either side of the equator
- cool air sinks, no clouds form - no precipitation
low pressure =
found at equator
- warm air rises, cools + condenses to form clouds - precipitation
polar cell, ferrel cell, hadley cell, ITCZ, hadley cell, ferrel cell, polar cell
ITCZ = intertropical conversion zone - between hadley cells at the equator
- area of low pressure that moves, changes seasonally, moves monsoon patterns
- brings heavy monsoon season to Bangladesh in Northern Hemisphere summer
Changes in magnitude =
- rainfall formation
- hot air descends and warms causing drier conditions
- relief - warm air rises over mountains
- convectional - sun heats land and air
- frontal - warm front meets cold front, heavier cold front sinks, warm front rises
Changes in magnitude =
- climate change impacts
- increased net loss of ice
- increased evaporation rate due to higher energy
- increased rainfall in areas of low pressure, warmer atmosphere can hold more precipitation
- 85% increase in heavy rainfall events in India in last 10 years
- increased drought severity in high pressure areas
- exacerbation of weather extremes
Drainage Basins
- as a system: inputs, stores, flows, outputs
drainage basin = area of land drained by a river and its tributaries
watershed = boundary that separates drainage basins
open system = water enters + leaves
inputs: precipitation
outputs: evaporation, transpiration, river flow
stores: vegetation, surface storage, groundwater, channel storage (short term)
flows: ground water flow, percolation, surface run off, infiltration, stem flow (intercepted water down plant)
percolation/ groundwater storage - only parts of water cycle not linked to carbon cycle
- due to gravity moving water down through water
Drainage Basins
- impacts that change stores/flows in the hillslope water cycle
factors impacting hillslope water cycle:
- deforestation: less trees - reduces interception, increases overland flow
- storms: higher precipitation input, increases surface/ground storage
- seasonal variations: winter snowfall melt increases river channel output, frozen ground prevents infiltration
- urbanisation: reduces infiltration/interception - increases overland flow and therefore flood risk
- farming - irrigation increases surface water stores, ditches promote overland flow into rivers
Drainage Basins
- changes to inputs/outputs to/from drainage basin
factors changing inputs/outputs =
- increased/reduced precipitation
- cooler temps - reduces evaporation
- increased human abstraction of groundwater
- increased farming - plants take up soil water
- increased temperatures increasing amount of summer meltwater from ice sheets
- groundwater recharge projects
Drainage Basins
- water balance + soil water budget
water balance =
balance of inputs and outputs into the drainage basin system
run off expressed as a % of precipitation
- affected by precipitation, vegetation, urbanisation, topography, soil type
soil water budget =
rainfall - evapotranspiration used to show changes in soil water stores over the year
- surplus vs deficit - seasonal variations
- local scale change
- due to variations in temperature/ precipitation
summer: higher temps, less precip = reduced soil stores
Run off variation and the storm hydrograph
- factors influencing run off
Factors influencing run off =
- antecedent rainfall - previous rainfall that has occured in the area, may mean stores are high/low, soil is saturated/unsaturated
- soil permeability - impermeable soils make it harder for water to infiltrate/percolate down into groundwater stores, increases surface run off
- rainfall heaviness - heavy storms with a large volume of input increase surface run off rates
- urbanisation/ deforestation - more impermeable surfaces/ less interception
run off is 45% higher in urbanised areas
deep infiltration is 20% lower
Run off variation and the storm hydrograph
- analysis of a hydrograph
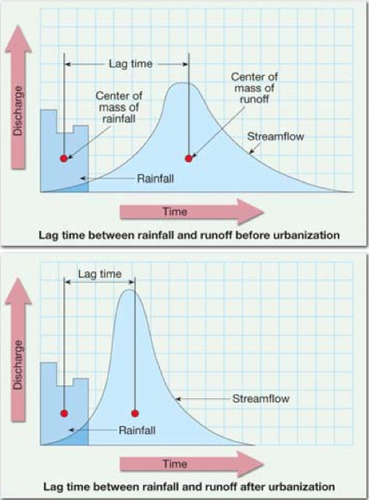
Storm hydrograph =
tells us how fast a river floods following rainfall
- river discharge shown on a line graph
- rainfall show as a bar graph
- hours from start of rainfall shown on x axis
rising limb = rising water level of river - steeper = rapid increase
peak flow = maximum river discharge
falling limb = falling level of flood water in the river
base flow = normal amount of water found in river
lag time = time difference between peak rainfall and peak discharge
- shorter lag time = faster flooding
Changes in the water cycle over time (natural variation/human impacts)
- storm events
El Niño
- physical factor driving change
- every 6 years warmer water replaces cooler water off South American coast - directly impacts local and global weather
- 2023 El Niño flooding in Peru: increased precipitation in tropical areas, increased surface runoff/floods due to quickly saturated soils
- exacerbated Colombia drought
- warming of Pacific Ocean at equator
- May 2023 flood - 520,000 affected - torrential rain created a humanitarian crisis
California fires 2012-2016 =
- long term result of extended drought periods - lack of water and dried soils/vegetation
- vegetation destroyed - reduced evapotranspiration/interception
- heat and dry air increase soil evaporation - dries soils
Changes in the water cycle over time (natural variation/human impacts)
- seasonal changes
UK summer
- less rainfall, reduced ground water stores/surface run off/soil moisture
- rapid vegetation growth - high interception - drought
UK winter
- average 350mm winter rainfall
- higher precipitation, reduced vegetation interception
- increased surface run off/channel flow - ground water stores/soil moisture increases
Changes in the water cycle over time (natural variation/human impacts)
- farming practises
- pastoral farming (livestock) compacts ground - reduces water infiltration - increases surface run off rates
- arable farming (crops) increases rates of interception/evapotranspiration, increased irrigation can cause excess surface water stores/runoff
Changes in the water cycle over time (natural variation/human impacts)
- land use change
- urbanisation replacing permeable surfaces with impermeable concretes/tarmacs
- removal of trees, replaced with housing estates/exposes soils
Changes in the water cycle over time (natural variation/human impacts)
- water abstraction
- water abstracted from aquifers for irrigation, industry, domestic use
- removed and consumed faster than replenished/recharged
- reduced ground water stores - water scarcity
- reduced water quality - higher pollutant concentrations
- groundwater depletion accounts for about 60% of the region's freshwater loss
Global distribution of major carbon stores
- lithosphere
inorganic - fossil fuels, sedimentary rocks (compressed layers of carbon rich sediments) long term
organic - leaf litter, soil hummus short term
Global distribution of major carbon stores
- hydrosphere
sequestration of carbon into oceans - acidification of oceans from carbonic acid
Global distribution of major carbon stores
- biosphere
19% all carbon stored in living plants - photosynthesis
carbon sinks - store more carbon than they release
carbon source - releases more carbon that sequestrates
boreal forests = highest storing ecosystem - trees dont lose leaves
deserts = lowest storing ecosystem - little biomass/decomposers to break it down
Global distribution of major carbon stores
- cryosphere
contains less than 0.01% earths carbon
- stored in permafrost - protect from melting to prevent release
Global distribution of major carbon stores
- atmosphere + keeling curve
Atmosphere =
CO2 makes up 0.04% atmospheric gases
- highest recorded atmospheric prescence for 20 million years
Keeling curve =
shows that despite seasonal fluctuations CO2 atmospheric levels are at their highest, have been increasing since 1880s (start of the industrial revolution )
- measurements taken from Mauna Loa Observatory
- 310 ppm in 1960 to 390 ppm in 2010
- only half of anthropogenic (human caused) carbon emissions can be absorbed by ocean/land plants
Factors driving carbon cycle change
- plant/sere flows and transfers
plants =
summer - increased carbon stored as green leaves photosynthesise, CO2 taken in from the atmosphere, stored in trunk/root systems
winter - leaves fall of, decompose, release carbon into soil/atmosphere, reduction in stores
sere level =
sere = stage of vegetation succession - plant community develops/becomes more complex over time
Factors driving carbon cycle change
- carbon cycle, climax community, carbon budget
carbon cycle in lithosere environment =
- plants - take in CO2 in photosynthesis, released in decomposition
- decomposers - break down biomass, release carbon back into soils - respire releasing CO2
- carbon transfer of animals to plants
- CO2 released to atmosphere in respiration
climax community = stable carbon cycle, fully developed ecosystem - equilibrium can counteract change (exceptions of major climatic/geographical change)
carbon budget =
amount of carbon stored and transferred on both global and local scales between biosphere, lithosphere, atmosphere
amount of greenhouse gases that can be "spent/emitted" to cause a given level of global warming
- aims to keep temperature rise to no more than 2oC more than pre-industrial temperature
- since industrial revolution - 52% budget used up
Factors driving carbon cycle change
- greenhouse effect
- solar radiation from the sun is absorbed by earths surface warming it up
- infrared radiation reflected by earths surface either passes out the atmosphere into space or is reflected and remitted back to earth by greenhouse gases and clouds in earths atmosphere
Factors driving carbon cycle change
- anthropogenic carbon
- released through transport, industry, production
- builds up in atmosphere - amplifies greenhouse effect
- absorbs heat energy - radiates radiation back to earth
Impacts of changing carbon/ global warming
- on land
carbon fertilisation
- more CO2 available in atmosphere aids photosynthesis/plant growth, growth limited by water/nutrients
- occured on 1/4 earths vegetated land in last 35 years
longer growing seasons
- rising temperatures aid plant growth in certain climates + increases evapotranspiration rates - more precipitation
tundra warming
- increased rate of decay of dead/organic matter - accelerates methane/CO2 release
- melting of permafrost (stores 25-50% of organic carbon in soils)
Impacts of changing carbon/ global warming
- on oceans
acidification
- 30% released carbon dissolved in oceans - carbonic acid created, lowers pH, coral bleaching at Great Barrier Reef
- combined with warming decreases phytoplankton numbers - damages population of a keystone species - base of many food webs
melting sea ice
- 40% Arctic sea ice retreated in last 35 years
- highly reflective ice replaced by darker water with a lower albedo value - absorbs more heat - amplifies warming
sea level rise
- rising by 3.5mm a year since 1990s
- higher ice melt in summer
- thermal expansion of warmer water
Changes in the carbon cycle over time
- wildfires
- increased frequency due to increasing temperatures
- positive feedback loop - increased combustion rises CO2 levels
- usually fires cause no significant fluctuations in carbon levels but the increasing magnitude and intensity of wildfires due to global warming is disrupting natural balance
- Chinchaga Fire, Canada (1950) - lasted 5 months
due to period of burning there was a slow fire recovery time
- without vegetation recharge CO2 couldn't be drawn out of the atmosphere
- long term impact on local carbon levels
Changes in the carbon cycle over time
- volcanic activity
- volcanoes emit 140-380 million metric tonnes CO2/year (natural factor)
US Geological Survey "CO2 released in recent volcanic eruptions has never caused detectable global warming of the atmosphere"
- warming effect of CO2 counteracted by sulphur dioxide released - it forms sulphuric acid droplets which reflect solar radiation back to space - cooling effect
- volcanoes have released less than 1% of the CO2 released by human activities
- Kilauea Hawaiian eruption in 2007 released 30,000 metric tonnes of CO2
Changes in the carbon cycle over time
- deforestation
- for development of agriculture, urbanisation of land, resource use (timber for development/construction)
- forests are key carbon sinks (sequester more carbon than they emit) Amazon stores more than 150 billion tons of CO2
- deforestation causes 20% global carbon emissions
- small scale: slash/burn subsistence farming - Central Africa
Changes in the carbon cycle over time
- agriculture
- animal methane emissions increased by 11% between 2001 and 2011 due to increased agriculture - changing global consumption patterns increasing cattle farming
- ploughing of soils for arable farming introduces oxygen - accelerates break down of organic matter - carbon released
Changes in the carbon cycle over time
- keeling curve
shows that despite seasonal/annual fluctuations atmospheric CO2 level rising since industrial revolution - 1800s
industrialisation/ fossil fuel burning
- most sig. human factor driving carbon cycle change
global industrialisation: 1760-1830 started
- development of manufacturing = high energy demands
- increased hydrocarbon extraction (formed through organic material compression over millions of years)
- significant impact on stores of carbon cycle in lithosphere from extraction - green house gases in combustion released to atmosphere
- irreversible damage to coal/oil/gas stores - length of time needed to recharge/replenish stores - millions of years - natural process cannot be overcome by human intervention/technology
- 5B tonnes emitted per year in 1830
- 35B tonnes emitted per year in 2020
how accurately can experts quantify carbon contributions? - hard to distinguish where emissions are sourced from - human or natural factors - limitation when comparing the different impacts of factors on the carbon cycle
Human actions to mitigate climate change
- COP21
COP21
- top down approach - long term plan - global scale
- produced Paris Agreement - UN agreement of 197 countries to keep global temperature rise to less than 2oC more than pre industrial levels - carbon budget theory
- countries committed to going carbon neutral
success = unites countries to a set goal, creates higher awareness of necessary action
not successful = with current policies implemented by 2100 a global temperature rise of 2.5-2.9 will have occured
- not effective enough
- USA initially pulled out - reentered on Biden's first day in office (2021)
Human actions to mitigate climate change
- transport improvements
- national scale - intercountry policies/schemes
- increasing demand for faster/ more efficient transport increases exhaust emissions/fuel consumption
- transport sector accounts for 1/4 global energy related CO2 emissions
- HICs - aviation industry release 705 million tonnes of CO2 in 2013 - more than volcanoes
- promotion of walking/cycling - sustainable transport: London Boris Bikes - promote alternative travel methods - 12,000 in use
- not useful for long distances, not always accessible - 200 decommissioned per year
Human actions to mitigate climate change
- mangrove conservation and protection
- mangroves sequester 10x more carbon per hectare than typical woodlands - complex root systems make effective carbon stores, decayed matter trapped in submerged soils/sediments - don't burn/ decay quickly preventing carbon release
- oxygen poor conditions at roots reduce rate of decay
success = replantating projects in Sri Lanka - 10,000 acres replanted - reduces CO2 volumes in atmosphere, combats greenhouse effect
limitations = expensive £2.2 million cost - complex environments to restore balance in
Interrelationship of water and carbon in the atmosphere
- flows between water and carbon
- carbon sequestration into oceans
- photosynthesis/respiration transfer CO2/O2 between biosphere and atmosphere
- weathering: precipitation dissolves carbonate compounds in rocks - causes run off into oceans
- volcanic activity: releases water vapour + CO2 from lithosphere to atmosphere
- CO2 + water = acid rain
Interrelationship of water and carbon in the atmosphere
- impact of carbon change on water cycle
- increasing carbon, increases carbon fertilisation, accelerates growth of plants, increased evapotranspiration, increased precipitation
- greenhouse effect, increases evaporation, exacerbates global patterns of drought/precipitation (directly impacts drainage basin/hillslope water systems)
- increased rates of ice melting - sea level rise, increased water inputs to hillslope systems etc.
Interrelationship of water and carbon in the atmosphere
- positive/negative feedback loops
positive feedback loop (amplifies problems)
- increase in carbon/ greenhouse effect increases temperatures
- increased evaporation from oceans
- increased water vapour in the atmosphere
- water vapour acts a greenhouse gas increasing temperature
negative feedback loop (knock on impacts nullify)
- higher CO2 levels increase global temps
- increased evaporation/water vapour
- carbon fertilisation/ more precipitation boosts plant growth
- plants photosynthesis reducing atmospheric CO2 levels